ICT MultiPeriod Range Boxes PO3

ICT Multi-Period Range Boxes (PO3)
===================================

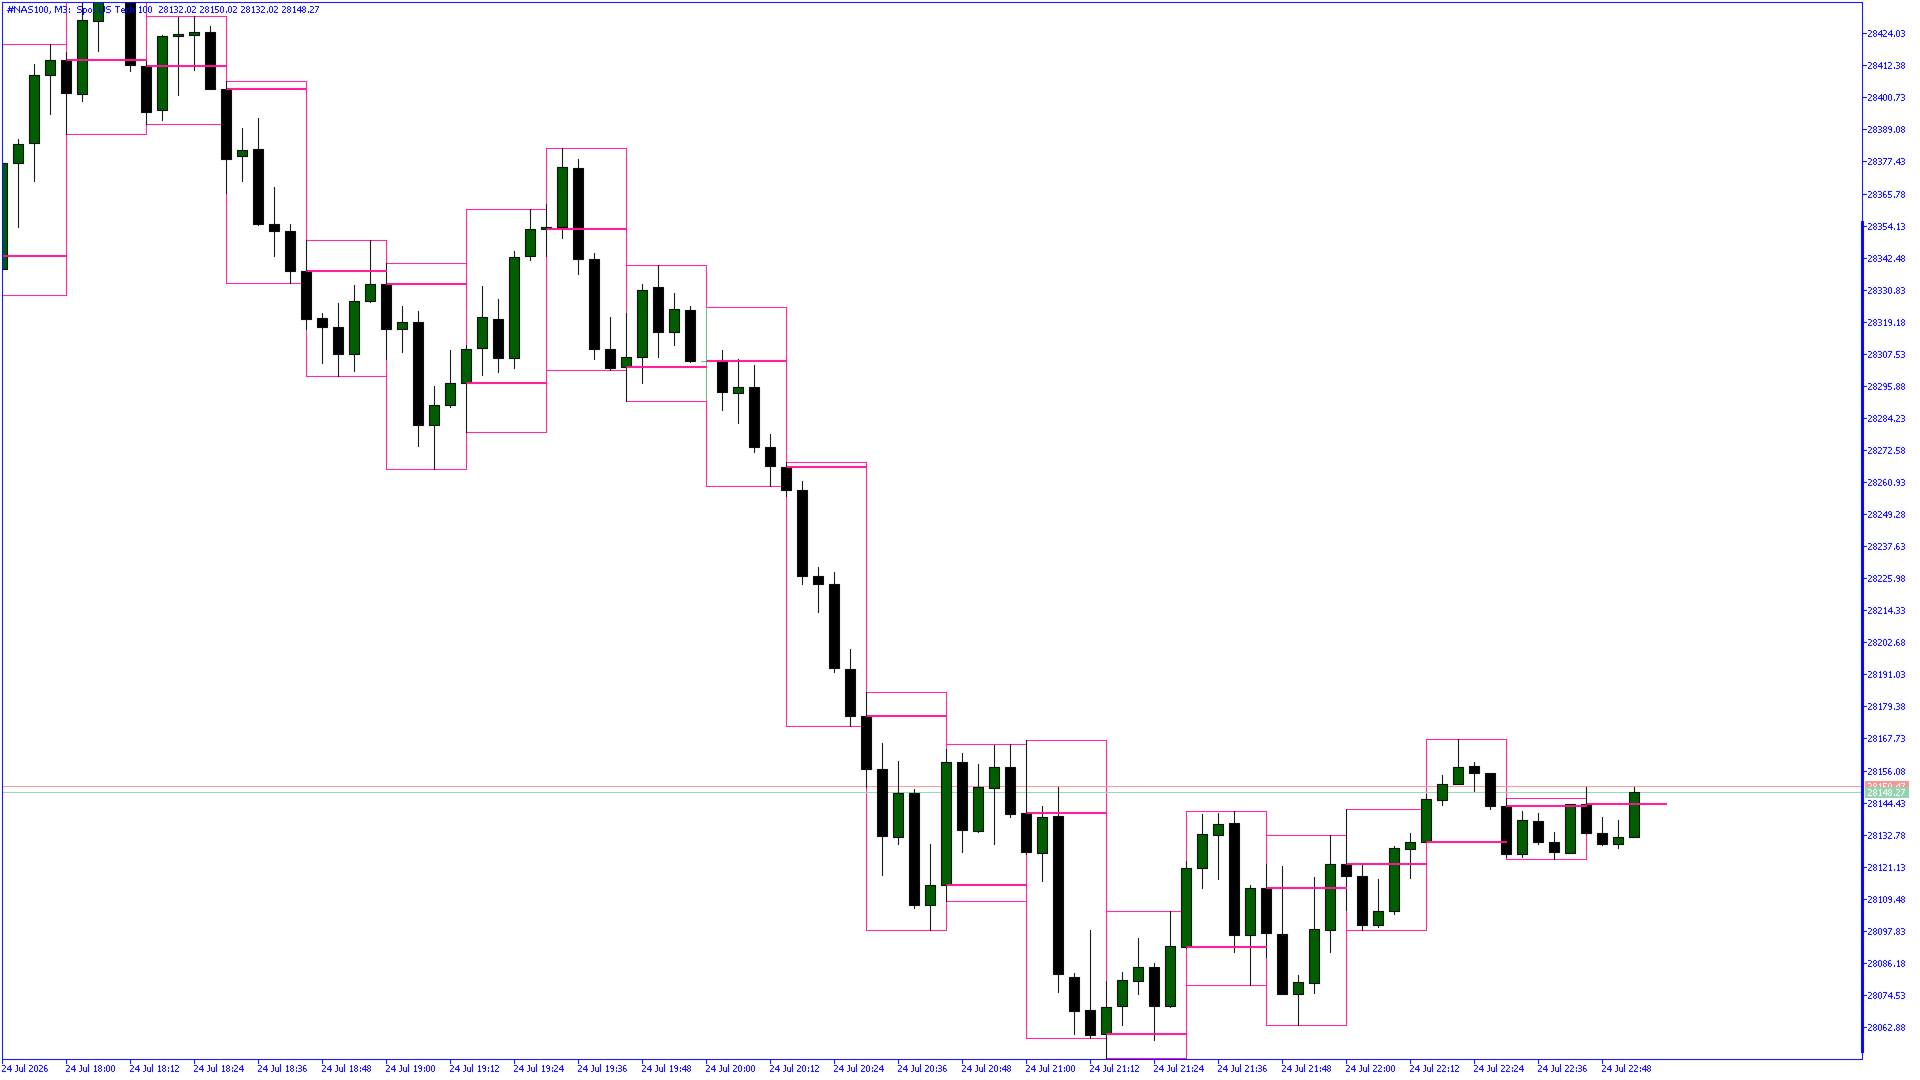
Visualize the Power of Three across every major timeframe — all in one indicator.


━━━━━━━━━━━━━━━━━━━━━━━━━━━━━━━━━━━━━━━━
OVERVIEW
━━━━━━━━━━━━━━━━━━━━━━━━━━━━━━━━━━━━━━━━

In ICT methodology, the Power of Three (PO3) describes how price moves within any given period: it opens, accumulates into a range, manipulates beyond one side of that range to hunt liquidity, then distributes in the true direction. Understanding where that range began and how far price has moved within it — at every timeframe simultaneously — is central to identifying high-probability trade locations.

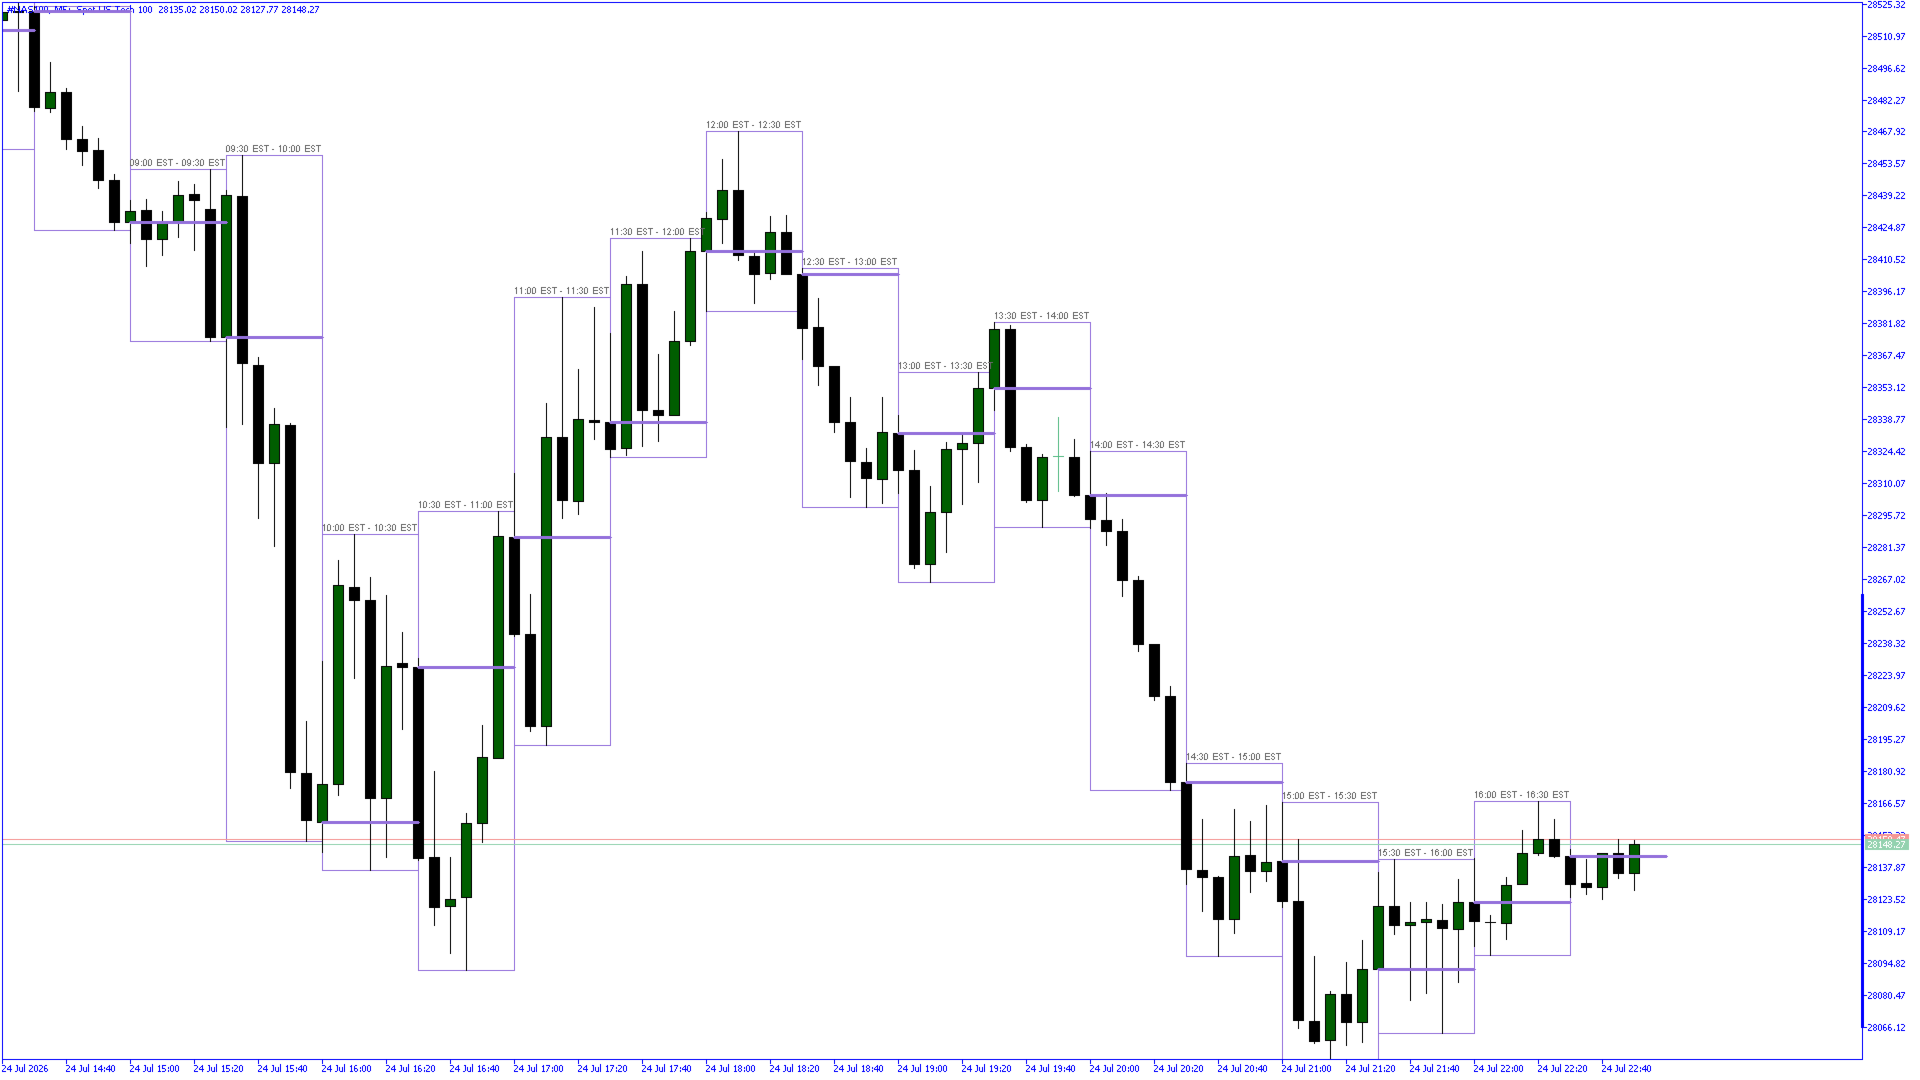
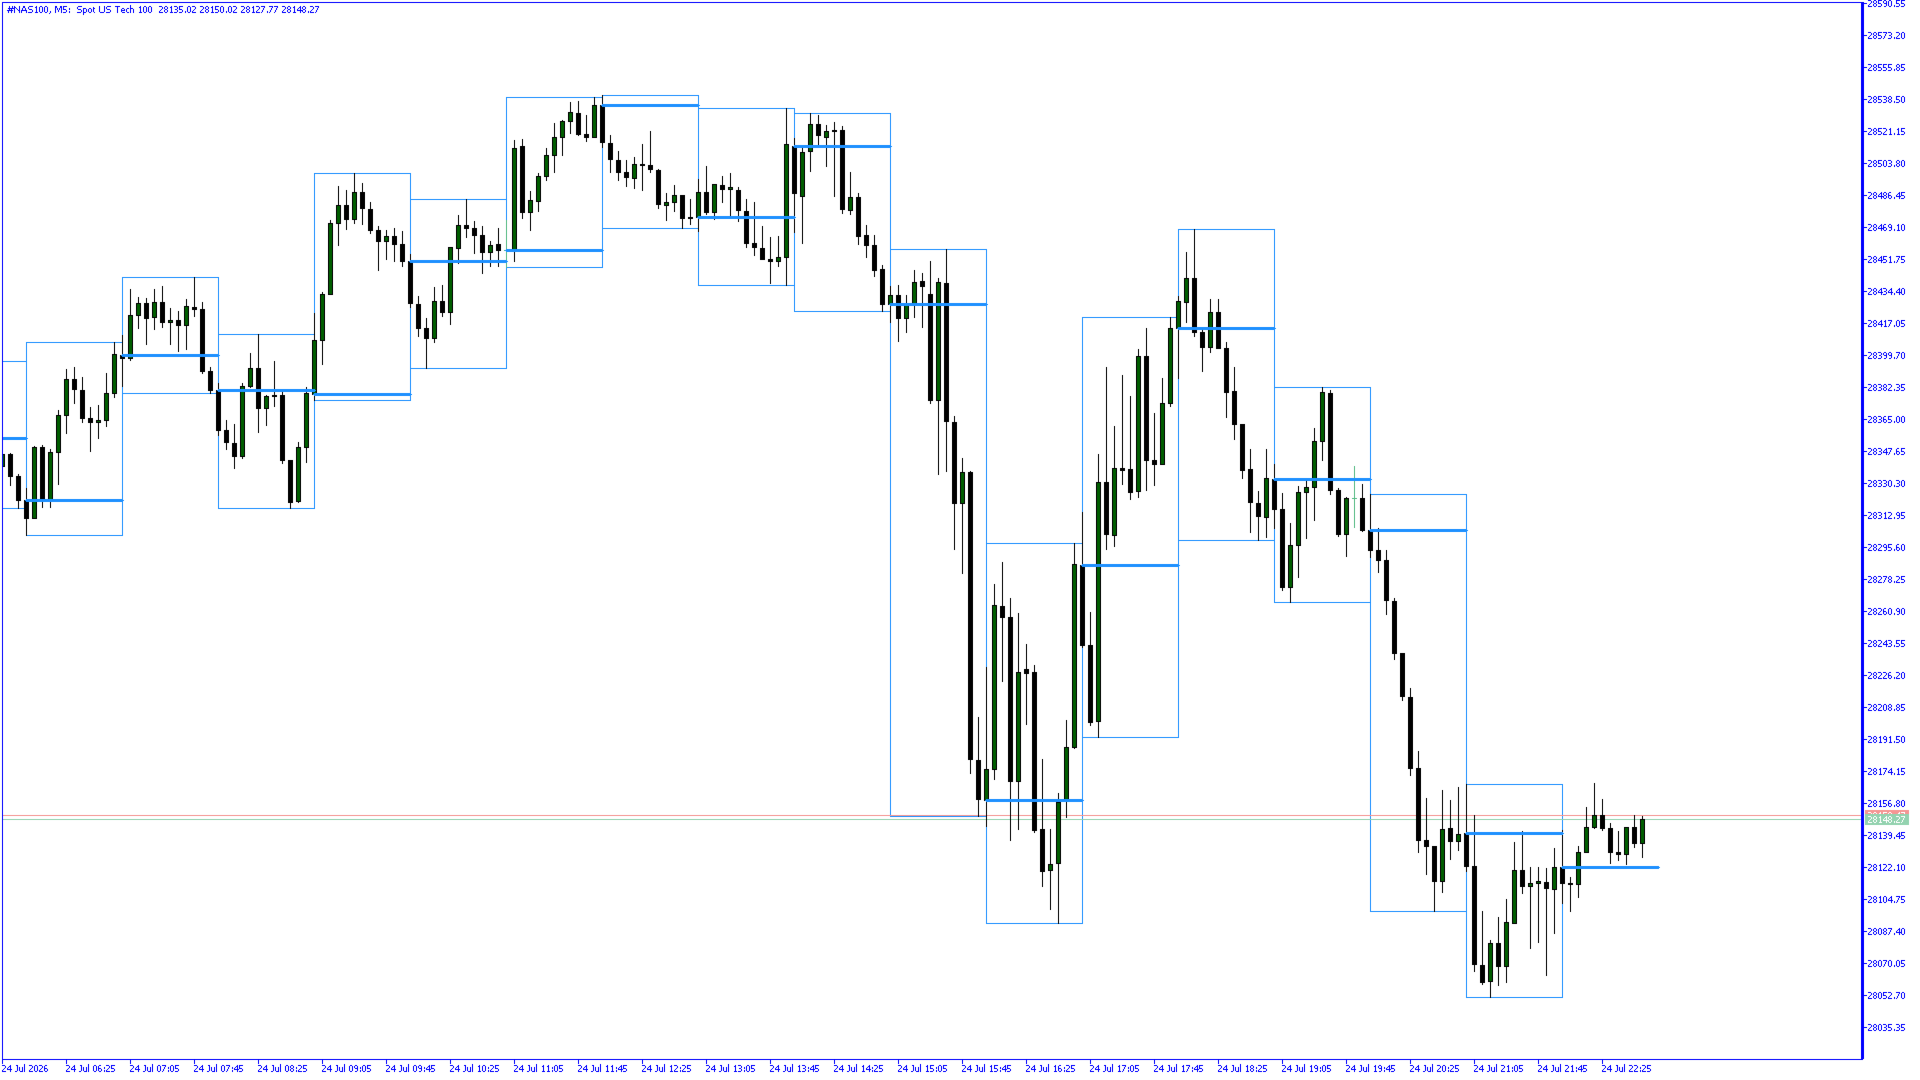
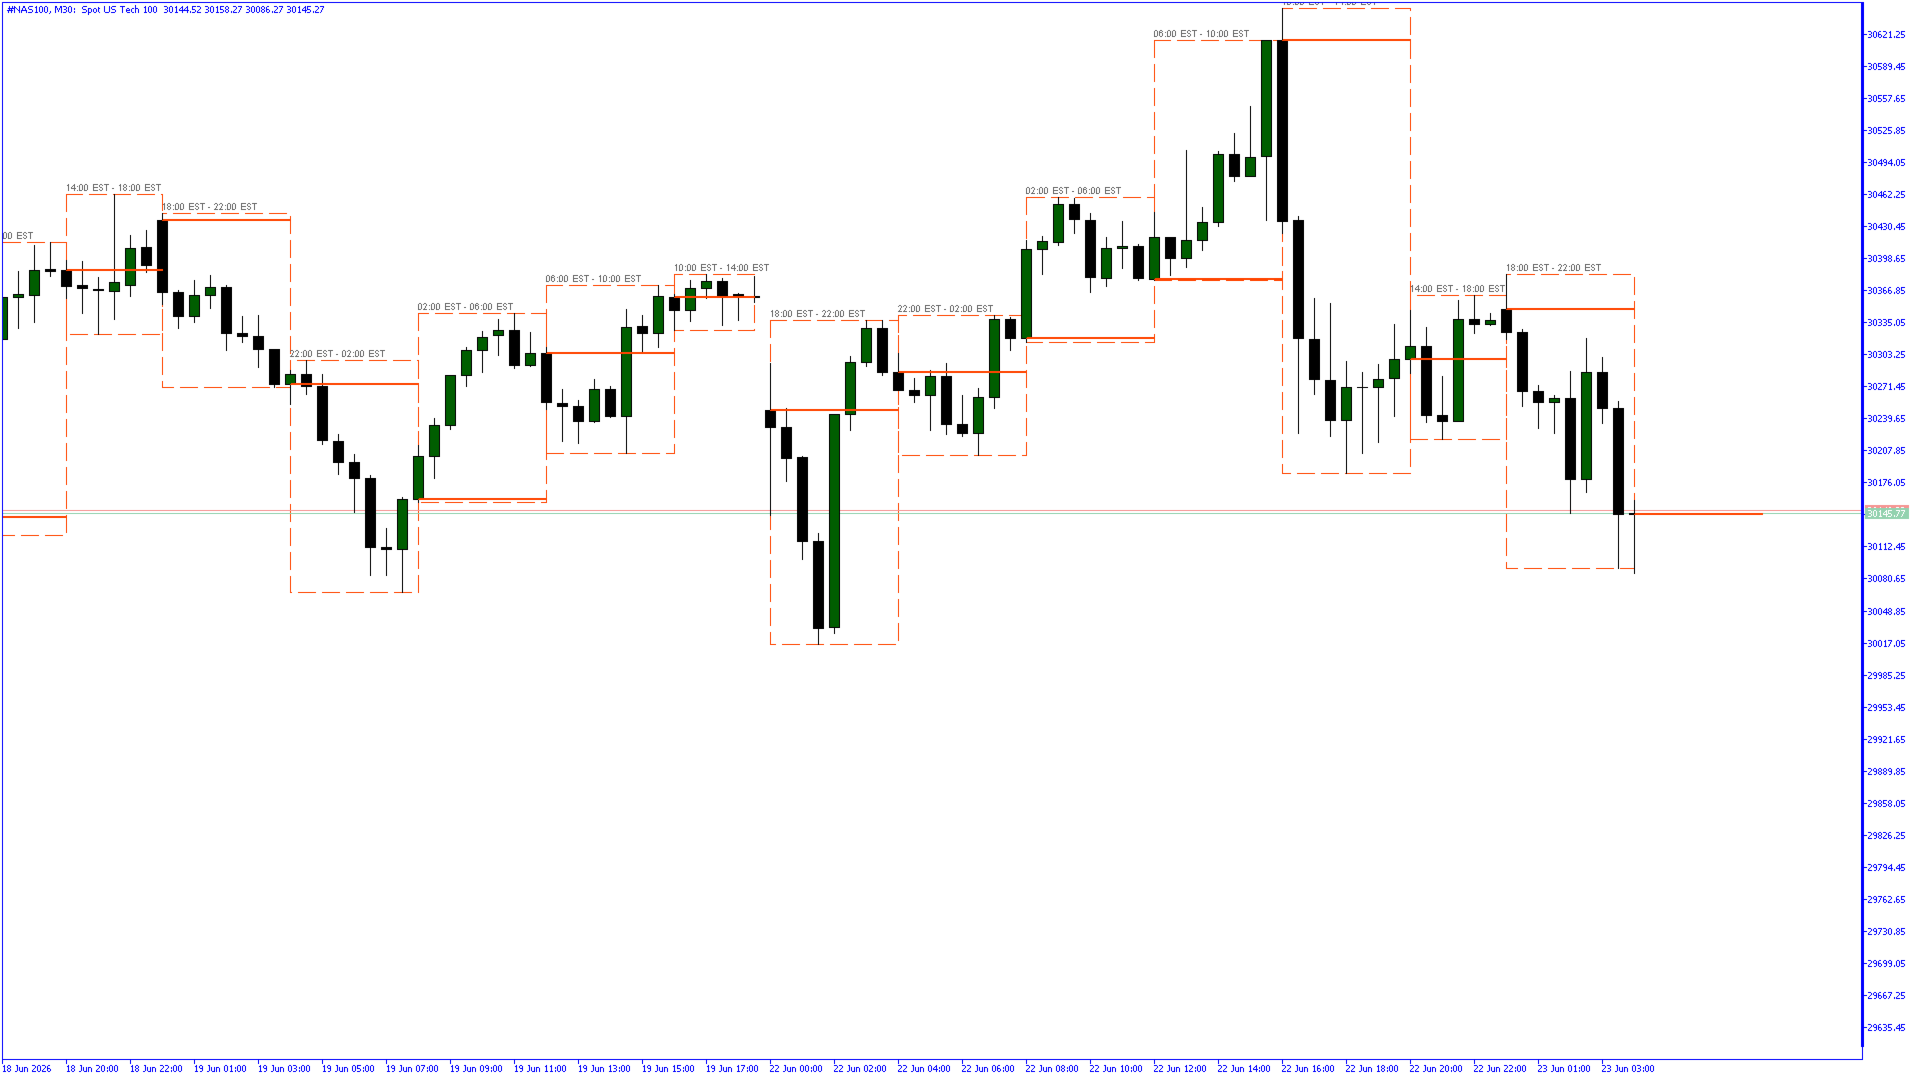
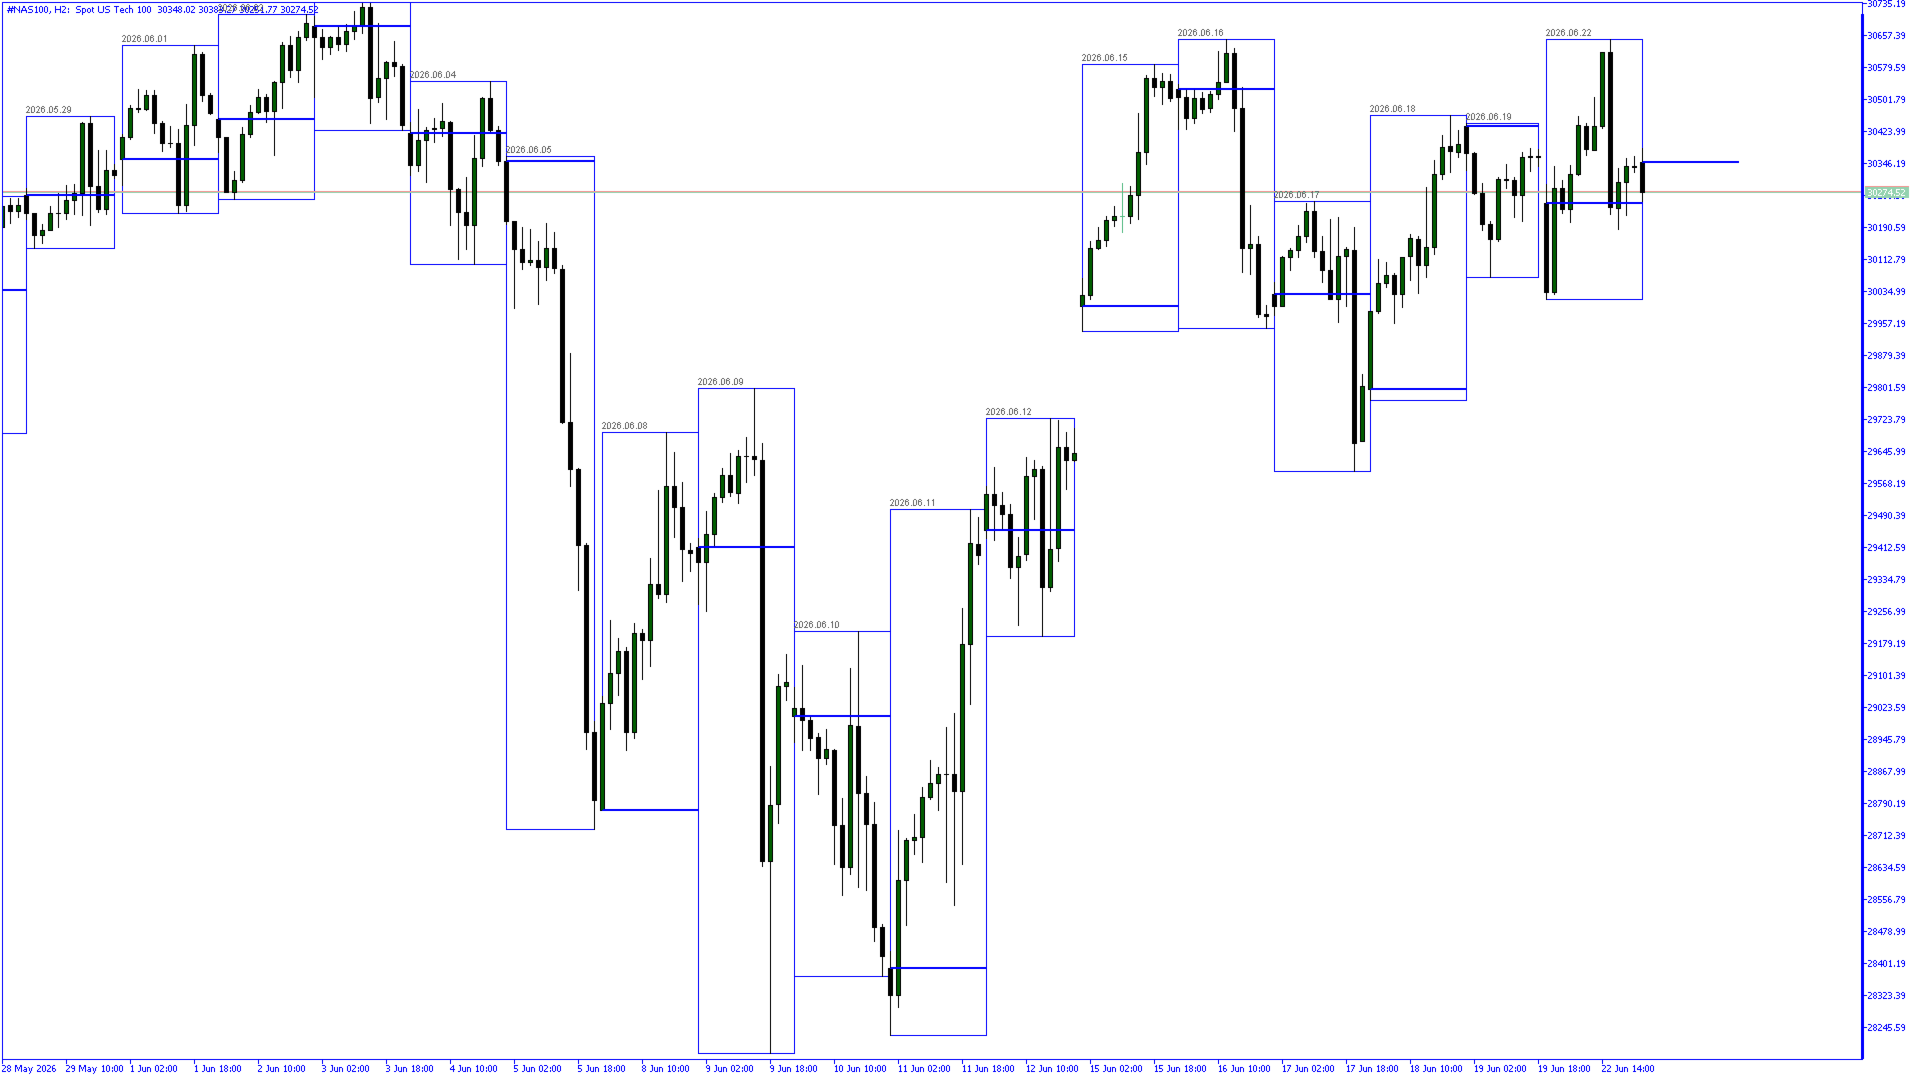
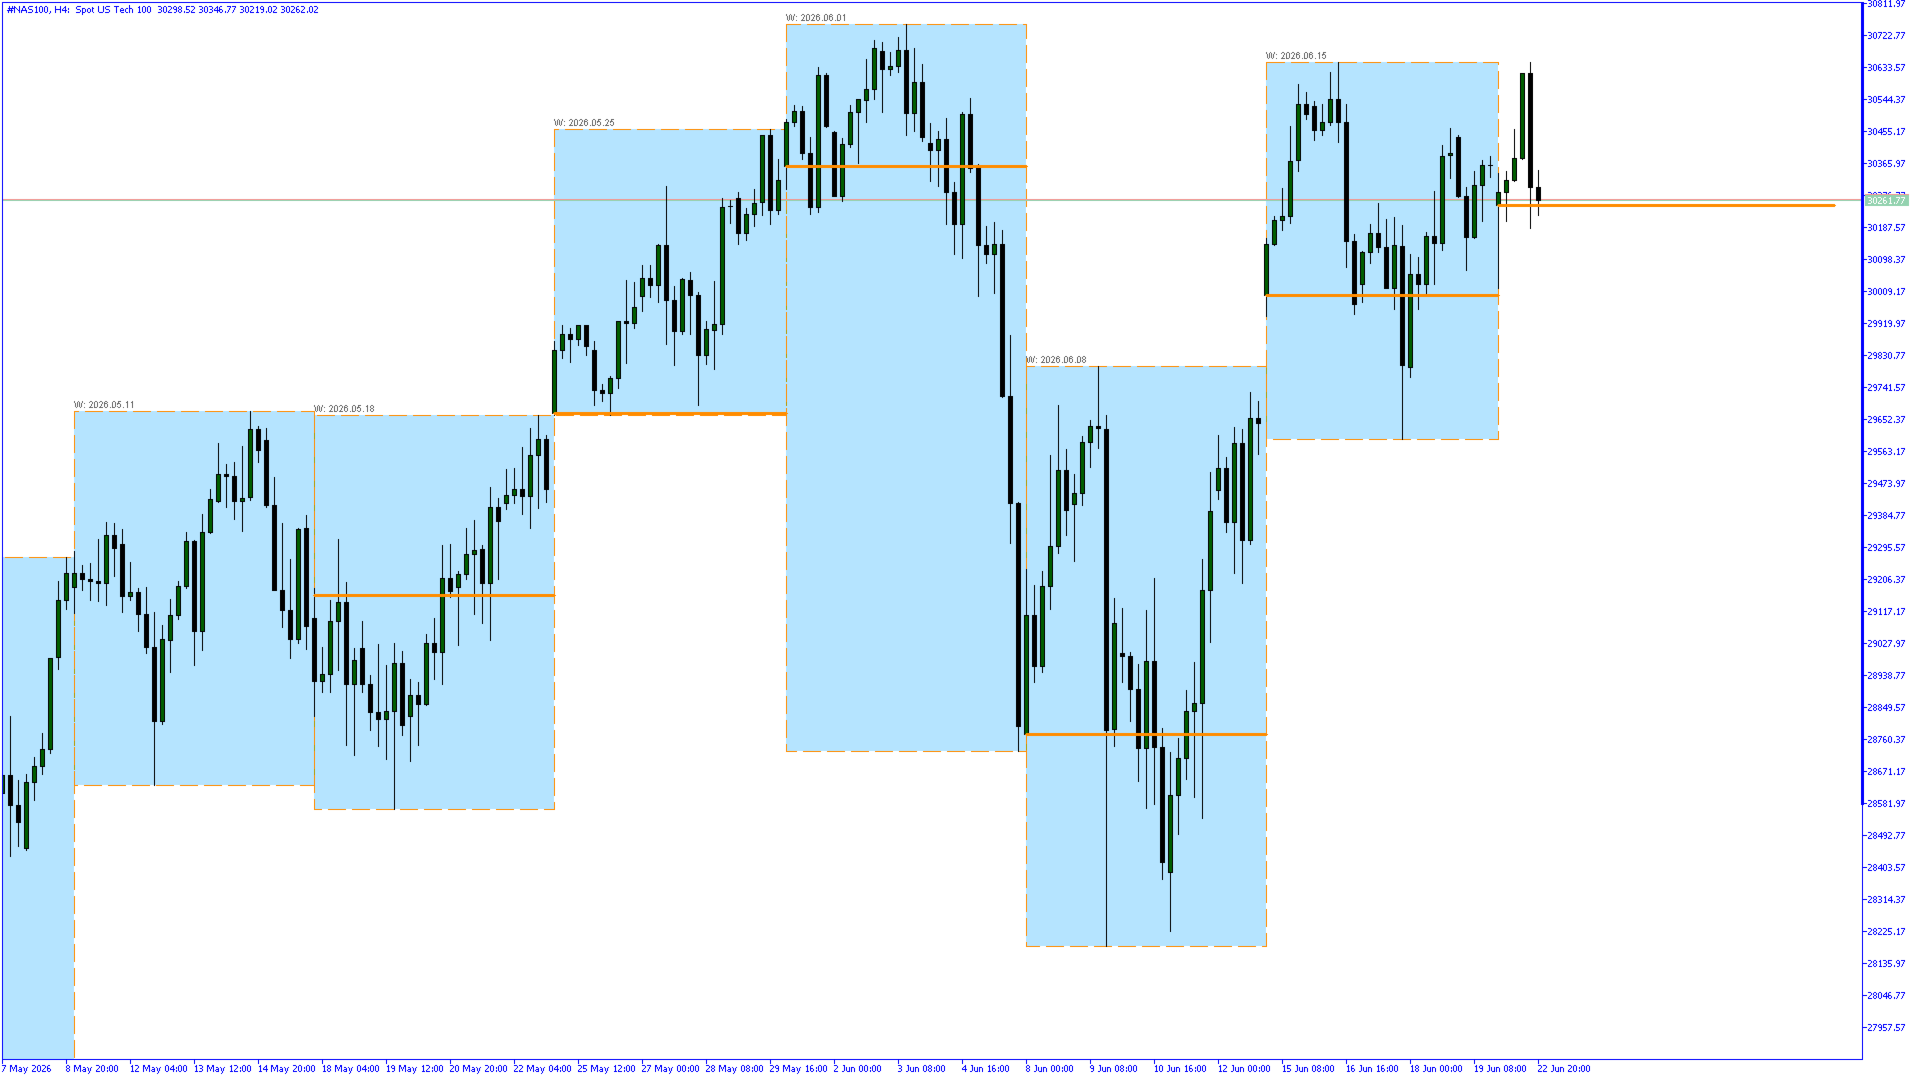
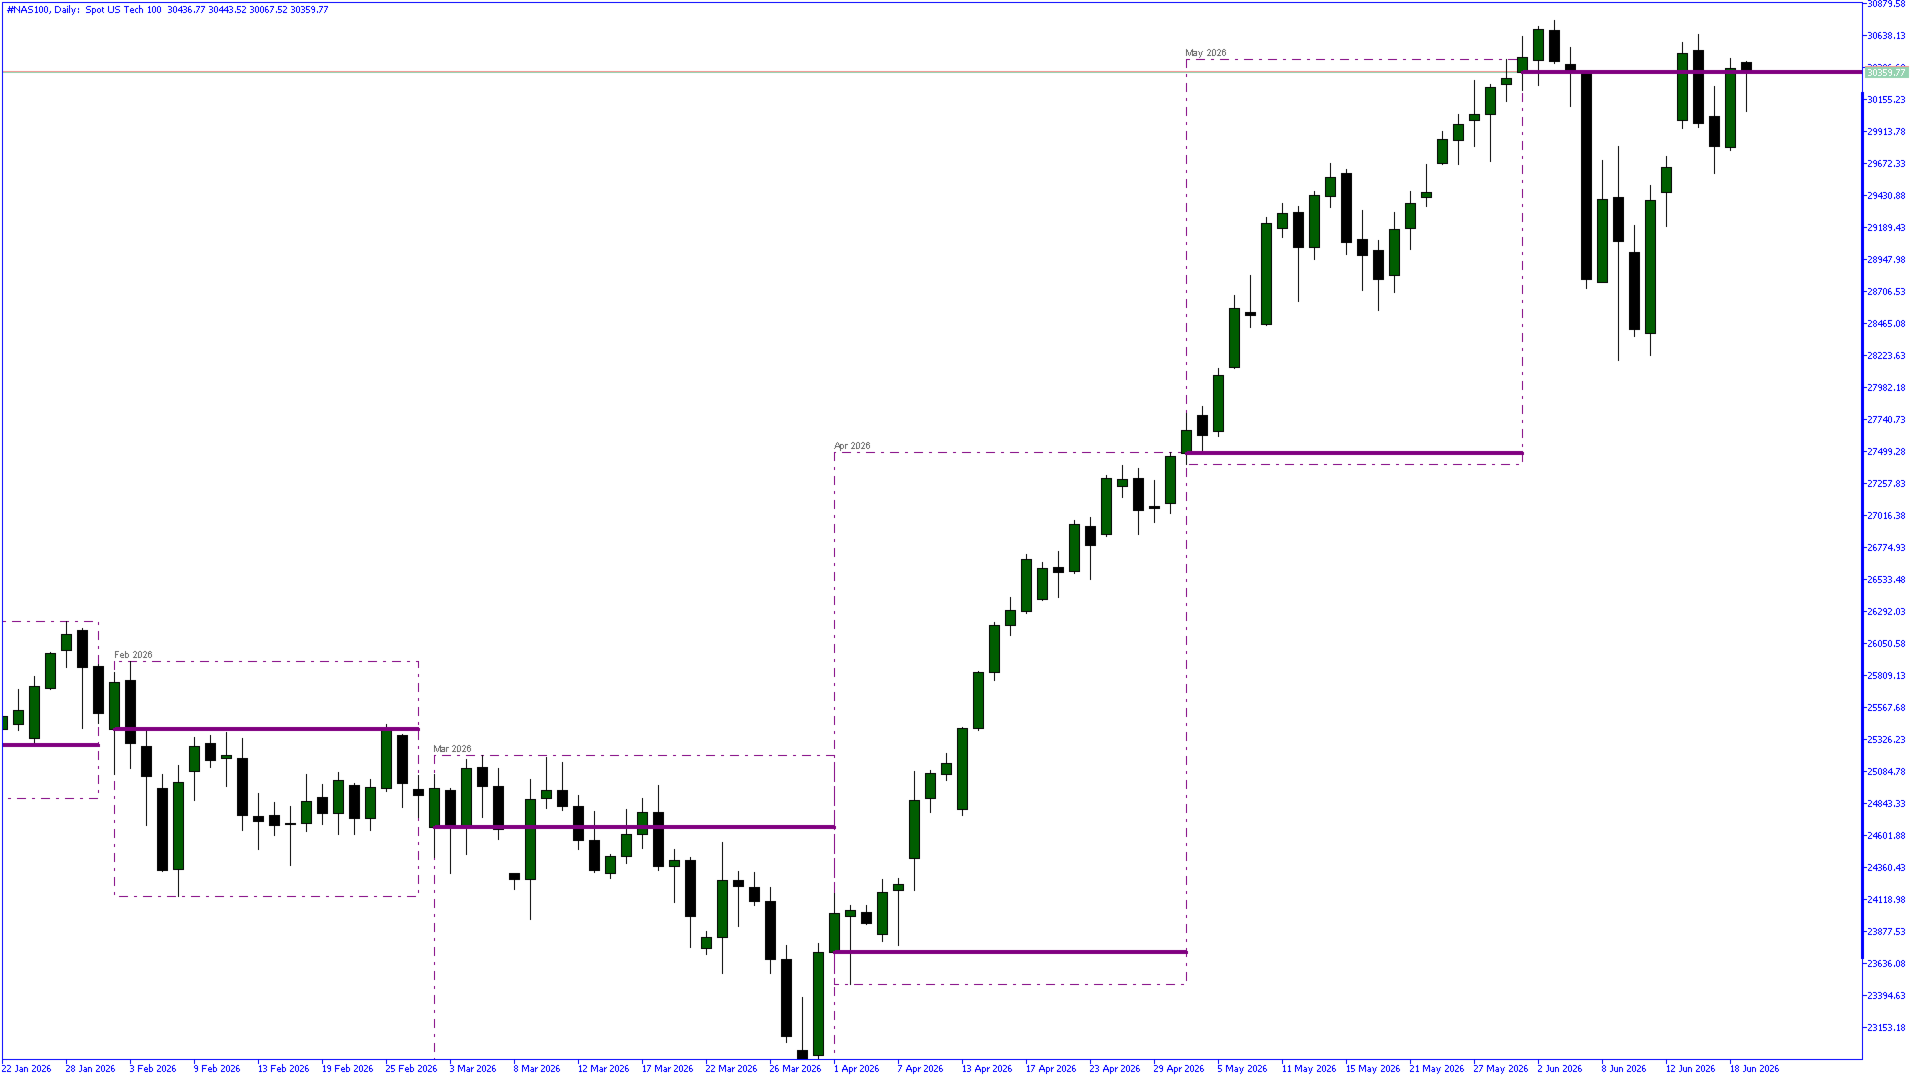
This indicator automates that process. It draws the high/low range box and the opening price line for each of seven timeframes — M15, M30, 1H, 4H, Daily, Weekly, and Monthly — directly on your chart. At a glance you can see the current period's open relative to its range, whether price is inside or outside prior period boxes, and how multiple PO3 ranges stack and align across timeframes.

The opening price line is particularly important: it marks the true open of the period, the reference point from which accumulation begins. When price returns to this level, it is often a key area of interest for entries in line with the higher timeframe narrative.

Every element — boxes, open lines, labels — is independently configurable per timeframe, so you can build a clean chart that shows exactly what you need for your trading style without clutter.

ICT Multi-Period Range Boxes (PO3) draws clean, precise high/low range boxes and opening price lines across seven timeframes simultaneously: M15, M30, 1H, 4H, Daily, Weekly, and Monthly. Each box represents the accumulation, manipulation, and distribution range of its period, giving you a layered view of PO3 structure from intraday scalping all the way up to the monthly narrative.

Every period displays two key elements:
  • A high/low range box showing where price has traded within that period
  • An opening price line anchored to the true open of the period

The current in-progress period always shows the open line only. Once the period closes, the completed box is drawn automatically.


━━━━━━━━━━━━━━━━━━━━━━━━━━━━━━━━━━━━━━━━
TIMEFRAMES
━━━━━━━━━━━━━━━━━━━━━━━━━━━━━━━━━━━━━━━━

  M15  —  15-minute range boxes and open lines
  M30  —  30-minute range boxes and open lines
  1H   —  Hourly range boxes and open lines
  4H   —  4-hour range boxes and open lines (EST-anchored)
  D    —  Daily range boxes and open lines
  W    —  Weekly range boxes and open lines
  MN   —  Monthly range boxes and open lines

Each timeframe can be enabled or disabled independently, so you can display exactly the levels you trade with and nothing more.


━━━━━━━━━━━━━━━━━━━━━━━━━━━━━━━━━━━━━━━━
4H SESSION ANCHOR
━━━━━━━━━━━━━━━━━━━━━━━━━━━━━━━━━━━━━━━━

The 4H periods are anchored from EST rather than the chart's midnight, keeping them aligned with ICT's actual session quarters. Three instrument types are supported:

  FX        —  anchor 17:00 EST  →  midnight broker UTC+2
  CFD       —  anchor 18:00 EST  →  01:00 broker UTC+2
  Synthetic —  anchor 19:00 EST  →  02:00 broker UTC+2  (Deriv)

Broker UTC offset and Daylight Saving Time (EST/EDT) are both configurable inputs so the anchor stays correct year-round and across brokers.


━━━━━━━━━━━━━━━━━━━━━━━━━━━━━━━━━━━━━━━━
CUSTOMIZATION
━━━━━━━━━━━━━━━━━━━━━━━━━━━━━━━━━━━━━━━━

Every timeframe has its own fully independent set of inputs:

  Box    —  border colour, width (1–5), line style, optional fill with adjustable opacity (0–255)
  Open   —  colour, width, line style (solid / dash / dot / etc.)
  Label  —  toggle on/off per timeframe

Global settings cover label colour, label font size, broker UTC offset, DST toggle, instrument type, and the number of historical bars to draw (1–2000).

All inputs include descriptive tooltips visible directly in the indicator settings dialog.


━━━━━━━━━━━━━━━━━━━━━━━━━━━━━━━━━━━━━━━━
ACCURACY
━━━━━━━━━━━━━━━━━━━━━━━━━━━━━━━━━━━━━━━━

  • Monthly box boundaries are anchored to the actual first trading bar of each month — not a fixed calendar midnight — so boxes never float into weekends or market holidays.

  • Monthly and Weekly open lines use the broker's native MN1/W1 bar data directly via iBarShift, so the open price is always accurate regardless of how far back the period is. There is no dependency on M1 data for higher timeframe opens.

  • M15 through Daily open lines use M1 data with a fast binary search to locate the true opening candle of each period.


━━━━━━━━━━━━━━━━━━━━━━━━━━━━━━━━━━━━━━━━
COMPATIBILITY
━━━━━━━━━━━━━━━━━━━━━━━━━━━━━━━━━━━━━━━━

  • Works on any symbol and any chart timeframe
  • FX, CFD, and Deriv Synthetic Indices supported
  • Distributed as compiled .ex5 — no source code included
  • Input validation on launch with clear alert messages for out-of-range parameters
Prodotti consigliati
The "Market Direction Analyzer" is a technical indicator designed to provide traders with a comprehensive analysis of market trends, momentum, and potential reversals. By integrating multiple analytical tools, it offers a multi-dimensional perspective on market conditions, aiding in more informed trading decisions. Using the Market Direction Analyzer in Trading: Trend Confirmation: By analyzing the aggregated sentiment score derived from its components, traders can confirm the prevailing market
FREE
Fair Value Gap Scanner LITE identifies institutional imbalances directly on your chart — no manual scanning, no guesswork. A Fair Value Gap forms when price moves so aggressively that a candle's range is skipped entirely, leaving an unfilled imbalance in the market. Smart money consistently returns to these zones, making them high-probability areas for entries, targets, and stop placement. What the indicator does: Scans H4 and D1 timeframes automatically Draws bullish and bearish FVG zones direc
FREE
Currency Strength Heatmap with Meter Overview Currency Strength Heatmap is a professional multi-currency strength indicator designed for MetaTrader 5. It analyzes the relative strength of the eight major currencies (EUR, USD, GBP, JPY, AUD, CAD, CHF, and NZD) in real time and presents the information through an advanced Heatmap Matrix and Currency Strength Meter. Instead of relying on a single currency pair, the indicator evaluates all 28 major currency combinations to identify the strongest and
FREE
Sniper Liquidity Indicator Sniper Liquidity System Sniper Liquidity System maps where liquidity rests, tracks when price takes it, and confirms the shift in market structure that often follows. Once a setup forms, it draws a complete trade plan on your chart: entry, stop loss, take profit and Risk:Reward. No DLLs. No external software. No repainting after a bar closes. Just attach it to a chart. Features Complete signals with a fixed Risk:Reward tool Entry at the fair value gap's full fill or th
FREE
Simple Anchored VWAP MT5
Suvashish Halder
4.75 (4)
Simple Anchored VWAP   is a lightweight yet powerful tool designed for traders who want precise volume-weighted levels without complexity. This indicator lets you anchor VWAP from any point on the chart and instantly see how price reacts around institutional volume zones. MT4 Version - https://www.mql5.com/en/market/product/155320 Join To Learn Market Depth -   https://www.mql5.com/en/channels/suvashishfx Using VWAP bands and dynamic levels, the tool helps you understand where real buying and s
FREE
Value Chart Candlesticks
Flavio Javier Jarabeck
4.57 (14)
The idea of a Value Chart indicator was presented in the very good book I read back in 2020 , " Dynamic Trading Indicators: Winning with Value Charts and Price Action Profile ", from the authors Mark Helweg and David Stendahl. The idea is simple and the result is pure genius: Present candlestick Price analysis in a detrended way! HOW TO READ THIS INDICATOR Look for Overbought and Oversold levels. Of course, you will need to test the settings a lot to find the "correct" one for your approach. It
FREE
MSM Daily Bias Liquidity Target is an indicator for MetaTrader 5 that shows the direction the day leans to and the nearest liquidity level price may move toward. It reads the previous day and week, the daily structure and the daily range, then shows BULLISH, BEARISH or UNCLEAR in a small panel and draws the liquidity target on the chart. It does not open trades. You decide if and when to trade. Daily bias score Previous day candle (weight 2): a close above the prior day high counts bullish. Taki
FREE
LRC Pro
Fazliddin Yuldoshev
LRC Pro with Alerts Overview LRC Pro replaces standard candlesticks with Linear Regression smoothed candles , eliminating market noise and making trend direction instantly clear. A signal line (SMA or EMA) is overlaid directly on the smoothed candles, giving you clean, actionable entries and exits without cluttering your chart. Unlike standard candles that react to every tick, LRC Pro show you where price is actually trending — making it far easier to stay on the right side of the market. How It
FREE
(Special New Year promotion - free price!) The indicator displays the actual 'Scale in points per bar' (identical to the manual setting in the Terminal, see screenshot) in the upper right corner of the chart. The displayed value changes INSTANTLY whenever the chart scale is changed! (This is very convenient when planning screenshots). In Settings: Change language (Russian/English), font size of the displayed text, text label offset coefficient from the graph corner, equally in X and Y directi
FREE
Market Session Visual
Kambiz Shahriarynasab
5 (8)
The  Market Sessions Indicator for MT5 helps you  predict market turnarounds  by detecting major supply and demand areas. These pivot points tend to occur after a new session has started and the previous one is still open. It is also used to gauge how many points or pips the market moves on average during a session. This helps us to place better our take profits and stop losses. The indicator works on all forex pairs, gold, silver, commodities, stocks, indices and any other instrument that you
FREE
Deviation Trend Profile Overview Deviation Trend Profile is a MetaTrader 5 chart indicator that combines three visual layers in a single chart window: a moving average with momentum-based coloring, deviation bands calculated from volatility, and a horizontal distribution profile drawn to the right of the current price. The indicator is an analytical tool. It does not open, modify or close trades, and it is not a complete trading system. It is designed to help the user observe trend direction, mo
FREE
Girassol Sunflower MT5 Indicator
Saullo De Oliveira Pacheco
3.86 (7)
This is the famous Sunflower indicator for Metatrader5. This indicator marks possible tops and bottoms on price charts. The indicator identifies tops and bottoms in the asset's price history, keep in mind that the current sunflower of the last candle repaints, as it is not possible to identify a top until the market reverses and it is also not possible to identify a bottom without the market stop falling and start rising. If you are looking for a professional programmer for Metatrader5, please
FREE
IMD Fibo MT5
Aleksei Chedaev
5 (1)
IMDFIbo è un indicatore per il terminale MetaTrader 5 che costruisce automaticamente una griglia di livelli di Fibonacci basandosi su dati storici. Lo strumento è progettato per visualizzare potenziali zone di supporto e resistenza sul grafico dei prezzi. Principio di funzionamento L'indicatore analizza i massimi e minimi storici del prezzo in un periodo specificato e costruisce i livelli di Fibonacci in base ad essi. La particolarità dello strumento risiede nella costruzione ricorsiva della gr
FREE
Elder Force Zones
Bugra Kaan Yildirim
MetaTrader's built-in Force Index is not the formula Dr. Alexander Elder published. It multiplies the volume of a bar by the change of a 13-bar moving average of price. Elder defined the force of a bar as its volume times the change of its close, and smoothed that with an exponential moving average. Measured on gold over the last year, the two disagree about which side of zero the market is on roughly one bar in six (M15, H1 and H4). Elder Force Zones computes Elder's own definition and builds h
FREE
Entry Signal Probability
Tevon R Gardiner
5 (1)
This indicator helps identify the   start  of significant market movements by analyzing candle patterns and their relative  price action strength  the indicator runs multiple simultaneous calculation every millisecond and it also does a triple set verification historically in order to calculate future probabilities the historical processing has to be completed before new Candlestick can be processed as one total set out of the total available history from the starting date and time in order to
FREE
1. Overview The Scalping PullBack Signal indicator is a powerful technical analysis tool designed to help traders identify scalping opportunities based on potential pullback and reversal signals. This tool is particularly useful on lower timeframes (below 15 minutes) but can also be applied on higher timeframes for longer-term trades. This indicator integrates several key analytical components, providing a comprehensive view of trends and potential entry/exit points, helping you make quick and e
FREE
RSI back arrows
Smaylle Rafael Coelho Mariano
The   RSI Back Arrows   indicator is a powerful tool designed for traders who rely on the Relative Strength Index (RSI) to identify potential market reversals. This indicator specifically highlights when the RSI has exited the   oversold   or   overbought   zones, providing clear visual signals to inform trading decisions. Key Features: Visual Cues : The indicator marks arrows on the chart when the RSI crosses back into a neutral zone, making it easy to spot potential entry and exit points. Over
FREE
Input Parameters JawPeriod   (default=9): Period for the blue line JawShift   (default=0): Shift for the blue line TeethPeriod   (default=7): Period for the red line TeethShift   (default=0): Shift for the red line LipsPeriod   (default=5): Period for the green line LipsShift   (default=0): Shift for the green line  Signals Bullish Conditions When price moves above all lines (all lines turn Lime) Potential buying opportunity Confirms upward momentum Bearish Conditions When price moves below all
FREE
Market Session Pro
Kambiz Shahriarynasab
The  Market Sessions Indicator for MT5 helps you  predict market turnarounds  by detecting major supply and demand areas. These pivot points tend to occur after a new session has started and the previous one is still open. It is also used to gauge how many points or pips the market moves on average during a session. This helps us to place better our take profits and stop losses. The indicator works on all forex pairs, gold, silver, commodities, stocks, indices and any other instrument that your
FREE
PROMETHEUS TECHNICAN VERSION Free | By THE SONS A gift from The Sons — no strings, no trial, no expiry. Every trader deserves access to professional-grade market intelligence. That belief is why Prometheus Technical Version exists, and why it costs nothing. Consider it our handshake to the trading community. What You're Getting This is not a simplified tool dressed up as a gift. Prometheus Technican Version is a fully built, institutional-quality technical analysis indicator running a dual-model
FREE
Super Trend eu
Emin Ulucanli
4.83 (6)
SUPERTREND; È un indicatore di trend following basato sull'ATR SuperTrend creato da Olivier Seban. Può essere utilizzato per rilevare i cambiamenti nella direzione del trend e individuare gli arresti. Quando il prezzo scende al di sotto della curva dell'indicatore, diventa rosso e indica una tendenza al ribasso. Al contrario, quando il prezzo si sposta al di sopra della curva, l'indicatore diventa verde, indicando un trend rialzista. Come altri indicatori, funziona bene su SuperTrend se utilizza
FREE
Squeeze Momentum Force is an advanced technical analysis indicator designed for MetaTrader 5. It combines volatility squeeze detection with momentum analysis to identify high-probability trading opportunities. Based on John Carter's original concept, this enhanced version incorporates: Multi-Timeframe (MTF) analysis. Divergence detection. Volume weighting. Modern user interface for quick market interpretation. The indicator identifies periods of low volatility (squeeze) that typically precede si
Daily High Low Danilo Monteiro
Danilo Hudson Couto Monteiro
4 (2)
# Indicador Daily High - Danilo Monteiro - MT5 ## Descrição O Daily High/Low Labels é um indicador personalizado para MetaTrader 5 que exibe automaticamente as máximas e mínimas diárias no gráfico, facilitando a identificação rápida dos níveis importantes de preço. O indicador marca os preços com etiquetas e linhas horizontais, permitindo uma visualização clara dos níveis críticos do dia atual e anterior. ## Principais Características ### 1. Marcação Automática - Exibe automaticamente as máxi
FREE
Dual Scale Candles
Mohamed Amr Mohamed Osama Abdelwahab
Dual Scale Candles sovrappone le candele reali di un secondo simbolo direttamente sul tuo grafico, con una scala di prezzo indipendente sull'asse sinistro. Confronta l'oro con una valuta, il petrolio con un indice o due strumenti qualsiasi sullo stesso grafico - ciascuno mantiene i propri prezzi reali. Le due serie sono allineate nel punto che scegli: la prima barra del giorno corrente mostrata sul grafico, la prima barra della settimana corrente o la barra più vecchia disegnata - sulla barra d
FREE
QuantumAlert RSI Navigator is a free indicator available for MT4/MT5 platforms, its work is to provide "alerts" when the market is inside "overbought and oversold" regions in the form of "buy or sell" signals. This indicator comes with many customization options mentioned in the parameter section below, user can customise these parameters as needful. Join our MQL5 group , where we share important news and updates. You are also welcome to join our private channel as well, contact me for the priva

FREE
Smart Structure Buy Sell Signals is a visual market structure indicator developed primarily for Gold (XAUUSD) intraday trading on MetaTrader 5. The indicator combines market structure, momentum, liquidity behaviour and supply-demand zones to identify potential Buy and Sell opportunities. It provides clear trading levels while keeping the final trading decision completely under the user’s control. This is a manual trading indicator. It does not open, modify or close real trades. Main Features • C
FREE
Indicator Description Range Filter Pro is a sophisticated trading tool for XAUUSD (Gold) that combines adaptive price filtering with volume analysis and real-time market monitoring. Designed for both novice and professional traders, this indicator helps identify trend direction, potential reversals, and significant market movements through its multi-layered approach. Key Components 1.Dynamic Range Filter 2.Volatility-Adjusted Bands 3.Volume-Enhanced Candles 4.Professional Trading Dashboard 5.M
FREE
Plus FlowProfile
Leonel Alberto Jose Quintana
Plus FlowProfile — Zone direzionali BUY e SELL per MT5 Plus FlowProfile amplia la lettura tradizionale del profilo separando l'analisi in fasi direzionali di acquisto e vendita. Nell'utilizzo individuale, il pulsante compatto FLOW BUY / FLOW SELL consente di passare rapidamente dal profilo inferiore di acquisto al profilo superiore di vendita. Quando viene integrato con Indicator Center o EA Assistant, lo stato viene controllato direttamente dai comandi del sistema. Caratteristiche principali: m
FREE
OmniSignal Navigator - Smart Entries at Key Levels Trade Like a Professional with this daily/weekly High-Low-Close indicator, designed for scalping or intraday short term trading and precision breakout trading. Suggested Timeframes to trade with: M 5 DO NOT USE THE INDICATOR ON THE M1 TIMEFRAME! Why It Works Perfect for Scalping/Intraday: Targets key zones (PDH/PDL/PDC & PWH/PWL/PWC) on M2, M3, M5, M15 timeframes. (Lower Timeframes = More Signals, Higher Timeframes = Less Signals) No Chart Anal
FREE
Gli utenti di questo prodotto hanno anche acquistato
Trend Sniper X
Sarvarbek Abduvoxobov
4.86 (44)
Trend Sniper X è un indicatore trend-following multi-timeframe per MetaTrader 5 che aiuta i trader a identificare la direzione del trend e i potenziali punti di inversione con chiarezza e precisione. per MT4: https://www.mql5.com/en/market/product/193245 Informazioni sul prezzo: Il prezzo attuale è promozionale ed è soggetto a modifiche con il rilascio di futuri aggiornamenti e nuove funzionalità. Offerta Bonus: Per ricevere GRATIS l'Auto-Trade Assistant EA per questo indicatore, invia un messa
Un nuovo Re in città - Indicatore + Gestione ordini (TP1 + TP2 + TP3) + Invio opzionale di segnali Telegram INCLUSO (GRATIS) (SISTEMA COMPLETO DI TRADING e SEGNALI) Il nostro miglior EA per l’Oro: Gold Slayer Questo indicatore include una strategia avanzata, un sistema di trading con gestione ordini personalizzabile e un sistema mean reversion che combina estensioni di envelope, supportato da molteplici filtri intelligenti di conferma come RSI per individuare ingressi di inversione ad alta proba
Smart Trend Trading System — MetaTrader 5 Dopo l'acquisto, inviami un messaggio su MQL5 per ricevere GRATUITAMENTE Smart Universal Expert Advisor, insieme al corso online, al manuale PDF e all'accesso al gruppo privato. STTS riunisce la direzione del trend, i segnali di entrata e uscita, le zone di inversione e i livelli di prezzo importanti direttamente sul grafico. Segui il sistema manualmente oppure collega un EA compatibile separato per eseguire le operazioni automaticamente con le impostazi
Entry Points Pro vi mostra dove entrare, dove mettere lo stop e con quale lotto operare — prima di piazzare l'ordine. PREZZO Ora 199 USD: 8 copie a questo prezzo, poi 249 USD. Il prezzo finale è di 349 USD. Guadagno facendo trading sui mercati e lo dimostro, quindi non ho bisogno di vendere questo indicatore a tutti. È uno strumento per trader che ragionano con la propria testa, non un pulsante magico. Nessuna rottura, nessun trade. Una freccia grigia è un segnale annullato: il prezzo non ha ro
M5 Sniper
MeanFX
5 (4)
Porta il tuo vantaggio nel trading sotto i riflettori! M5 Sniper è un nuovo indicatore di MeanFX. Combina segnali di trading precisi con livelli TP/SL adattivi , creando così le migliori operazioni statistiche possibili! Il prezzo aumenta ogni 5 acquisti, il prossimo prezzo è di 69$ Scrivimi dopo l'acquisto per ricevere consigli/guida e un EA bonus Cosa lo rende diverso? Performance statistica comprovata su Gold XAUUSD ( funziona su quasi ogni asset , concentrandosi sulla padronanza di un singol
Zoryk Gold
Reda El Koutbane
4.79 (19)
ZORYK — Sistema avanzato di segnali XAUUSD per MetaTrader 5 Conosci sicuramente questa sensazione. Passi molto tempo ad analizzare l’oro. Aspetti il punto d’ingresso corretto. Finalmente apri l’operazione e il prezzo inizia immediatamente a muoversi contro di te. Chiudi troppo presto, sposti lo Stop Loss o esiti per alcuni secondi. Successivamente il mercato raggiunge esattamente l’obiettivo che avevi previsto inizialmente, ma senza di te nella posizione. Il problema non era sempre la direzione.
Ultra Indicator
Ihor Otkydach
5 (1)
ULTRA è un indicatore tecnico che funziona secondo un approccio “tutto in uno”: analizza autonomamente il mercato, genera segnali di trading, visualizza i livelli per l’impostazione degli ordini stop-loss e suggerisce quando chiudere le operazioni per realizzare profitti o ridurre al minimo le perdite. In altre parole, non importa se non sai come analizzare il mercato, determinare i livelli — dove impostare lo stop-loss — o se hai difficoltà con la gestione del capitale. ULTRA farà tutto questo
Gann Made Easy è un sistema di trading Forex professionale e facile da usare che si basa sui migliori principi del trading utilizzando la teoria di mr. WD Gann. L'indicatore fornisce segnali ACQUISTA e VENDI accurati, inclusi i livelli di Stop Loss e Take Profit. Puoi fare trading anche in movimento utilizzando le notifiche PUSH. CONTATTAMI DOPO L'ACQUISTO PER RICEVERE GRATUITAMENTE LE ISTRUZIONI DI TRADING E OTTIMI INDICATORI EXTRA! Probabilmente hai già sentito parlare molte volte dei metodi d
SuperScalp Pro
Van Minh Nguyen
4.54 (37)
SuperScalp Pro - Professional Multi-Layer Confluence Scalping System SuperScalp Pro è un indicatore di scalping avanzato che potenzia il Supertrend classico con diversi filtri intelligenti di conferma. Aiuta a individuare opportunità di trading Buy/Sell con una maggiore probabilità di successo, riducendo significativamente i falsi segnali. Le frecce Buy e Sell vengono visualizzate chiaramente direttamente sul grafico, insieme ai livelli di Stop Loss e Take Profit basati sull’ATR, calcolati autom
SMC Intraday Formula
VividMind Digital Solutions
5 (26)
Cominciamo con la verità. Nessun indicatore da solo ti renderà profittevole. Se qualcuno ti dice il contrario, ti sta vendendo un sogno. Qualsiasi indicatore che mostra frecce perfette di acquisto/vendita può essere reso impeccabile — basta ingrandire la giusta sezione della storia e catturare solo i trade vincenti. Noi non lo facciamo.  SMC Intraday Formula è uno strumento. Legge la struttura del mercato per te, identifica le zone a più alta probabilità e ti mostra esattamente come appare la t
GoldenX Entry MT5
VividMind Digital Solutions
5 (17)
GoldenX Entry è un indicatore per MT5 con un algoritmo adattivo Smart Entry Trend, un sistema di scoring dei segnali, un rilevatore del regime di mercato e un filtro di volatilità. Ogni segnale include un livello di ingresso calcolato, tre livelli di Take-Profit (TP1, TP2, TP3) e un livello di Stop-Loss. È costruito su più livelli analitici progettati per adattarsi a diverse condizioni di mercato, combinando un sistema analitico multilivello con un ottimizzatore integrato e un sistema di traccia
Gold Trend Coach MT5
Cristhian Alexander Gaibor Cuasquer
4.27 (11)
Segnali di acquisto e vendita senza repaint sull'oro (XAUUSD) per MetaTrader 5. Ogni segnale arriva con stop loss e tre take profit. Un filtro Smart Money Concepts con BOS e CHoCH, così operi a favore della struttura, non contro. Un Mentor live sul pannello che ti guida passo dopo passo dall'ingresso fino al TP3. E alert direttamente sul tuo telefono e sul tuo canale Telegram. Questo è Gold Trend Coach. Mai più da solo davanti al grafico. KIT ACQUIRENTE GRATIS con il tuo acquisto: 1. Telegram A
Boba Analysis Suite
Trade Ready Solutions LLC
5 (2)
Boba Analysis Suite Boba Analysis Suite è un indicatore di analisi per MetaTrader 5. Riunisce la struttura del mercato, le zone di prezzo rilevanti e il contesto generale del mercato in un’unica visualizzazione del grafico. Sviluppato sulla base dell’esperienza pratica come trader e formatore di trading, supporta un processo di analisi strutturato: valutare la direzione del mercato, individuare livelli importanti e analizzare congiuntamente più intervalli temporali. Analisi nel contesto del merc
FX Power MT5 NG
Daniel Stein
5 (33)
FX Power: Analizza la Forza delle Valute per Decisioni di Trading Più Intelligenti Panoramica FX Power è lo strumento essenziale per comprendere la reale forza delle principali valute e dell'oro in qualsiasi condizione di mercato. Identificando le valute forti da comprare e quelle deboli da vendere, FX Power semplifica le decisioni di trading e rivela opportunità ad alta probabilità. Che tu segua le tendenze o anticipi inversioni utilizzando valori estremi di Delta, questo strumento si adatta
Azimuth Pro
Ottaviano De Cicco
5 (7)
Azimuth Pro V2: Synthetic Fractal Structure and Confirmed Entries for MT5 Overview Azimuth Pro is a multi-level swing structure indicator by Merkava Labs . Four nested swing layers, swing-anchored VWAP, ABC pattern detection, three-timeframe structural filtering, and closed-bar confirmed entries — one chart, one workflow from micro-swings to macro-cycles. This is not a blind signal product. It is a structure-first workflow for traders who care about location, context, and timing. 1. What Change
FiboSniper Pro
Van Minh Nguyen
5 (4)
FiboSniper Pro – Multi-Filter Fibonacci System with Auto SL/TP and Control Panel FiboSniper Pro è un indicatore tecnico che combina Fibonacci Envelopes dinamici con diversi filtri di conferma per generare segnali Buy e Sell selezionati. I livelli di Fibonacci vengono calcolati sulla base di Moving Average e ATR e successivamente filtrati tramite ADX, EMA, RSI, ATR, Volume, Time e struttura delle candele. L’indicatore visualizza direttamente sul grafico i livelli automatici di Stop Loss e Take Pr
Gold Entry Sniper
Tahir Mehmood
5 (23)
Gold Entry Sniper – Dashboard ATR Multi-Timeframe per Scalping e Swing Trading sull’Oro Gold Entry Sniper è un indicatore avanzato per MetaTrader 5 che offre segnali di acquisto/vendita precisi per XAUUSD e altri strumenti, basato sulla logica ATR Trailing Stop e l' analisi multi-timeframe . Caratteristiche e Vantaggi Analisi Multi-Timeframe – Visualizza trend su M1, M5, M15 in un'unica dashboard. Trailing Stop Basato su ATR – Stop dinamici che si adattano alla volatilità. Dashboard Professional
M1 Sniper MT5
Oleg Rodin
5 (7)
M1 SNIPER   è un sistema di indicatori di trading facile da usare. Si tratta di un indicatore a freccia progettato per l'intervallo temporale M1. L'indicatore può essere utilizzato come sistema autonomo per lo scalping sull'intervallo temporale M1 e come parte del tuo sistema di trading esistente. Sebbene questo sistema di trading sia stato progettato specificamente per il trading sull'intervallo temporale M1, può comunque essere utilizzato anche con altri intervalli temporali. Inizialmente ho p
Apex Patterns PRO Acquista l'indicatore - Ottieni GRATUITAMENTE l'Expert Advisor basato su di esso. Intelligenza auto-ottimizzante per pattern grafici e breakout Gli scanner di pattern tradizionali si basano su input fissi, registrando spesso prestazioni inferiori quando la volatilità e le strutture del mercato cambiano. Apex Patterns PRO è progettato per adattarsi alle mutevoli condizioni di mercato combinando il riconoscimento dei pattern grafici strutturali, il filtraggio del momentum e l'au
SQN Max indicator for MT5 by ITC
Renaud Herve Francois Candel
Sqn Max Indicator Sqn Max is an exclusive indicator to trade the market with high effectiveness. The indicator is based on price action, volatility and trend. This indicator is as simple as possible but not too simple. The indicator can generate alerts to ease the trading process. You don't have to stay all day in front of your screen. The indicator can be used with any class of assets and with any time frame. It is possible to achieve better results trading our list of selected assets. We achi
Adaptive Price Action Engine Acquista un indicatore, ricevi l'EA gratis Analisi Auto-Ottimizzata del Trend e dei Pattern Candlestick Multi-Timeframe I mercati cambiano continuamente e non tutti i pattern di Price Action hanno lo stesso valore in ogni condizione di mercato. Adaptive Price Action Engine è progettato per adattarsi alle condizioni di mercato in continua evoluzione, combinando struttura del trend, analisi Multi-Timeframe, pattern Candlestick e ottimizzazione statistica in un unico fr
Atomic Analyst MT5
Issam Kassas
4.51 (65)
Atomic Analyst — MetaTrader 5 Dopo l'acquisto, inviami un messaggio su MQL5 per ricevere GRATUITAMENTE Smart Universal Expert Advisor, insieme al corso online, al manuale PDF e all'accesso al gruppo privato. Atomic Analyst riunisce l’azione del prezzo, la direzione del trend, i segnali di entrata e uscita, lo Stop Loss e diversi livelli di Take Profit direttamente sul grafico. INDIVIDUA IL SEGNALE. COMPRENDI IL CONTESTO OPERATIVO. Atomic Analyst organizza la sua analisi in informazioni visive ch
Prossimo aggiornamento — Versione 2.52 in arrivo! [NOVITÀ] Preparati a 4 nuove funzionalità principali progettate per migliorare la tua analisi di mercato e il tuo flusso di lavoro nel trading Portiamo l’analisi di mercato a un livello superiore con 4 nuove funzionalità progettate per soddisfare le tue esigenze di trading. Ecco le novità: 1. TRADE OVERVIEW DASHBOARD 2. CONFLUENCE AT ZONE 3. STRONG & WEAK HIGH/LOW 4. OTE 1. TRADE OVERVIEW DASHBOARD Una dashboard che ti aiuta a comprendere più fa
Divergence Bomber
Ihor Otkydach
4.89 (94)
Ogni acquirente dell’indicatore riceverà inoltre gratuitamente: L’utilità esclusiva “Bomber Utility”, che gestisce automaticamente ogni operazione, imposta i livelli di Stop Loss e Take Profit e chiude le posizioni secondo le regole della strategia I file di configurazione (set file) per adattare l’indicatore a diversi asset I set file per configurare il Bomber Utility in tre modalità: “Rischio Minimo”, “Rischio Bilanciato” e “Strategia di Attesa” Una guida video passo-passo per installare, con
Tokyo mt5 Indicator
Vasiliy Strukov
5 (15)
Il Tokyo Indicator offre una chiara panoramica visiva della direzione del trend, dei potenziali segnali di trading e delle condizioni di mercato. La sua linea di trend a gradini, codificata a colori, distingue le fasi rialziste (in blu) da quelle ribassiste (in magenta). Frecce direzionali dedicate evidenziano potenziali opportunità di acquisto e vendita al variare del trend visualizzato. Una dashboard integrata riunisce in un'unica visualizzazione pratica il segnale corrente, il bias di mercato
Power Candles MT5
Daniel Stein
4.58 (12)
Power Candles V3 - Indicatore di forza ad ottimizzazione automatica Power Candles V3 trasforma la forza delle valute e degli strumenti in un piano di trading attuabile su ogni grafico a cui è collegato. Invece di limitarsi a colorare le candele, esegue un'auto-ottimizzazione in tempo reale in background e ti fornisce i migliori valori di Stop Loss, Take Profit e soglia di segnale per il simbolo che hai davanti. Basta un clic per adottarlo nel trading live: i raggi di ingresso, Stop Loss e Take P
Currency Strength Wizard   è un indicatore molto potente che ti fornisce una soluzione all-in-one per un trading di successo. L'indicatore calcola la potenza di questa o quella coppia forex utilizzando i dati di tutte le valute su più intervalli di tempo. Questi dati sono rappresentati in una forma di indice di valuta facile da usare e linee elettriche di valuta che puoi utilizzare per vedere il potere di questa o quella valuta. Tutto ciò di cui hai bisogno è collegare l'indicatore al grafico ch
Naked Forex Tweezer Pro Indicator Tweezer Pro Indicator is a pattern recognition indicator for Forex, Stocks, Indices, Futures, Commodities and Cryptos. The standard Tweezer is a two bar pattern. Our enhanced version is a multi-bar pattern. We filter the patterns for you so that you only get the     best and most effective patterns   and ignore the noise. The Tweezer pattern is a simple and effective pattern to trade. The strategy that comes with the Tweezer is based on price action. The Twe
Auto Optimized SpeedAngle è un sistema di vettorizzazione del momento di livello istituzionale che elimina l'overfitting ( curve-fitting ) attraverso l'ottimizzazione continua Walk-Forward (WFO). Invece di affidarsi a input statici che si degradano quando i regimi di mercato cambiano, l'indicatore recalibra dinamicamente i suoi parametri utilizzando la validazione Out-of-Sample (OOS), assicurando che i segnali visualizzati rappresentino reali vantaggi statistici anziché anomalie storiche. Quadro
Smc Pro ToolKit
Talal N Z Aljarusha
5 (14)
SMC PRO TOOLKIT — SMART MONEY ANALYSIS & STRUCTURED TRADE PLANNING SMC Pro ToolKit is a professional Smart Money Concepts analysis workspace for MetaTrader 5. It combines market structure, multi-timeframe analysis, institutional price zones, setup evaluation, confirmation tools, volume context, alerts, and risk planning inside one organized chart environment. One workspace. Multiple layers of confirmation. One structured trading plan. OPEN COMPLETE USER GUIDE MULTI-CONDITION SETUP ENGINE At
Altri dall’autore
Multi Timeframe CISD
Janardo St Jude Williamson
MTF CISD Tool — Multi-Timeframe CISD Indicator MTF CISD Tool marks Change in State of Delivery (CISD) levels across up to five independently configurable timeframes at once, so you can see where price is set up to reverse on several timeframes without switching charts. For each timeframe you enable, the indicator watches for a swing high or low that lines up with a higher confirmation timeframe, marks the origin candle of that level with a dotted line while it's still pending, and turns the l
ICT Liquidity Pools
Janardo St Jude Williamson
ICT Liquidity Pools automatically maps the resting-order pools that ICT-style traders use as draw-on-liquidity targets — buy-side liquidity (BSL) above old swing highs and sell-side liquidity (SSL) below old swing lows — and tracks each level in real time until price takes it out. What it does BSL / SSL detection — plots a line at every confirmed swing high (BSL) and swing low (SSL), using an adjustable pivot lookback so you control how sensitive the swing detection is. Equal Highs / Equal Lows
ICT Timings & Macros + Liquidity Map draws the full ICT session toolkit on your chart in one indicator, so you're not stacking five separate tools to see your timing framework. Everything is anchored to the 18:00 EST daily reset and fully configurable — colors, styles, widths, fonts, label positions, and history depth — down to the individual line. Session Dividers (12h / 6h / 3h) 18:00 EST-anchored vertical dividers at the 12-hour, 6-hour, and 3-hour level, each independently enabled. Every div
ICT Power of 3 HTF Candles
Janardo St Jude Williamson
ICT Power of 3 HTF Candles See the higher-timeframe candle forming while you trade the lower timeframe. The indicator projects HTF candles to the right of your chart, built live from your current symbol’s data. You can read the Power of 3 structure without switching timeframes. Background: the Power of 3 The Power of 3 (PO3, also written AMD) is an ICT concept. It describes a candle, a session or a whole day as three phases that repeat on every timeframe. Accumulation: price moves sideways near
Filtro:
Nessuna recensione
Rispondi alla recensione