Environment Pro MT5
- Indicatori
- Versione: 1.1
- Attivazioni: 5
Environment Pro MT5
What is Environment Pro?
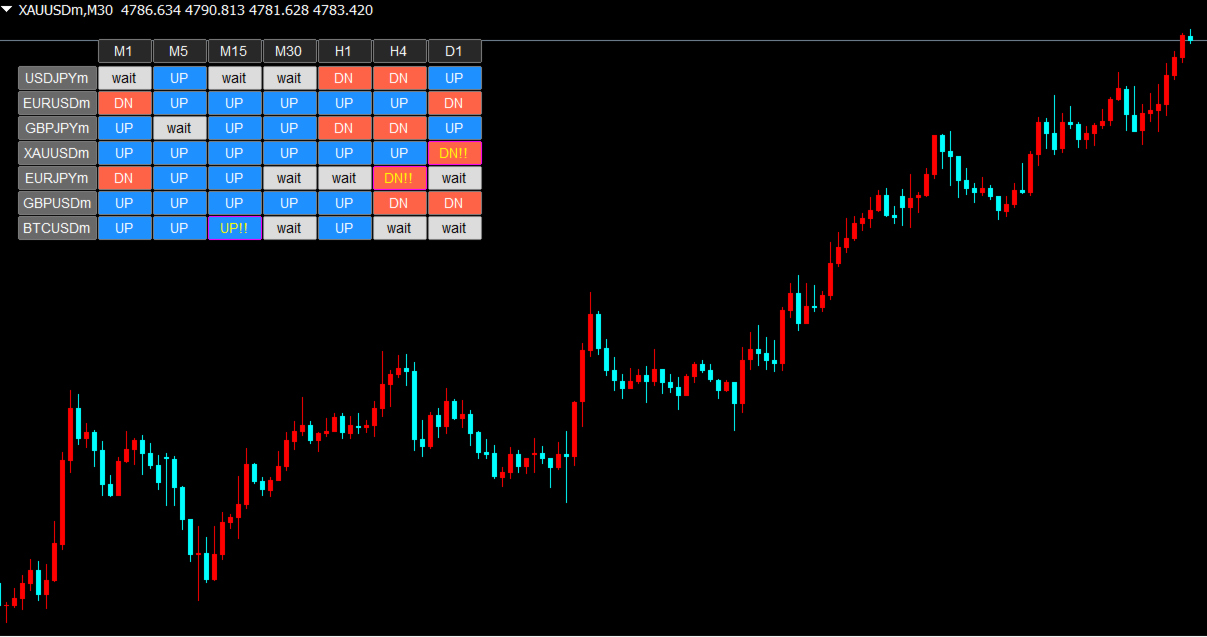
Environment Pro is a real-time market scanning dashboard that monitors multiple symbols and timeframes in a single panel. It helps you quickly identify which pairs show clear directional bias, which are stuck in range, and where unusual volatility is appearing. Built as a practical environment-assessment tool for MT5, it can be used with Forex pairs, Gold, indices, and crypto symbols supported by your broker.
The Problem It Solves
- You enter a trade expecting a trend, only to see it reverse immediately because the market was actually ranging.
- You waste time flipping through multiple charts, trying to decide which symbol is worth watching.
- By the time you notice a sudden move, the best part of the move is already gone.
The common issue is simple: it is difficult to quickly separate symbols worth watching from symbols better avoided. Environment Pro solves this by organizing your monitored symbols and timeframes into one clear panel.
How the Panel Works
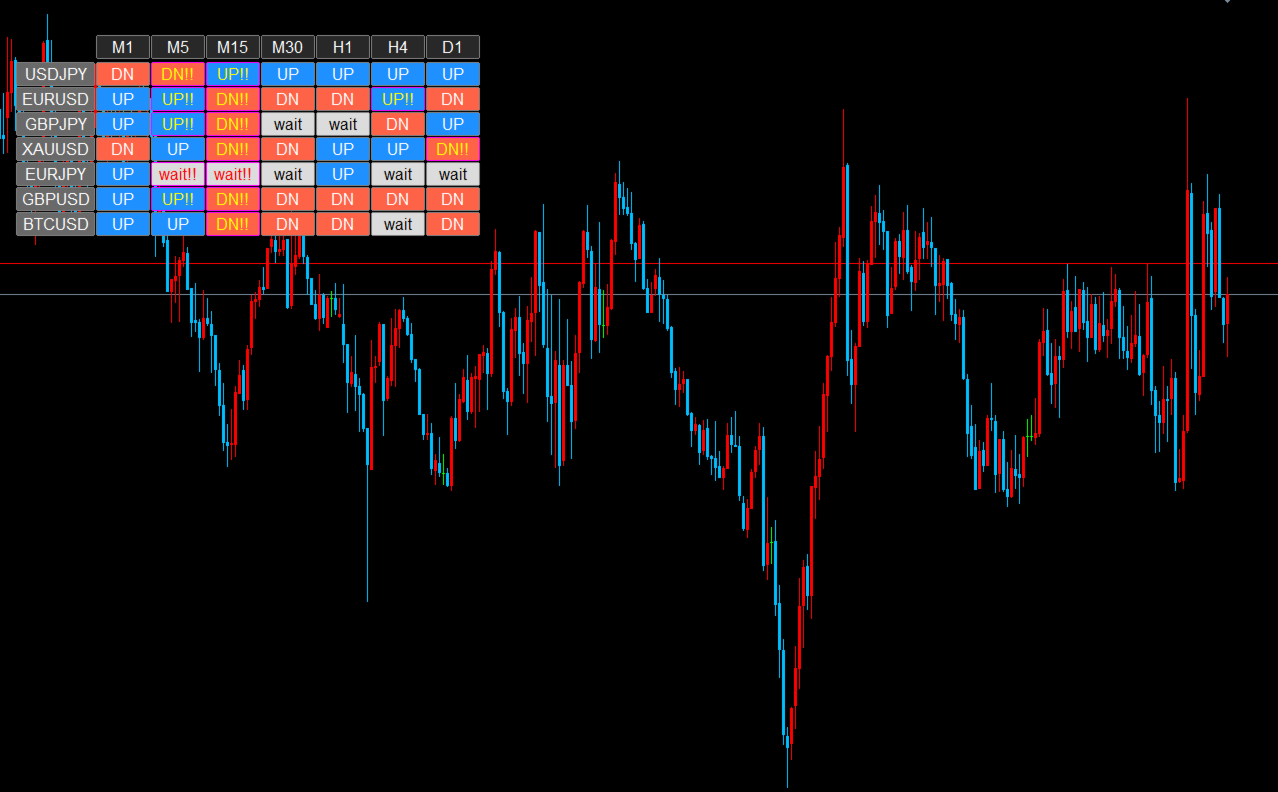
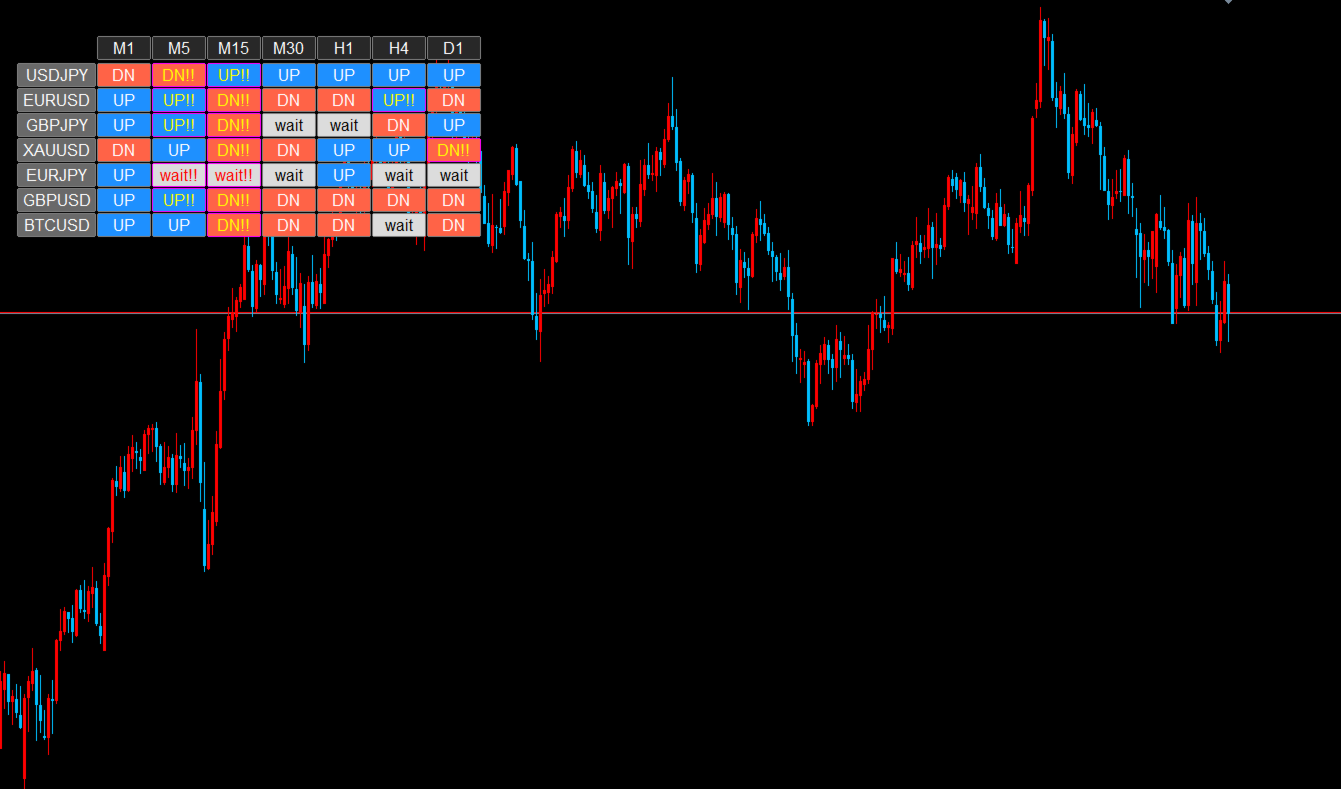
Each cell in the panel represents one symbol on one timeframe. Cells update in real time and display one of four states:
UP (Blue) - Upward directional bias is dominant. A potential buy-side candidate.
DN (Red) - Downward directional bias is dominant. A potential sell-side candidate.
wait (Gray) - No clear direction detected. Range conditions. Usually better to stay out.
UP!! / DN!! (Highlighted border + text color change) - Trend direction is present and abnormal volatility has been detected. This may indicate a breakout or unusual market activity, so it deserves priority attention.
Each cell also works as a button. Click any cell to switch your chart to that symbol and timeframe instantly, without searching through symbol lists manually.
Recommended Usage
This tool is not an entry-signal generator. It is an environment-assessment dashboard designed to be used before applying your own trading strategy.
Step 1: Open your chart during your trading session (for example, London open or New York open) and check the panel overview. If most cells show "wait," the market lacks direction and there is no need to force trades.
Step 2: Look for symbols where multiple timeframes align in the same direction (UP or DN). These are your higher-priority candidates.
Step 3: If any cell shows "!!", something unusual is happening. Click that cell to jump to the chart and review it first.
Step 4: Apply your own entry rules (support/resistance, price action, structure, etc.) on the selected pair. The panel handles the scanning process so you can focus on execution.
Three Key Benefits
1. "wait" helps filter out low-quality conditions
The panel automatically filters out symbols with weak or unclear trend conditions. By focusing only on colored cells, you can reduce unnecessary entries during ranging markets.
2. "!!" helps you notice expanding volatility quickly
The panel compares current volatility against its recent average. When volatility expands sharply, the cell is highlighted so you can spot the move faster and review it before it becomes old news.
3. One-click chart switching
Every cell is clickable. With one click, your chart switches to that symbol and timeframe. This reduces time spent searching through symbol lists and changing timeframes manually.
Logic Overview
The panel combines three widely used technical components into a single environment assessment:
1. Direction (EMA 20/50) - Evaluates whether short-term direction favors buyers or sellers based on the position of the fast and slow EMA.
2. Trend Strength (ADX) - Measures how strong the current directional move is. If ADX is below the threshold (default: 20), the cell displays "wait" regardless of EMA direction.
3. Volatility Detection (ATR) - Compares the current ATR value with the 20-bar ATR average. When the ratio exceeds the threshold (default: 1.2x), the cell is marked with "!!" to highlight abnormal movement.
Who This Is For
Recommended for:
- Traders monitoring multiple symbols who want a faster way to identify where to focus
- Traders who tend to enter during range conditions and want an additional filter
- Traders who want to notice sudden moves caused by news, breakouts, or volatility expansion
- Traders who already have their own entry strategy and want to streamline market scanning
Not recommended for:
- Traders looking for a fully automated entry/exit system
- Traders using pure range-reversal strategies only (this tool has a trend-following bias)
- Traders expecting direct arrow-based entry signals
Parameters
Monitoring Settings
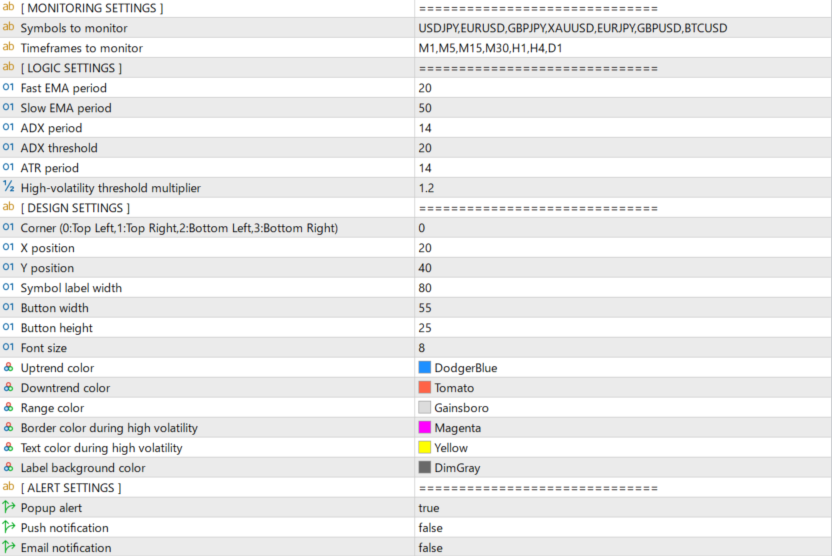
Symbols to monitor (default: USDJPY,EURUSD,GBPJPY,XAUUSD,EURJPY,GBPUSD,BTCUSD) - Comma-separated list of symbols. Add, remove, or reorder as needed. The indicator attempts to detect broker-specific symbol naming automatically.
Timeframes to monitor (default: M1,M5,M15,M30,H1,H4,D1) - Comma-separated list of timeframes. Remove unnecessary timeframes if you want a more compact panel.
Logic Settings
Fast EMA period (default: 20) - Short-term EMA used for directional assessment.
Slow EMA period (default: 50) - Long-term EMA used for directional assessment.
ADX period (default: 14) - Period used for ADX calculation.
ADX threshold (default: 20) - Below this level, the cell shows "wait." Increase it for stricter filtering, decrease it for looser filtering.
ATR period (default: 14) - Period used for ATR calculation.
High-volatility threshold multiplier (default: 1.2) - The current ATR must exceed the 20-bar ATR average by this multiplier for "!!" to appear.
Design Settings
Corner (default: 0) - Panel anchor corner. 0: Top Left, 1: Top Right, 2: Bottom Left, 3: Bottom Right.
X/Y position (default: 20/40) - Panel position offset in pixels.
Symbol label width (default: 80) - Width of the symbol name column.
Button width/height (default: 55/25) - Size of each cell.
Font size (default: 8) - Text size inside the cells.
Color settings - Uptrend, downtrend, range, high-volatility border, high-volatility text, and label background colors can all be customized.
Alert Settings
Popup alert (default: true) - MT5 popup alert when "!!" appears together with a trend direction.
Push notification (default: false) - Push notification to the MT5 mobile app. Requires MetaQuotes ID setup.
Email notification (default: false) - Email notification. Requires SMTP setup in MT5.
Alerts are sent only when a trend direction is present (UP!! or DN!!). Range-state volatility (wait!!) does not trigger alerts. Alerts are suppressed for 60 seconds after startup to avoid unnecessary notifications from already existing conditions. Duplicate alerts on the same bar are also prevented.
FAQ
Q: The panel does not appear.
A: First, check that the necessary MT5 permissions and settings are enabled in your platform environment. Also confirm that the symbol names match your broker's naming convention. If needed, reset the indicator to default settings and try again.
Q: Some symbols show "-" and do not update.
A: The indicator may not yet have enough history data for those symbols. In Market Watch, right-click and select "Show All" to make sure the symbols are available. You can also open the missing symbol on a chart briefly to trigger data download.
Q: All cells show "wait."
A: This means no clear directional trend is currently detected across your monitored symbols. This is normal behavior. In these conditions, waiting for stronger alignment may be the better approach.
Q: "!!" appears but I receive no notification.
A: Alerts are sent only for UP!! and DN!!, not wait!!. Make sure at least one notification type is enabled. Push notifications require MetaQuotes ID configuration, and alerts are also suppressed during the first 60 seconds after startup.
Q: Is there an MT4 version?
A: Yes. An MT4 version is available separately and follows the same core concept and logic.
Q: Which chart should I attach this to?
A: Any chart is fine. The panel monitors all symbols listed in the parameters regardless of the host chart, so one instance is usually enough.
Q: Does it work on Gold and crypto?
A: Yes, as long as your broker provides those symbols. You can enter XAUUSD, BTCUSD, or any supported broker symbol in the symbols parameter.
Q: Can I click cells to switch charts?
A: Yes. Each cell functions as a button, and clicking it switches the chart to that symbol and timeframe.
Key Features
- Real-time multi-symbol, multi-timeframe dashboard
- Four states: UP, DN, wait, and !! (high volatility)
- One-click chart switching from any cell
- ADX-based trend filter to reduce range-market noise
- ATR-based volatility detection to highlight abnormal movement
- Popup, push, and email notifications (trend-direction only; no wait!! alerts)
- 60-second startup alert suppression to reduce false triggers
- Fully customizable symbols, timeframes, colors, and layout
- Auto-detection of broker symbol naming conventions
- Can be used with Forex, Gold, indices, and crypto supported by your broker
- No DLL required
About the Developer
Designed and developed with a data-driven approach. Environment Pro was built as a practical market-scanning dashboard to help traders quickly identify where market conditions appear organized and where they do not, before applying their own trading rules.
The logic combines proven technical methods: EMA-based directional assessment, ADX trend-strength filtering, and ATR volatility-spike detection. No black-box algorithms, no vague signal logic.
Concept: See the market at a glance. Focus only where conditions matter.
Disclaimer
This indicator does not provide investment advice. All displayed information is reference data derived from technical analysis and does not guarantee future price movement. All trading decisions are made at the user's own risk. The author accepts no liability for any losses resulting from the use of this indicator.