Visual Pulse Dynamics Flow Indicator
- Indicatori
-
AL MOOSAWI ABDULLAH JAFFER BAQER
 To trade successfully we need to go through the proven path that others had gone and reached!
Here are 17 quotes from such successful investors:
1- Limit your size in any position so that fear does not become the prevailing instinct guiding your judgment.
Joe Vidich - Versione: 1.0
- Attivazioni: 5
| • Please test the product in the Strategy Tester before purchasing to understand how it works. • If you face any issues, contact me via private message—I’m always available to help. • After purchase, send me a screenshot of your order to receive a FREE EA as a gift. |
|---|
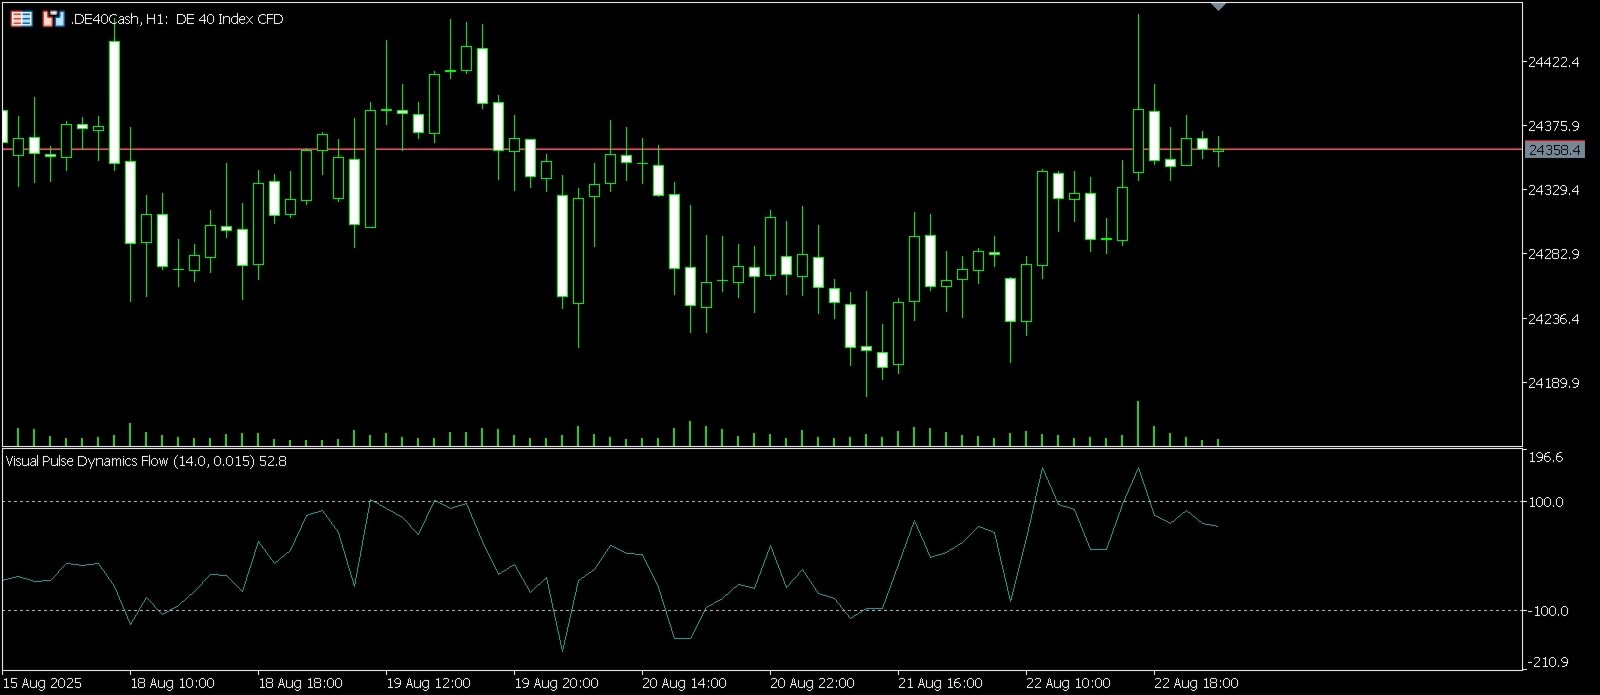
Visual Pulse Dynamics Flow: Master Market Momentum
Unlock a new level of market insight with the Visual Pulse Dynamics Flow indicator. Designed for the discerning trader who demands precision and responsiveness, this tool moves beyond traditional oscillators to provide a clearer, faster signal of market momentum and potential trend reversals. For just $30, gain an indispensable edge in your trading toolkit.
The Logic Behind the Flow
At its core, the Visual Pulse Dynamics Flow is a sophisticated momentum oscillator engineered to measure the deviation of price from its central tendency. It is an advanced evolution of the classic Commodity Channel Index (CCI), rebuilt with a more responsive calculation method to excel in today's fast-paced markets.
Here is a detailed breakdown of its proprietary calculation process:
-
Dynamic Price Average: Unlike standard indicators that use a Simple Moving Average (SMA), which can lag significantly, this indicator uses an Exponential Moving Average (EMA) to calculate the average price. The EMA gives greater weight to the most recent price data, creating a baseline that reacts more quickly to changes in the market trend. The formula for this is: EMAcurrent=EMAprevious+(Pricecurrent−EMAprevious)×α where the smoothing factor α is calculated as Period+12.
-
Measuring the Pulse: The indicator then calculates the deviation, or the distance, between the current price and this dynamic EMA. This value represents the raw strength and direction of the current market "pulse". A large positive deviation indicates strong buying pressure, while a large negative deviation signals strong selling pressure.
-
Normalizing for Consistency: To make these raw pulse values comparable across any timeframe or market condition, they are normalized. This is achieved by calculating an EMA of the absolute value of the deviations. This creates a smooth, adaptive measure of recent volatility.
-
Generating the Final Signal: The final oscillator value is calculated by dividing the raw price deviation by the normalized volatility measure and a constant adjustment factor (0.015). This produces the smooth, intuitive line you see on your chart. The formula is: VPDFlow=EMA(Abs(Pricecurrent−EMA(Price)))×0.015Pricecurrent−EMA(Price)
This EMA-based methodology ensures that the Visual Pulse Dynamics Flow provides earlier and more reliable signals than its SMA-based counterparts.
How to Trade with Visual Pulse Dynamics Flow
The indicator is displayed in a separate window as a single line oscillating around a zero level, making it incredibly easy to interpret.
-
Overbought and Oversold Levels: The key levels are +100 and -100.
-
When the indicator line moves above the +100 level, it signals that the market is potentially overbought, and the bullish momentum may be exhausted. This is an opportune moment to look for sell signals or take profit on long positions.
-
When the line moves below the -100 level, it indicates a potentially oversold market. This is a warning that selling pressure may be fading and a bullish reversal could be imminent.
-
-
Zero Line Crossovers: The zero line acts as a dividing line between bullish and bearish momentum.
-
A crossover from below to above the zero line suggests a shift from bearish to bullish momentum and can be used as a buy signal confirmation.
-
A crossover from above to below the zero line indicates a shift from bullish to bearish momentum and can confirm a sell signal.
-
-
Divergence Signals: For more advanced analysis, divergence between the indicator and price action can signal powerful, high-probability reversals.
-
Bullish Divergence: If the price makes a new low but the indicator forms a higher low, it signals that downside momentum is weakening and a reversal to the upside is likely.
-
Bearish Divergence: If the price makes a new high but the indicator forms a lower high, it signals that upside momentum is failing and a reversal to the downside is likely.
-
Fully Customizable Parameters
-
Averaging Period: Control the sensitivity of the indicator. A shorter period (e.g., 7) will result in a faster, more responsive line suitable for scalping, while a longer period (e.g., 21) will provide a smoother line ideal for identifying longer-term trends.
-
Adjustment Factor: This scaling constant is preset to the industry standard of 0.015 to ensure the +100 and -100 levels remain statistically significant.
Why Choose This Indicator?
The Visual Pulse Dynamics Flow is more than just another tool; it is a refined instrument built for performance. Its EMA-based core provides a crucial time advantage over other oscillators, while its clear visual signals remove ambiguity from your trading decisions. Suitable for Forex, stocks, and commodities on any timeframe, it is the definitive tool for mastering market momentum.
Elevate your trading strategy and start making more informed decisions today.