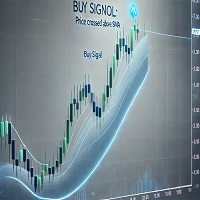
Visual Momentum Wave Oscillator Indicator
- Indicatori
-
AL MOOSAWI ABDULLAH JAFFER BAQER
 To trade successfully we need to go through the proven path that others had gone and reached!
Here are 17 quotes from such successful investors:
1- Limit your size in any position so that fear does not become the prevailing instinct guiding your judgment.
Joe Vidich - Versione: 4.0
- Aggiornato: 8 ottobre 2026
- Attivazioni: 5
| • Please test the product in the Strategy Tester before purchasing to understand how it works. • If you face any issues, contact me via private message—I’m always available to help. • After purchase, send me a screenshot of your order to receive a FREE EA as a gift. |
|---|
Unlock the potential of market momentum with the Visual Momentum Wave Oscillator, a sophisticated trading tool designed to provide clear and actionable insights into market dynamics. For just $30, this meticulously crafted indicator for MetaTrader 4 will empower you to identify high-probability entry and exit points with greater confidence.
The Logic Behind the Visual Momentum Wave Oscillator
The core of the Visual Momentum Wave Oscillator lies in its intelligent analysis of market momentum and volatility. It is engineered to cut through market noise and reveal the underlying strength and direction of price movements. The indicator accomplishes this through a multi-step calculation process that transforms raw price data into a clear visual representation of market sentiment.
First, the indicator calculates a "normalized value" for each price bar. This is achieved by taking the midpoint price of the high and low, and then determining its position within the a specified analysis period's highest high and lowest low. This normalization process scales the price action into a range of -1 to 1, providing a standardized measure of momentum.
To further refine this analysis, the normalized value undergoes a Fisher transformation. This mathematical process helps to amplify the oscillator's signals, making significant market shifts more apparent. The result is a value that more accurately reflects the conviction behind price movements, allowing you to distinguish between minor fluctuations and genuine trend developments.
Finally, to ensure smooth and reliable signals, the transformed values are smoothed using an exponential moving average. This crucial step filters out erratic movements, presenting you with a clear and easy-to-interpret wave that oscillates above and below a zero line. This smoothed wave is the heart of the indicator, visually representing the ebb and flow of market momentum.
Key Features and Customization
The Visual Momentum Wave Oscillator is not a one-size-fits-all tool. It offers a comprehensive suite of customizable parameters, allowing you to tailor its behavior to your specific trading style and the unique characteristics of different financial instruments.
Momentum Wave Parameters
These core settings control the fundamental calculations of the indicator:
-
Analysis Period: This parameter defines the lookback period for identifying the highest high and lowest low, forming the basis of the momentum calculation. A shorter period will make the indicator more sensitive to recent price action, while a longer period will provide a broader market perspective.
-
Smoothing Factor: This setting determines the degree of smoothing applied to the raw oscillator values. A higher factor will result in a smoother wave, ideal for long-term trend analysis, while a lower factor will produce a more responsive wave that closely tracks price changes.
-
Signal Threshold: This critical parameter sets the level at which the oscillator must cross to generate a trade signal. This allows you to filter out weaker signals and focus on movements with significant momentum.
Visual Settings
Customize the look and feel of the indicator to match your charting preferences:
-
Arrow Distance from Histogram: Adjust the vertical placement of the entry arrows for optimal visibility.
-
Positive and Negative Wave Colors: Choose colors that are easy for you to read and interpret.
-
Histogram Width: Modify the thickness of the histogram bars for enhanced clarity.
Signal Control
Gain precise control over how and when trade signals are generated:
-
Display Arrow Signals: Toggle the appearance of buy and sell arrows on your chart.
-
Enable Bars Between Signals: This unique feature helps to prevent overtrading by enforcing a minimum number of bars between consecutive signals.
-
Minimum Bars Between Signals: Specify the exact number of bars to wait before a new signal can be generated.
-
Allow Manual Lot Size: This option provides flexibility for traders who prefer to manually set their trade sizes.
The Visual Momentum Wave Oscillator is more than just an indicator; it is a comprehensive trading solution that provides a clear and logical approach to navigating the complexities of the financial markets. Its robust analytical foundation and extensive customization options make it an invaluable tool for both novice and experienced traders seeking to gain an edge.