 MetaTrader 5
 Experts
 Indicatori
 librerie
 Utilità
 Widget
 Regole
Guarda i video tutorial del Market su YouTube
Come acquistare un Robot di Trading o un indicatore
Esegui il tuo EA
hosting virtuale
hosting virtuale
Prova un indicatore/robot di trading prima di acquistarlo
Vuoi guadagnare nel Market?
Come presentare un prodotto per venderlo con successo
Expert Advisors e Indicatori per MetaTrader 5
 Usa i robot di trading e gli indicatori per rendere il trading sul Forex più redditizio. I robot di trading ti permettono di automatizzare l'apertura e la chiusura delle transazioni, e gli indicatori ti aiutano a prevedere con maggior precisione il comportamento del mercato. La pagina contiene il catalogo delle applicazioni MetaTrader 5.
Tick Volume Chart - uno strumento unico per la creazione di grafici basati sui volumi di tick in MetaTrader 5 . Con Tick Volume Chart puoi costruire grafici in cui ogni candela si forma non in base al tempo, ma in base a un numero prestabilito di tick. Questo ti offre una precisione ideale nell'analisi dell'attività di mercato, irraggiungibile con i grafici temporali standard. Puoi utilizzare qualsiasi indicatore e Expert Advisor con supporto per simboli personalizzati. Lavorare con i grafici ot

TickChart transforms your MetaTrader 5 chart into a full-screen tick-by-tick price visualization, giving you the same live tick chart found in the MT5 "New Order" panel — but expanded across your entire chart window with no size limitations. Who Is This For Scalpers who need to see micro price structure that candlesticks hide between bar closes News traders who need to watch the exact moment price reacts to a release tick by tick Manual traders who place orders directly on the chart and need to
FREE
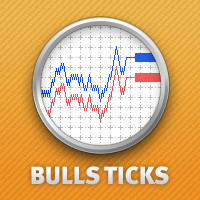
The Bulls Power indicator drawn using a tick chart. After launching it, wait for enough ticks to come. Parameters: Period - period of averaging. The number of ticks to identify high/low - number of single ticks for determining high/low. Calculated bar - number of bars for the indicator calculation. The following parameters are intended for adjusting the weight of Bulls Power signals (from 0 to 100). You can find their description in the Signals of the Bulls Power oscillator section of MQL5 Refer

Tick Chart Custom
Anti-Repaint Persistence & Smart Refresh System Una delle funzionalità più potenti di questo indicatore è "Use Anti-Repaint Persistence" . Questa funzione è stata creata affinché, anche se chiudi MetaTrader 5 o riapri il grafico dopo ore o giorni, il tick chart venga ripristinato esattamente com’era, mantenendo la stessa apparenza visiva e tutti i dati calcolati. Ciò garantisce che i tuoi indicatori (soprattutto quelli sensibili alla storia delle barre) continuino a funzionare
NtickChart-BVcandle Features This is a free version with limited functionality.
This is a tick chart indicator that displays in a sub-window. Inspired by Bob Volman's (BV) scalping method, it is designed as a tool for achieving simple and effective trading. It is a tick chart specifically for day trading and scalping, focusing even on 1 pipette changes. Instead of time-based candle bars, it generates candle bars for a specified number of ticks (ticks_in_candle). This allows for a more detailed
FREE

Generates custom tick-based charts. Runs as a service. Key Features: Custom Tick Bars: Define the exact number of ticks per candle. Auto-Setup: Automatically creates the custom symbol in Market Watch and loads history. Session Control: Automatically closes the current bar at the end of the trading day. Real-Time: Updates seamlessly with live market data. Parameters: Source Symbol: Base asset (e.g., EURUSD). Required. Symbol suffix: Suffix for the new symbol (default: _TICK ). Ticks per bar: Tick
FREE

Presentation
Another indicator that makes scalping on tick charts easier, it displays an Heiken Ashi graph in Ticks.
It allows to detect entry points and trend reversals. Recommended number of ticks in a candle : 5, 13 or 21.
Parameters Ticks in candle: Number of ticks in a candle (default 5), Displays Trend arrows : displays a trend arrow based on EMA8 and EMA20 crossing, Displays MM50, Displays MM100, Max Candle (CPU): number of candles max to manage, low value will save ressources of your
FREE

Trade on Bybit with MT5/MT4 EAs and indicators! GRat_BybitImport is a tool for manual and automated trading , including ANY available EA, ANY cryptocurrency on one the most popular crypto exchanges Bybit 24/7. Features 1. ALL Bybit instruments are available. 2. Import(automatic copying) to the specified Bybit currency all trades (made manually or by an EA) from an MT5 account (including demo) by the specified symbol and/or magic number. 3. Import(automatic copying) to the specified By

Seconds Scalper Pro è uno strumento che crea grafici in tempo reale con candele da 1 a 60 secondi in MetaTrader 5, con un pannello di trading completo integrato direttamente nel grafico. Puoi piazzare ordini a mercato e in attesa, modificare Stop Loss e Take Profit trascinando le linee, gestire tutte le tue posizioni aperte da un singolo pulsante e operare su temporalità ultracorte con precisione e zero ritardo. PERCHÉ QUESTO STRUMENTO Operare sotto il minuto in MetaTrader 5 non è mai stato semp

Ultra Charts - Advanced Custom Chart Types for MT5 Get Manual Here! Get The Free Ultra Charts Trader Here! Ultra Charts is a comprehensive charting solution that brings professional-grade alternative chart types to MetaTrader 5. This Expert Advisor provides traders with multiple custom chart formats beyond standard time-based candlesticks, enabling enhanced technical analysis and pattern recognition. Chart Types Included The product includes six distinct chart types, each designed to filter mark
FREE
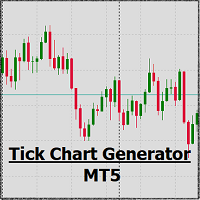
Tick Chart Monitor with countdown tick volume and easy to change tick size without going back to main chart. This work with Tick Chart Generator , which are available for download from the MQL5 Market: Tick chart generator: https://www.mql5.com/en/market/product/79763 NOTE: Custom symbols on MT5 are not directly tradable. This is by Metatrader5 design. If you want to place trades directly on the custom symbol generated by this product, you will either need a trade panel that offers this functi
FREE

TickChartAskLine is a specialized indicator for MetaTrader 5 designed to visualize floating spread on tick charts created with TickChartService. The indicator displays two lines on the chart: a blue Bid line (main price) and a red Ask line, allowing traders to visually track spread dynamics in real-time. This is critically important for scalpers and high-frequency traders who need to monitor entry costs at every tick level. The indicator automatically reads the saved spread from the custom sy
FREE
A Renko Tick chart based on continuously adjusting percentage.
Live Renko bricks formed by tick data
Adjustable brick width expert for indicator attached Scalp with a Renko, get weird.
The settings can and will break the script if you turn them up too high. Turning off outline mode will not look as nice, but can potentially allow for a larger number of bricks.
FREE

[New Era of Speed] Canvas Engine Powered Tick-Chart We have fundamentally redesigned the chart rendering system, fully migrating to a custom Canvas engine . This achieves an ultra-high-speed response equivalent to a raw tick chart , a level of performance impossible for standard indicators. Key Updates: Evolution to Canvas Rendering By minimizing the rendering load to the extreme, every micro-movement of each tick is captured in real-time. Experience a "silky smooth" interface with zero lag.
FREE

GENERADOR DE TICKS PRO – DOMINA EL MERCADO DESDE LA RAÍZ DEL PRECIO
ATENCION EL GRAFICO SE GENERA EN CUSTOM CHARTS ctrl+U , HABILITARLO PARA MOSTRARLO CON LA CANTIDAD DE TICKS PREFERIDA Y M1 EN EL MODO OFFLINE
Deja de depender de velas tradicionales… y empieza a ver el mercado como realmente se mueve: tick a tick . El Generador de Ticks PRO para MT5 transforma el flujo real del mercado en velas personalizadas basadas en cantidad de ticks , eliminando el ruido del tiempo y revelando la estr

VYXAXIS Dispatcher is a free companion utility for Vyxaxis Tick. It processes WebRequest and supported Push notifications independently from the main Vyxaxis Tick chart workflow. Requires Vyxaxis Tick. VYXAXIS Dispatcher does not generate trading signals, execute trades, or provide a trading strategy. It is designed to separate notification delivery from the main tick-chart processing workflow, helping reduce the possibility of network-related delays affecting Vyxaxis Tick during periods of high
FREE
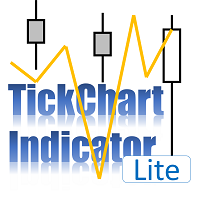
TickChart Indicator plots tick line on the main window of MetaTrader.
In the Lite version, the number of ticks is limited to 20 and the alert function described below is omitted. The tick-line shows the most detailed, fastest and real-time activities of the market, which are usually hidden in bars or candles longer than 1 minute. Usually, several new tick-line segments appear while a bar of M1 time frame is completed. After the release of an important economic indicator, the number of ticks per
FREE

Product name: BVCandleStream Overview Background service that automatically creates custom tick-based symbols (equal-tick bars) for scalping and price action analysis.
It converts raw ticks of standard symbols into custom bars with a fixed number of ticks per bar, so you can apply any standard MT5 indicators or EAs to these synthetic tick charts.
Key Features 1. Tick-Based Bar Generation Monitors the symbol of the open chart and automatically groups ticks into bars at the specified count ( InpT
FREE

DO NOT DOWNLOAD UNLESS YOU OWN "Tick Chart - Constant Volume Generator EA" - This indicator acts as remote control of the specifc EA. The link for "Tick Chart - Constant Volume Generator EA" : https://www.mql5.com/en/market/product/171018 1. Tick Chart Monitor 1.1 What It Does The Monitor is an indicator that runs directly on the generated tick chart. It provides a graphical control panel that lets you change the EA’s style, volume, start date, or trigger a full rebuild — without touching the
FREE

VYXAXIS TICK Strictly Manual Trading
No automated trading. No grid trading. No martingale. https://youtu.be/OZgR6MVuYnc VYXAXIS TICK See Clearly. React Faster. Trade Your Way. Brand Pronunciation: VYXAXIS is pronounced “VIX-A-SIX”. VYXAXIS TICK is a professional tick-chart trading utility for MetaTrader 5, designed for manual traders who want detailed market visualization, real-time market alerts, and a faster, more intuitive way to manage open positions. It combines a dedicated tick-chart engi

Low Timeframe Indicator shows under 1 minute timeframes candles. It uses tick chart data as input. If you need Seconds Timeframes in Meta trader as like as Trading view, but your Platform or broker doesn't support it, this indicator is a solution. No limitation on timeframe and symbols. As rapid as your brokers tick chart. Enhanced speed for 1 second charts. Supports all brokers and account types.

1. Overview The Tick Chart Toolset is a pair of tightly coupled MQL5 files that generate and control professional Constant Volume charts inside MetaTrader 5 as custom symbols. Unlike time-based charts, each bar closes only when a target volume threshold is reached, giving you a noise-filtered, activity-proportional view of the market.
Free "Tick Chart Monitor Indicator" to control the generator EA: https://www.mql5.com/en/market/product/17104 Component Type Role Tick_Chart_Generator_AI_MT5

Tick Copier EA — Description & Usage Guide Instead of seeing the market like everybody else using time based charts, instead view the market using ticks like an x-ray. This Expert Advisor (EA) for MetaTrader 5 copies live ticks from the chart it is attached to and sends them to a custom symbol you already created (for example EURUSD TICKS ). Each time a new market tick arrives: EA reads the current tick data from the source symbol. It copies the tick values: time bid price ask price last price

Secura Trade Manager Risk Management, Position Sizing, All Markets, Trailing Stops, Break Even, Forex-Gold-Crypto-Indices Overview Secura Trade Manager is the most complete risk management and trade execution panel available for MetaTrader 5. Designed for serious traders who refuse to leave money on the table, it transforms the way you plan, enter, manage, and close trades — across every asset class from Forex and Gold to Indices, Commodities, and Cryptocurrency. Stop guessing lot sizes. Stop m

1. Introduction Range Volume Hybrid (RVH) is a MetaTrader 5 Expert Advisor that creates custom chart symbols using a unique dual-condition bar formation method. Unlike traditional charts where bars close based on a single criterion (time, range, or volume), RVH bars close only when BOTH a minimum price range AND a minimum volume threshold are met simultaneously. Download also and install RVH Monito r Indicator - to control the EA from the custom charts (it's Free) https://www.mql5.com/en/marke

The indicator displays a tick chart converted to a second chart in the form of an oscillator.
In the settings, the first parameter sets the number in minutes of the history of extracting and analyzing real ticks. The second one can be selected in the settings for a scale of 1,2,3,4,5,6,10,20,30,60 seconds per point. You can also enable or disable the minute division grid (minute candlesticks of the chart)

Isolated Peak & Bottom – Trend Exhaustion and Reversal Indicator for MT5 An uptrend defined by higher highs does not create new highs every single day. At some point, price pauses, corrects, or reverses. The key challenge for traders is distinguishing between a temporary correction and the actual end of a trend . The Isolated Peak & Bottom indicator is designed to address this exact problem. Concept Behind the Indicator This indicator is based on the Isolated High / Low technique , a proven pric

ENGLISH VERSION tg @eeevleee TICK CHART SERVICE - Professional Tick Ch

BVCandleView is a fresh indicator designed to give discretionary traders a visual edge by rounding price data. Pair it with a free custom-symbol service to display Bob Volman–style tick charts right inside MetaTrader 5. Rounded candles with dynamic coloring make every tick movement instantly readable. Quick Manual Installation Place BVCandleView.mq5 in MQL5/Indicators . Restart MetaTrader 5 and attach the indicator to any chart.
Key Settings Rounding Settings : choose rounding mode (round/ce

**** New version - 1.66 **** Bug fixes, small improvements.
A Tick Chart app. It lets you create real-time tick charts, based on number of ticks per candle. You can choose the amount of ticks per candle, and the amount of ticks to load. Supports showing trade history and trade levels. When you add this EA to an instrument it automatically generates a custom symbol with the _Tick added to the name. The tick chart should open automatically. Make sure the timeframe of the tick chart is set to M
A simple indicator for plotting a tick chart.
This indicator will allow you to track the spread dynamics and the price behavior in general.
In the settings, you can select the price to display on the chart - Bid, Ask or both prices at the same time.
Tick Chart Indicator will definitely be useful when using scalping strategies. The MT4 version is available here . Good luck to everyone and successful trading!

Wave Anatomy Visit: http://www.trafethevolumewaves.com for more information Construct your own 5 Waves and analyze the price movements stages: Easy Movement Hard time to move Fast move This indicator is based on Wyckoff’s, David’s Weis and my Speed Index Theory. This indicator will you help analyze what is happening in 5 Price Waves that you can construct yourself. This tool is designed for scalpers and swing traders and will help them to analyze any wave on any timeframe at the same time. Fur

Trade on Binance in MT5! GRat_Crypto is a tool for manual and automated trading , including ANY available EA, ANY cryptocurrency on most popular crypto exchange Binance in the familiar MT5 environment 24/7. Features 1. ALL instruments of the most popular crypto exchange Binance . 2. The ability to place ANY type of order available in MT5, both market and pending, to modify orders and positions, to delete orders and close positions (even partially), to set trailing stop and trailing profit. 3

Ticks Candles Chart indicator build equi-volume candles and designed for Oracle Strategy The Period in ticks is set directly on the chart Tick chart opens in a separate window Recommended to use tick periods from 50 and above Works on real time only
Input Parameters Ticks_In_Bar - default period in ticks Counting_Bars - how many tick bars of history to build Custom_Symbol_Suffix - additional suffix for symbols

Trade on Binance with MT5/MT4 EAs and indicators! GRat_BinanceImport is a tool for manual and automated trading , including ANY available EA, ANY cryptocurrency on the most popular crypto exchange Binance 24/7. Features 1. ALL Binance instruments are available. 2. Import(automatic copying) to the specified Binance currency all trades (made manually or by an EA) from an MT5 account (including demo) by the specified symbol and/or magic number. 3. Import(automatic copying) to the specifie

Trade on crypto exchanges in MT5! GRat_Crypto is a tool for manual and automated trading , including ANY available EA, ANY cryptocurrency on most popular crypto exchanges in the familiar MT5 environment 24/7. Features 1. ALL instruments of the 9 most popular crypto exchanges are available: Binance, BingX, Bybit, Coinbase, CoinEx, Kraken, KuCoin, MEXC and OKX . 2. The ability to place ANY type of order available in MT5, both market and pending, to modify orders and positions, to delete order
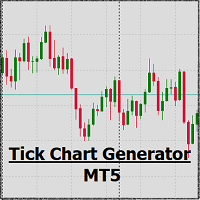
EA create custom Tick bar charts and provide real-time updates for MT5. This is an MT4 "offline" chart equivalent which is very simple to use. Generated Tick bar Chart compatible to MT5 indicator or template and perform your technical analysis with Multi timeframe analysis. The generator uses tick data to plot the historical tick chart for a particular setting and live ticks for plotting live charts. This method of calculation gives very accurate charts as no approximation is used. This EA creat

//////////////////////////////////////////////// //////////////////////////////////
This indicator displays the range of price changes in 1 minute. Great for risk management. This is an improved version of the standard Average True Range indicator for Tick Chart.
This is now double the precision and a colored averaging line.
The setting is quite simple - you just need to change the colors if necessary.
It is very easy to understand the readings of this indicator, the meaning is the same as
Questo è un grafico tick in secondo formato. C'è il supporto per OpenCL. Le impostazioni sono molto semplici: puoi selezionare i giorni della settimana per i quali verrà calcolato l'indicatore: ad esempio, per tali strumenti finanziari, le cui quotazioni non vengono aggiornate nei fine settimana, è necessario selezionare un qualsiasi altro giorno della settimana per il 6 e il 7 giorno, ma, ad esempio, per bitcoin, se il broker aggiorna le quotazioni, è possibile specificare per il 6 giorno -
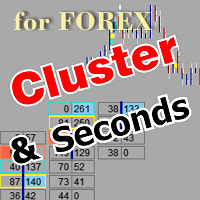
The utility allows you to build different types of graphs: Seconds chart from 1 second to 86400 seconds Tick chart from 1 tick and above The volume chart Delta chart Renko chart Range chart Product demo https://www.mql5.com/ru/channels/clustersecondforex Built-in indicators for volumetric analysis: daily market profile and market profile of the selected timeframe, Cluster Search Imbalance VWAP Dynamic POC, VAH, VAL the profile depth of the market vertical volume with various display options, del
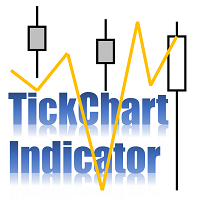
TickChart Indicator plots tick line on the main window of MetaTrader. ( Free version of this is "TickChart Indicator Lite" )
The tick-line shows the most detailed, fastest and real-time activities of the market, which are usually hidden in bars or candles longer than 1 minute. Usually, several new tick-line segments appear while a bar of M1 time frame is completed. After the release of an important economic indicator, the number of ticks per bar may exceeds 100. This indicator overlays the tick
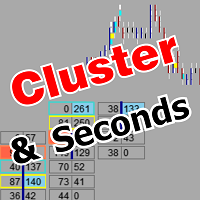
The utility allows you to build different types of graphs: Seconds chart from 1 second to 86400 seconds Tick chart from 1 tick and above The volume chart Delta chart Renko chart Range chart Demo version of the utility https://www.mql5.com/ru/channels/clustersecond Built-in indicators for volumetric analysis: daily market profile and market profile of the selected timeframe, Cluster Search Imbalance VWAP Dynamic POC, VAH, VAL the profile depth of the market vertical volume with various display op
IceFX VelocityMeter Mini is a very unique indicator on MetaTrader 4 platform which measures the speed of the Forex market . It is not a normal volume or other measurement indicator because IceFX VelocityMeter Mini is capable to understand market speed movements which are hidden in ticks and those valuable information cannot be read in an ordinary way from the candles. The software monitors the received ticks (frequency, magnitude of change) within a specified time range, analyzes these info and

This indicator allows you to enjoy the two most popular products for analyzing request volumes and market deals at a favorable price: Actual Depth of Market Chart Actual Tick Footprint Volume Chart This product combines the power of both indicators and is provided as a single file. The functionality of Actual COMBO Depth of Market AND Tick Volume Chart is fully identical to the original indicators. You will enjoy the power of these two products combined into the single super-indicator! Below is
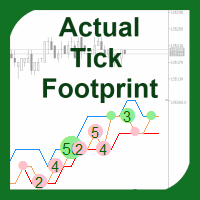
This new unique indicator Actual tick footprint (volume chart) is developed for using on Futures markets, and it allows seeing the volume of real deals right when they are performed. The indicator Actual tick footprint (volume chart) represents a greatly enhanced tick chart that includes additional information about the volume of deal performed at a specific price. In addition, this unique indicator for MetaTrader 5 allows to clearly detecting a deal type – buy or sell. Alike the standard tick c
The Williams' Percent Range (%R) indicator drawn using a tick chart. After launching it, wait for enough ticks to come. Parameters: WPR Period - period of the indicator. Overbuying level - overbought level. Overselling level - oversold level. Сalculated bar - number of bars for the indicator calculation. The following parameters are intended for adjusting the weight of WPR signals (from 0 to 100). You can find their description in the Signals of the Williams Percent Range section of MQL5 Referen
The Average True Range (ATR) indicator drawn using a tick chart. After launching it, wait for enough ticks to come. Parameters: ATR Period - number of single periods used for the indicator calculation. The number of ticks to identify Bar - number of single ticks that form OHLC. Price levels count - number of displayed price levels (no levels are displayed if set to 0 or a lower value). Сalculated bar - number of bars for the indicator calculation.
The Price Channel indicator drawn using a tick chart. After launching it, wait for enough ticks to come. Parameters: Period - period for determining the channel boundaries. Price levels count - number of displayed price levels (no levels are displayed if set to 0). Bar under calculation - number of bars on the chart for the indicator calculation. Buffer indexes: 0 - Channel upper, 1 - Channel lower, 2 - Channel median.
The Heiken Ashi indicator drawn using a tick chart. It draws synthetic candlesticks that contain a definite number of ticks. Parameters: option prices - price option. It can be Bid, Ask or (Ask+Bid)/2. the number of ticks to identify Bar - number of ticks that form candlesticks. price levels count - number of displayed price levels (no levels are displayed if set to 0 or a lower value). calculated bar - number of bars on the chart. Buffer indexes: 0 - OPEN, 1 - HIGH, 2 - LOW, 3 - CLOSE.
The Bears Power indicator drawn using a tick chart. After launching it, wait for enough ticks to come. Parameters: Period - period of averaging. The number of ticks to identify high/low - number of single ticks for determining high/low. Calculated bar - number of bars for the indicator calculation. The following parameters are intended for adjusting the weight of Bears Power signals (from 0 to 100). You can find their description in the Signals of the Bears Power oscillator section of MQL5 Refe
The Momentum indicator drawn using a tick chart. After launching it, wait for enough ticks to come. Parameters: period - period of the indicator calculation. levels count - number of displayed levels (no levels are displayed if set to 0) calculated bar - number of bars for the indicator calculation.
The Moving Average Convergence/Divergence(MACD) indicator drawn using a tick chart. After launching it, wait for enough ticks to come. Parameters: Fast EMA period - indicator drawn using a tick chart. Slow EMA period - slow period of averaging. Signal SMA period - period of averaging of the signal line. calculated bar - number of bars on the chart for the indicator calculation. The following parameters are intended for adjusting the weight of MACD signals (from 0 to 100). You can find their desc
The Standard Deviation (StdDev) indicator drawn using a tick chart. After launching it, wait for enough ticks to come. Parameters: Period - period of averaging. Method - method of averaging. calculated bar - number of bars for the indicator calculation.
The Commodity Channel Index(CCI) indicator drawn using a tick chart. After launching it, wait for enough ticks to come. Parameters: period - number of single periods used for the indicator calculation. calculated bar - number of bars for the indicator calculation. The following parameters are intended for adjusting the weight of CCI signals (from 0 to 100). You can find their description in the Signals of the Commodity Channel Index section of MQL5 Reference. The oscillator has required directio
The Moving Average of Oscillator(OsMA) indicator drawn using a tick chart. After launching it, wait for enough ticks to come. Parameters: Fast EMA period - fast period of averaging. Slow EMA period - slow period of averaging. Signal SMA period - period of averaging of the signal line. calculated bar - number of bars for the indicator calculation.
The Relative Strength Index indicator drawn using a tick chart. After launching it, wait for enough ticks to come. Parameters: RSI Period - period of averaging. overbuying level - overbought level. overselling level - oversold level. calculated bar - number of bars on the chart for the indicator calculation. The following parameters are intended for adjusting the weight of RSI signals (from 0 to 100). You can find their description in the Signals of the Oscillator Relative Strength Index section
The Average Directional Movement Index indicator drawn using a tick chart. After launching it, wait for enough ticks to come. Parameters: Period - period of averaging. Сalculated bar - number of bars on the chart for the indicator calculation. Buffer indexes: 0 - MAIN_LINE, 1 - PLUSDI_LINE, 2 - MINUSDI_LINE.
The Bollinger Bands indicator drawn using a tick chart. After launching it, wait for enough ticks to come. Parameters: Period - period of averaging. Deviation - deviation from the main line. Price levels count - number of displayed price levels (no levels are displayed if set to 0). Bar under calculation - number of bars on the chart for the indicator calculation. Buffer indexes: 0 - BASE_LINE, 1 - UPPER_BAND, 2 - LOWER_BAND, 3 - BID, 4 - ASK.
The Envelopes indicator drawn using a tick chart. After launching it, wait for enough ticks to come. Parameters: Averaging period - period of averaging. Smoothing type - type of smoothing. Can have any values of the enumeration ENUM_MA_METHOD . Option prices - price to be used. Can be Ask, Bid or (Ask+Bid)/2. Deviation of boundaries from the midline (in percents) - deviation from the main line in percentage terms. Price levels count - number of displayed price levels (no levels are displayed if
Scopri come acquistare un robot di trading dal MetaTrader Market, il negozio di applicazioni per la piattaforma MetaTrader.
Il sistema di pagamento di MQL5.community supporta le transazioni tramite PayPal, carte bancarie e gli altri sistemi di pagamento più diffusi. Per essere pienamente soddisfatto, ti consigliamo vivamente di testare il robot di trading prima di acquistarlo.

Ti stai perdendo delle opportunità di trading:
- App di trading gratuite
- Oltre 8.000 segnali per il copy trading
- Notizie economiche per esplorare i mercati finanziari
Registrazione
Accedi
Accetti la politica del sito e le condizioni d’uso
Se non hai un account, registrati