Unisciti alla nostra fan page
- Visualizzazioni:
- 99
- Valutazioni:
- Pubblicato:
-
Hai bisogno di un robot o indicatore basato su questo codice? Ordinalo su Freelance Vai a Freelance
Panoramica
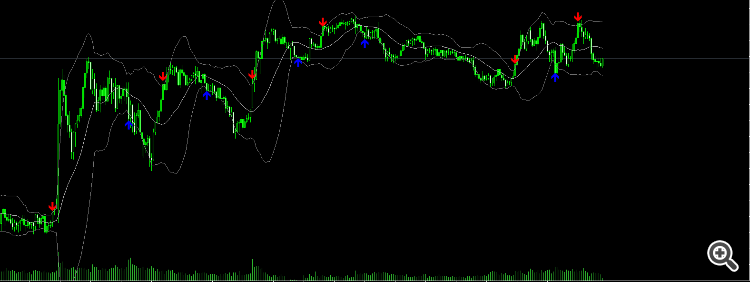
Questo indicatore personalizzato combina leBande di Bollinger con chiarefrecce di acquisto/vendita sul grafico.
Rileva automaticamente quando il prezzoattraversa la banda inferiore o quella superiore e traccia le frecce di conseguenza.
L'obiettivo è aiutare i trader a identificare rapidamentepotenziali punti di inversione ai margini della volatilità del mercato.
Come funziona
-
L'indicatore calcola leBande di Bollinger utilizzando la funzione integrata iBands.
-
Segnale di acquisto (freccia blu) → quando il prezzo chiudeal di sotto della banda inferiore della candela precedente e poi chiudeal di sopra di essa nella candela successiva.
-
Segnale di vendita (freccia rossa) → quando il prezzo chiudeal di sopra della banda superiore della candela precedente e poi chiudeal di sotto di essa nella candela successiva.
-
I segnali appaionosolo una volta per direzione fino a quando non si attiva un segnale opposto, evitando di ripetere le frecce nello stesso movimento.
-
Lebande di Bollinger possono essere visualizzate o nascoste a seconda delle preferenze dell'utente.
Caratteristiche dell'indicatore
-
Frecce di acquisto/vendita chiare direttamente sul grafico.
-
Visualizzazione opzionale delle Bande di Bollinger superiori, medie e inferiori.
-
Funziona sututti i simboli e i timeframe.
-
Utilizza una logica di non ridipingere (i segnali sono confermati dopo la chiusura della candela).
-
Parametri facili da personalizzare.
Parametri di ingresso
| Parametro | Descrizione |
|---|---|
| BB_Periodo | Numero di barre utilizzate per il calcolo delle Bande di Bollinger (default: 20). |
| BB_Deviazione | Moltiplicatore della deviazione standard delle bande (default: 2,0). |
| BB_Prezzo | Prezzo applicato alle bande di Bollinger (chiusura, apertura, massimo, minimo, ecc.). |
| Mostra_bande | Se vero, visualizza le Bande di Bollinger sul grafico; se falso, le nasconde. |
Esempio di utilizzo
-
Collegare l' indicatore al grafico.
-
ImpostareBB_Period e BB_Deviation in base al proprio stile di trading.
-
Osservare lefrecce blu vicino alla banda inferiore (potenziali acquisti) e lefrecce rosse vicino alla banda superiore (potenziali vendite).
-
Combinare con altre conferme, come ifiltri di tendenza o i pattern di candele, per ottenere una maggiore precisione.
Suggerimenti per il trading
-
Funziona bene neimercati laterali o con oscillazioni, dove il prezzo tocca spesso le bande di Bollinger.
-
Neimercati in forte tendenza, si consiglia di utilizzarlo con un filtro di tendenza (ad esempio, le medie mobili) per evitare segnali di controtendenza.
-
Testare sempre le impostazioni sul simbolo e sul timeframe preferiti.
Schermata
📜 Disclaimer
Questo indicatore è unostrumento di analisi tecnica e non garantisce profitti.
Utilizzatelo insieme a una correttagestione del rischio e ad altre strategie di trading.
Tradotto dall’inglese da MetaQuotes Ltd.
Codice originale https://www.mql5.com/en/code/62377
 Profilo di mercato
Il Market Profile è uno strumento utilizzato da molti trader di futures per analizzare la distribuzione statistica del prezzo nel tempo, per trovare la zona di prezzo e i valori di controllo per la sessione di trading giornaliera. L'indicatore si basa su un semplice movimento di prezzo e non utilizza gli indicatori standard della piattaforma MetaTrader 5.
 ATRPivot
L'indicatore ATRPivot costruisce i livelli di supporto e resistenza del prezzo dell'asset sul grafico tenendo conto dell'indicatore tecnico ATR True Range Average.
 Ascending Sort A Struct Array By A Field Example
Questo è un esempio di ordinamento ascendente di un elenco di strutture in base a un campo. È possibile scoprire e personalizzare l'algoritmo di cui sopra a seconda dello scopo di utilizzo, questo è l'esempio più elementare è anche una direzione per risolvere la disposizione in un array di strutture. L'algoritmo utilizzato in questo esempio è Quick Sort e Merge Sort.
 Nuvola di Ichimoku
Un indicatore Ishimoku troncato (Ichimoku Kinko Hyo), di cui rimane solo la nuvola.
