Unisciti alla nostra fan page
- Visualizzazioni:
- 98
- Valutazioni:
- Pubblicato:
-
Hai bisogno di un robot o indicatore basato su questo codice? Ordinalo su Freelance Vai a Freelance

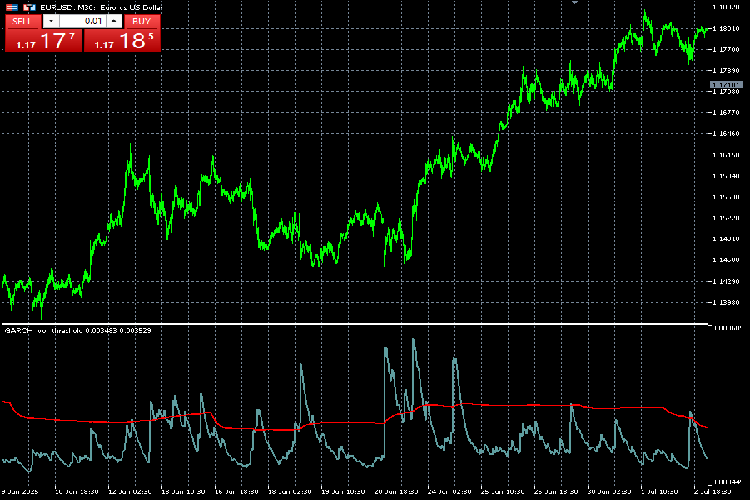
L'indicatore di volatilità/volume GARCH (Generalized AutoRegressive Conditional Heteroskedasticity) si basa sul modello di ricorsione GARCH(1,1), utilizzato nei mercati finanziari per prevedere la volatilità dell'azione dei prezzi delle attività finanziarie. Questo modello statistico viene utilizzato nell'analisi delle serie temporali finanziarie, dove si presume che la varianza di una serie temporale sia autocorrelata e che il termine di errore (differenza tra la previsione del modello e ciò che accade effettivamente) abbia un processo di media mobile autoregressiva che può essere modellato. La variazione del termine di errore dei mercati finanziari è sempre irregolare, da cui il nome di eterocorrelazione.
Le istituzioni finanziarie utilizzano il modello GARCH come stimatore della volatilità di azioni, obbligazioni e indici di mercato. Questo indicatore è stato testato su Forex, materie prime (XAUUSD) e criptovalute (BTCUSD).
Spazio di ingresso:
- variabile Gamma - termine costante (varianza incondizionata)
- Variabile Alfa - coefficiente ARCH (reazione all'ultimo shock)
- Variabile Beta - Coefficiente ARCH generalizzato (persistenza della varianza passata)
- Finestra di barre - Quantità di barre da includere nel rolling mean/std.
- Scala di soglia - L'impostazione predefinita è 1.
Linee:
- La linea blu cadetto rappresenta i valori di previsione GARCH a un passo della volatilità (varianza) per la candela successiva. Questa linea è calcolata utilizzando la formula GARCH(1,1) per la volatilità. Durante le variazioni drastiche dei rendimenti, la linea sale e decade lentamente fino alla linea di base, indicando un periodo di alta volatilità.
- La linea rossa rappresenta la soglia per identificare i periodi di alta/bassa volatilità. Ciò consente al trader di identificare un segnale a due linee incrociate, permettendo al contempo ai consulenti esperti di individuare facilmente le aree ad alta volatilità. La scala della soglia può anche essere amplificata.
Questo indicatore potrebbe non funzionare come previsto con i timeframe M1 e M5.
Per saperne di più sul GARCH: https://www.investopedia.com/terms/g/garch.asp
Tradotto dall’inglese da MetaQuotes Ltd.
Codice originale https://www.mql5.com/en/code/61205
 Frattali personalizzati
I frattali standard sono costituiti da 2 candele a destra e 2 candele a sinistra. Con questo frattale personalizzato è possibile scegliere il numero di candele desiderato, sia a sinistra che a destra.
 JCCX
JCCX
CCI (Commodity Channel Index) simmetrico normalizzato con algoritmi di mediazione alternativi - ultralineare e JMA.
 Segnale_trend_argento
L'indicatore fornisce segnali di trading per l'acquisto e la vendita con punti colorati sul grafico e visualizza messaggi.
 3_Livello_ZZ_Semafor
Un semplice indicatore che visualizza sul grafico i punti semaforici dei massimi e dei minimi dei periodi alti, medi e bassi.