Quanty HTF Candles
- Indicateurs
-
ATA YASAR PAYKOC
 Over a decade in the markets. Now I build the tools I wanted for myself.
I make clean, simple tools for MetaTrader 5. Each one does one job and stays readable on any chart, dark or light.
What you will find here
- HTF Candles: higher timeframe candles in a small floating panel. - Version: 1.10
Quanty HTF Candles shows the candles of higher timeframes, such as H4, D1 and W1, in a small floating panel on your chart. The candle forming now sits on the right of each timeframe, with its change and the time left until it closes, so you can follow the multi timeframe picture without switching charts.
The panel
- Drag it by its header to any place on the chart.
- Resize it by dragging its right edge, its bottom edge or the grip in the corner. The text grows and shrinks with it.
- The minus and plus buttons make it smaller or larger in steps. The fold button, or a double click on the header, folds it to a single line.
- Move the mouse over any candle to see its open, high, low, close, change and range.
- Each chart keeps its own panel position, size and settings, also after a timeframe change or a restart.
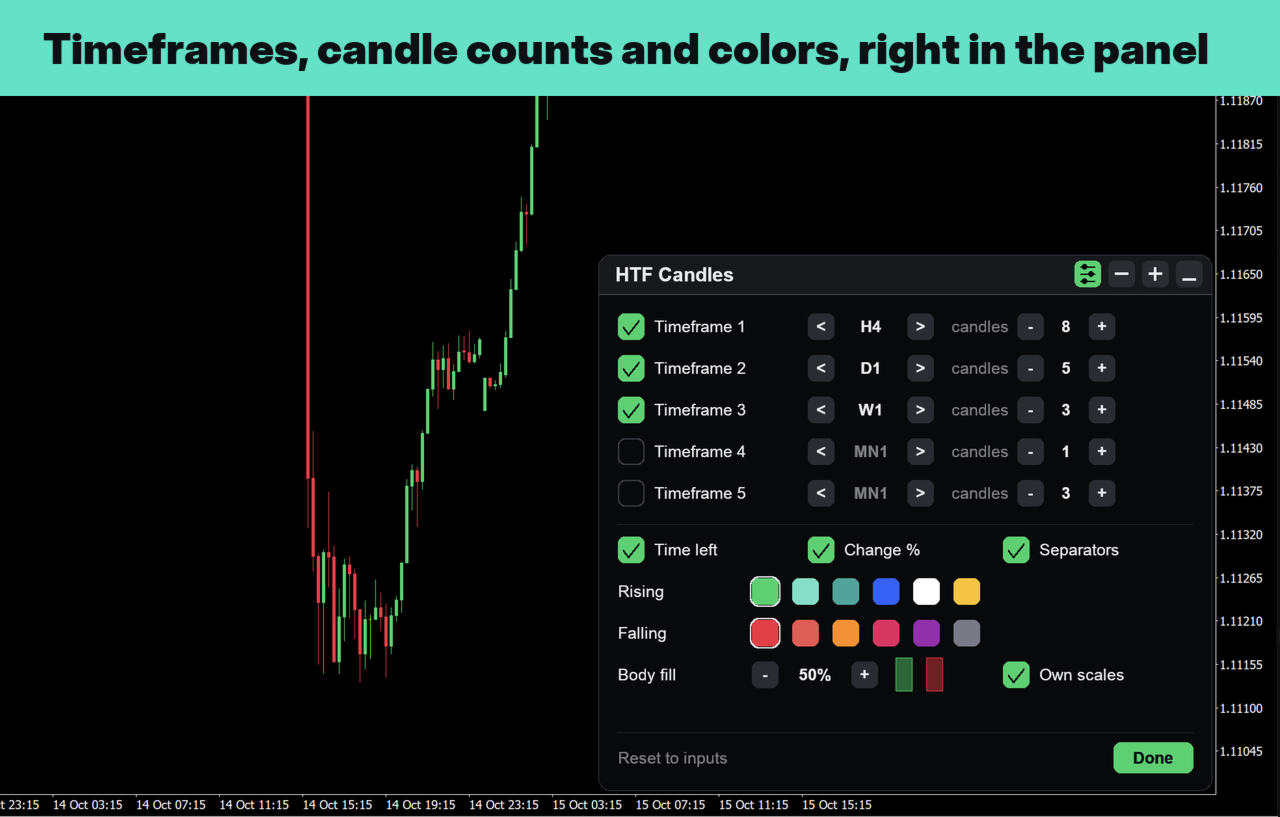
Settings inside the panel
The sliders button in the header opens the settings page. Every change is applied at once and kept for that chart.
- Up to five timeframes. Each can be switched on or off, set from M30 to MN1 with the arrows, and given 1 to 15 candles.
- Colors for rising and falling candles, from two palettes, and the body fill from an outline to a solid body.
- Time left, change in percent and the separators between timeframes can each be shown or hidden.
- Own scales gives every timeframe the full height of the panel, so small H4 candles stay readable next to a wide weekly candle. Switched off, all timeframes share one price scale.
- Reset to inputs returns to the values in the indicator's input window.
How it behaves
The candles are the terminal's own bars of those timeframes for the same symbol, so they match the chart of that timeframe. While the market is open the forming candle updates with every tick; while it is closed it is the last candle that traded. Once a candle's time has run out, for example the daily candle over the weekend, its label reads closed. A timeframe equal to or lower than the chart's own is not shown, and it comes back on a lower chart timeframe.
The panel takes its colors from the chart background, so it fits dark and light charts. It does not forecast, signal or trade.
If you prefer the candles drawn on the chart itself, to the right of the last bar, choose "On the chart" in the inputs.
Inputs
Display
- Where to show the candles. Floating panel or On the chart. Default: Floating panel.
- Panel size (60-200 %). Starting size; the minus and plus buttons change it too. Default: 100.
Timeframes
- Timeframe 1, 2, 3: show, timeframe, candles (1-15). Default: on, H4, 7 · on, D1, 4 · on, W1, 1.
(The panel's settings page adds two more timeframes.)
Layout (On the chart only)
- Distance from the last bar, Candle width, Gap between candles, Gap between timeframes, Make room on the right automatically.
Appearance
- Rising candle, Falling candle. Default: green, red.
- Body fill opacity (0-100 %). Default: 65.
- Wicks and text. Default: gray.
- Label font size. 6 to 24. Default: 10.
- Timeframe label, Time left in the candle, Separator between timeframes. Default: on.
- Separator color, Separator style. Default: gray, dotted.
- High and low prices, 50% line (On the chart only). Default: off.
Questions
Can I see more than three higher timeframes?
Yes. The settings page in the panel has five timeframes; switch on the fourth and fifth there.
The panel covers my candles. Can I move it?
Yes. Drag it by its header, make it smaller with the minus button or by its corner, or fold it to one line with a double click on the header.
Why do the H4 candles look larger than in the D1 or W1 chart?
With Own scales on, every timeframe fills the panel's height. Switch Own scales off in the settings to put all timeframes on one price scale.
What does the rightmost candle show when the market is closed?
The last candle that traded. Nothing is projected forward. Once its time has run out, the label below it reads closed.
Data, not advice.