ARV ML Dataset Export
- Utilitaires
-
Roman Amirov
 I’ve been trading Forex for over 5 years. During this time, I’ve tested a lot of third‑party EAs and realized a simple thing: if you want something done right, do it yourself! That’s why, instead of endlessly searching for the “perfect” ready‑made solution, I started turning my own trading ideas
 - Version: 1.0
- Activations: 5
ARV ML Dataset Export turns price history into a machine-learning dataset, ready for training an
ONNX model outside the terminal. One run on any chart produces two files:
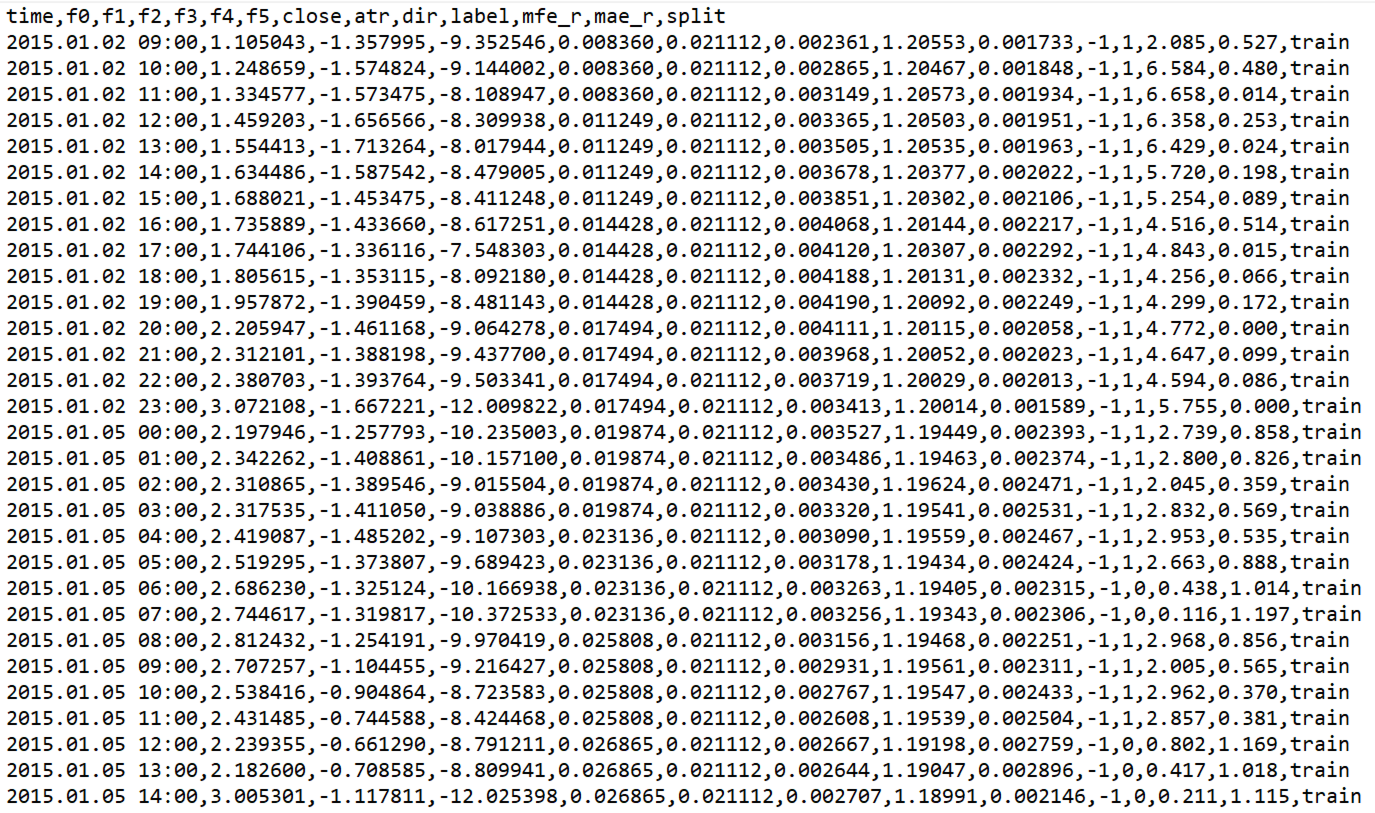
- "ARV_ML_<SYMBOL>_H1.csv" - the feature matrix, TP/SL labels, excursions and the train/test split.
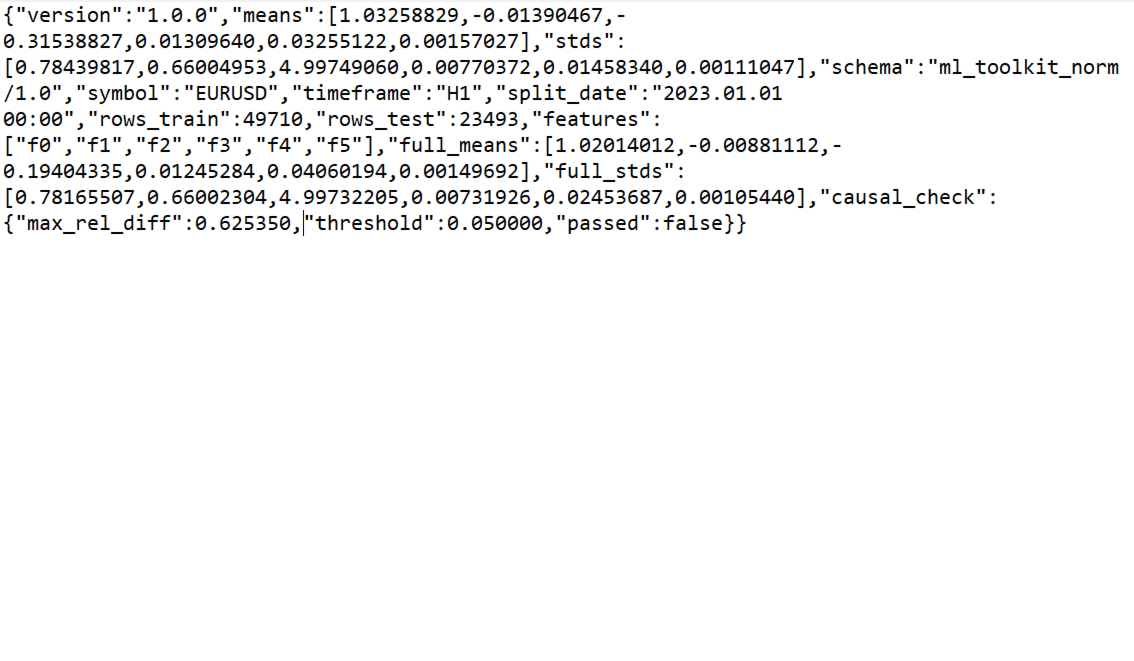
- "ARV_ML_Norm_<SYMBOL>_H1.json" - normalization statistics fitted on the training part only, plus a causality report.
The script only reads history and writes files inside the terminal sandbox. It does not trade, does
not place orders and does not send data anywhere.
Why normalization is fitted on the training window only
This is the part most dataset exporters get wrong.
If the mean and standard deviation are computed on the whole history and the model is then trained
on a part of that same history, future information leaks into the training data: the earliest bars
are scaled by statistics that already include later bars. The model then looks better in validation
than it really is.
The exported JSON therefore carries two sets of statistics: "means" and "stds" fitted on train rows
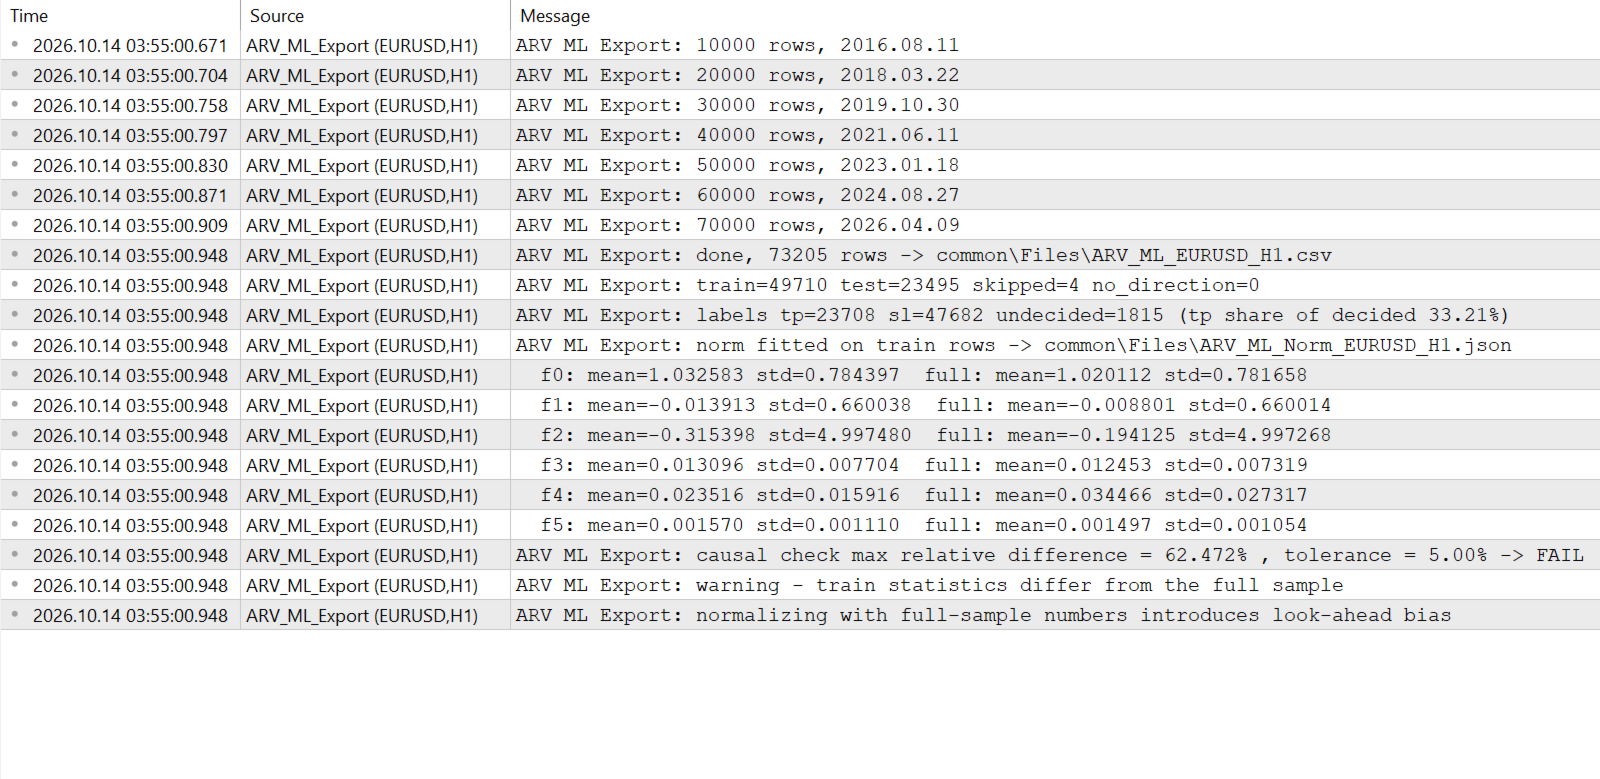
only, and "full_means" and "full_stds" computed on the whole sample. A "causal_check" block compares
them and reports "max_rel_diff". When the difference is above the tolerance set in "InpCausalTolPct",
the journal prints a FAIL line before any training starts.
The train/test split is a date (`InpSplitDate`), not a random shuffle. Financial series are not
independent, so a random split would put neighbouring bars from the same market regime into both
parts.
Output: CSV columns
Header line:
| time,f0,f1,f2,f3,f4,f5,close,atr,dir,label,mfe_r,mae_r,split |
|---|
| Column | Meaning |
|---|---|
| time | open time of the signal bar, "YYYY.MM.DD HH:MM" |
| f0..f5 | raw, unnormalized features of the closed H1 bar |
| close | close price of the signal bar |
| atr | ATR(14) of the H1 series at the signal bar |
| dir | trade direction "1" / "-1" / "0" |
| label | "1" if TP was reached before SL, "0" if SL came first, empty if neither happened inside the horizon |
| "mfe_r", "mae_r" | maximum favourable and adverse excursion inside the horizon, in R units |
| split | "train" or "test" |
Features:
f0 = |EMA20(H1)  - EMA50(H1)| / ATR14(H1)
f1 = (EMA20(H1)  - EMA20(H1) 5 bars ago) / ATR14(H1)
f2 = (Close(H1)  - EMA200(H1)) / ATR14(H1)
f3 = (BB_upper(H4) - BB_lower(H4)) / EMA20(H4)     Bollinger 20, 2.0
f4 = ATR14(M15) / Close(M15) * 100
f5 = StdDev20(H1, SMA) / EMA20(H1)
Output: JSON keys
version, means[6], stds[6], schema, symbol, timeframe, split_date,
rows_train, rows_test, features[], full_means[6], full_stds[6],
causal_check{max_rel_diff, threshold, passed}
Inputs
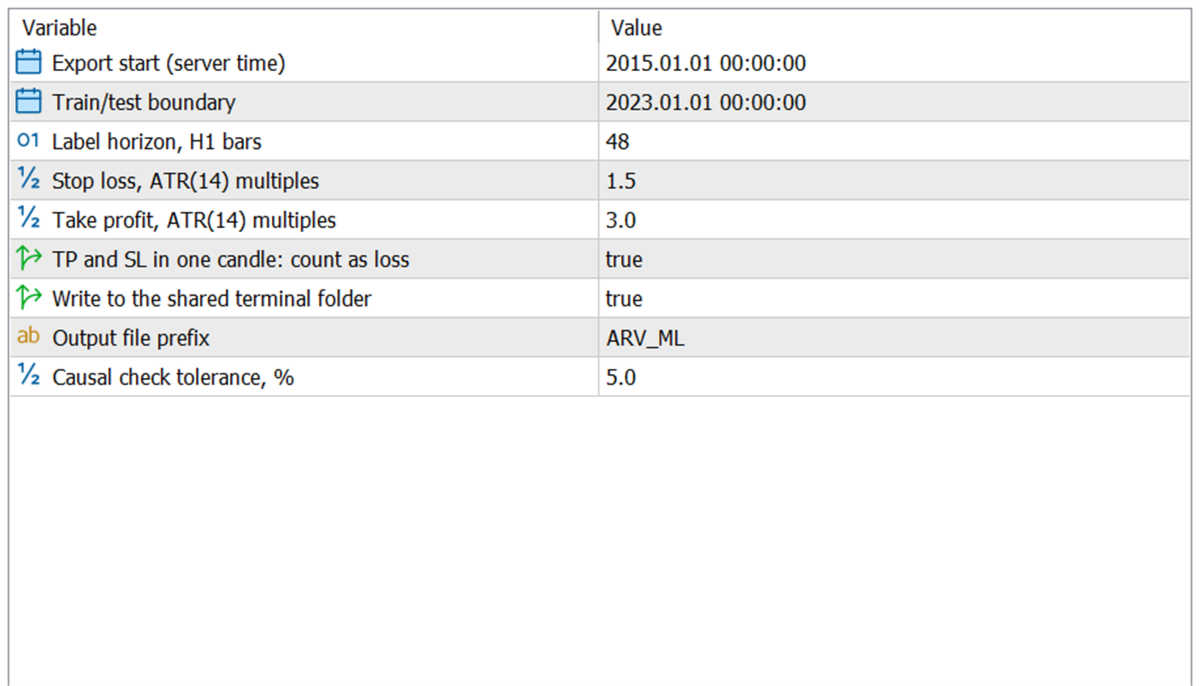
| Input | Default | Meaning |
|---|---|---|
| InpFrom | 2015.01.01 | Export start date, server time |
| InpSplitDate | 2023.01.01 | Boundary between the train and test parts |
| InpHorizonBars | 48 | How many H1 bars are scanned for a TP/SL outcome |
| InpSL_ATR_Mult | 1.5 | Stop loss distance in ATR(14,H1) multiples |
| InpTP_ATR_Mult | 3.0 | Take profit distance in ATR(14,H1) multiples |
| InpAmbigPessimistic | true | Bar touched both TP and SL: count it as a loss |
| InpUseCommon | true | Write to the shared terminal folder instead of "MQL5\Files" |
| InpPrefix | ARV_ML | Prefix of the output file names |
| InpCausalTolPct | 5.0 | Tolerance of the causality report, percent |
How to run
1. Copy "ARV_ML_Export.ex5" to the "MQL5\Scripts" folder of the terminal data directory.
2. Press F5 in the Navigator so the script appears.
3. Open a chart of the instrument you want to export. The chart period does not matter: the script
uses the H1, H4 and M15 series of that symbol.
4. Drag "ARV_ML_Export" onto the chart, check the inputs and press OK.
5. Wait for the line `ARV ML Export: done, ... rows` in Toolbox - Experts.
Training outside the terminal
Training is deliberately left outside the terminal. Load the CSV, normalize the features with the
"means" and "stds" from the JSON, train any model that can be exported to ONNX, and load it in
MetaTrader 5 with "OnnxCreateFromBuffer". The export is framework-agnostic: any tool that reads CSV
and JSON will do. A companion article on MQL5.com walks through the full pipeline from this dataset
to an ONNX model running in MetaTrader 5.
Compatibility
MetaTrader 5 build 3000 or later. Pure MQL5: no DLL, no WebRequest, no external services, no
licensing calls. The script is read-only with respect to the account: it never opens, modifies or
closes positions or orders.
Disclaimer
This utility produces data files only. It performs no trading operations: it does not open or close
positions, does not place orders and does not generate signals. Results obtained on the exported
dataset, or on models trained from it, depend on data quality and research method and do not
guarantee future results. The author is not responsible for trading decisions made on the basis of
this data.