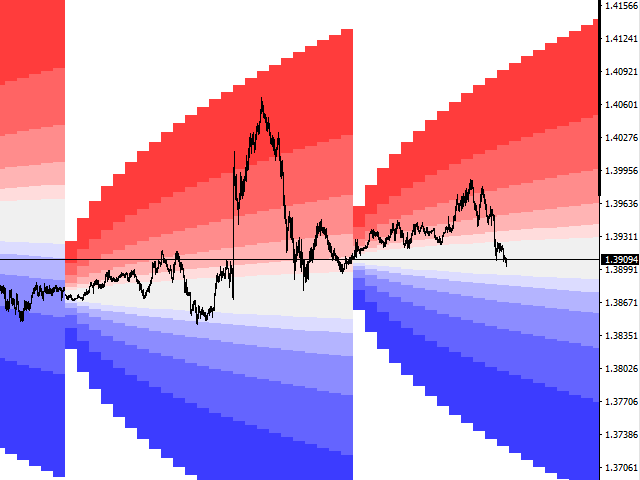
Projected Volatility Distribution
- Indicateurs
- Tsvetan Tsvetanov
- Version: 1.0
- Activations: 8
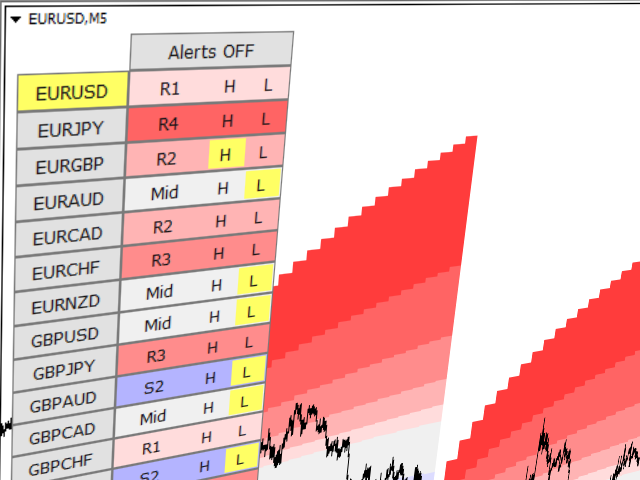
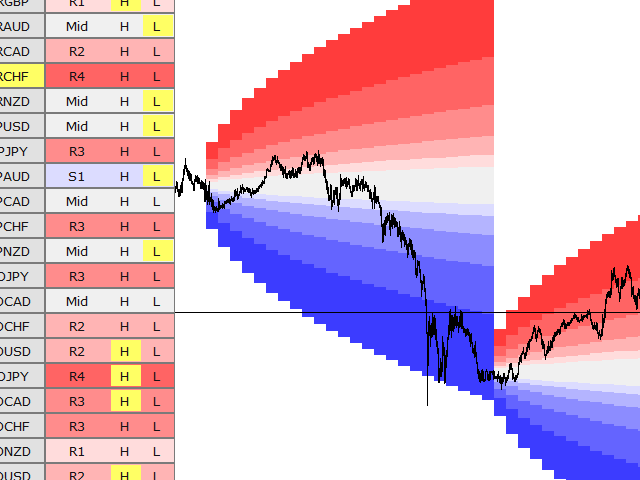
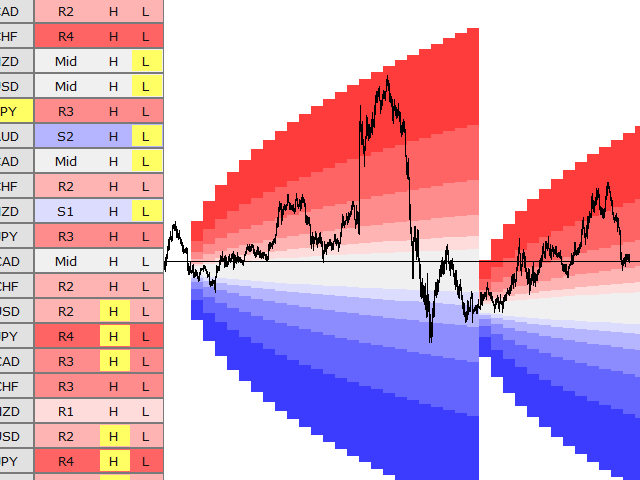
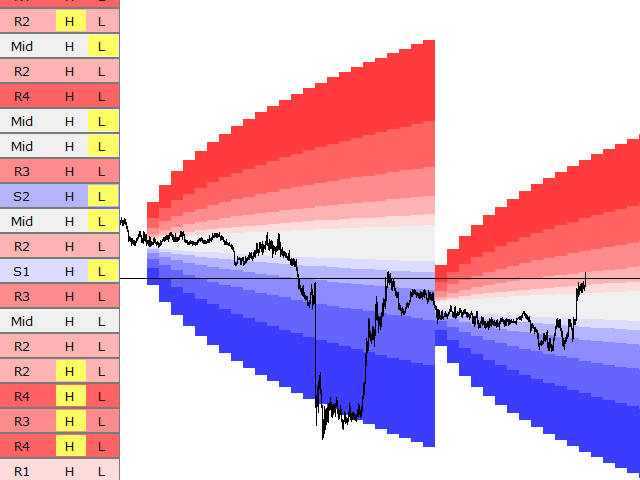
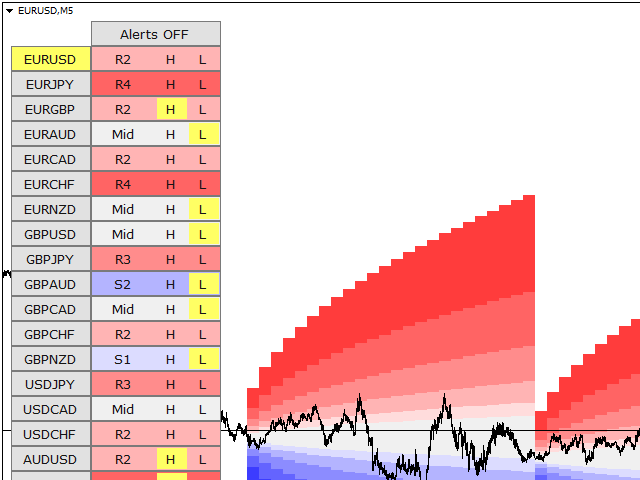
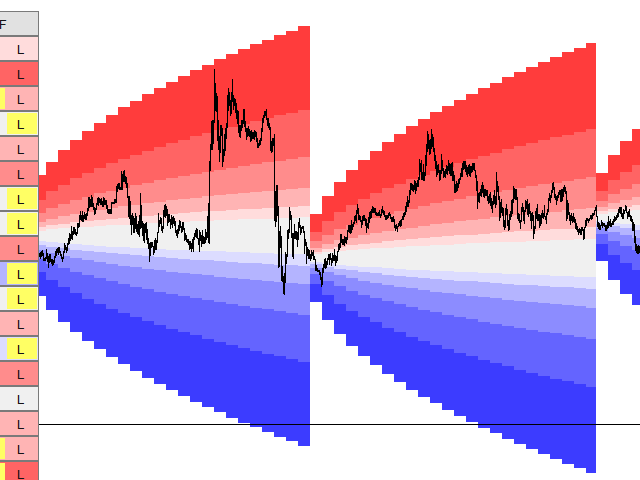
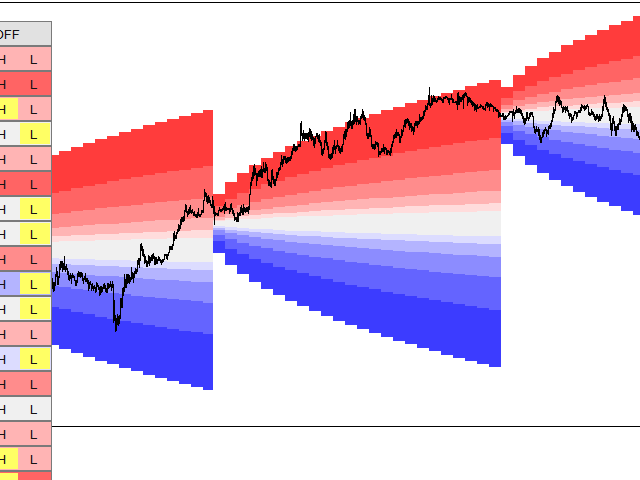
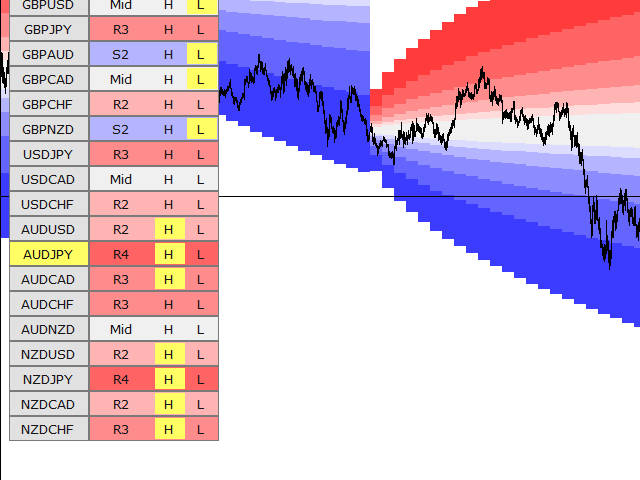
This indicator is using the Central Limit Theorem in combination with historical volatility and Fibonacci ratios in order to create unique type of chart tool called Projected Volatility Distribution. This tool allows you to perform highly accurate intraday technical analysis where in a split second you can detect overbought and oversold conditions as well as strong trends. In addition you have at your disposal multi-functional panel which shows signals in real time and gives you the ability to operate with large number of symbols from one chart.
Features
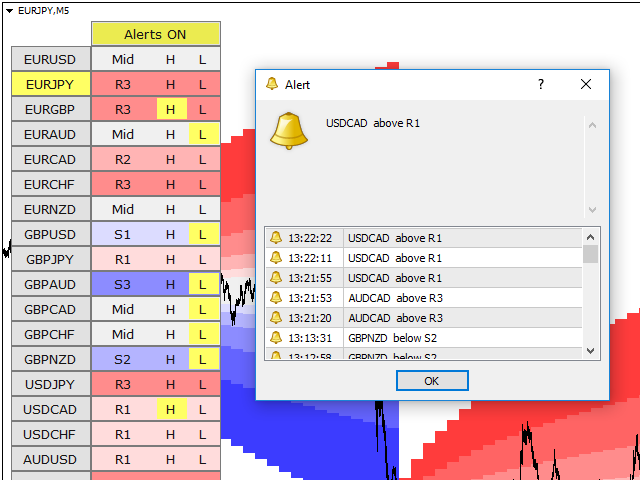
- Accurate signals in real time.
- Multi functional panel.
- Ability to switch between symbols with one click.
- Alerts + settings.
- Various options for customization.
- The indicator is automatically synchronized with the Market Watch window in Meta Trader 4 where you can set lists with your favorite symbols.
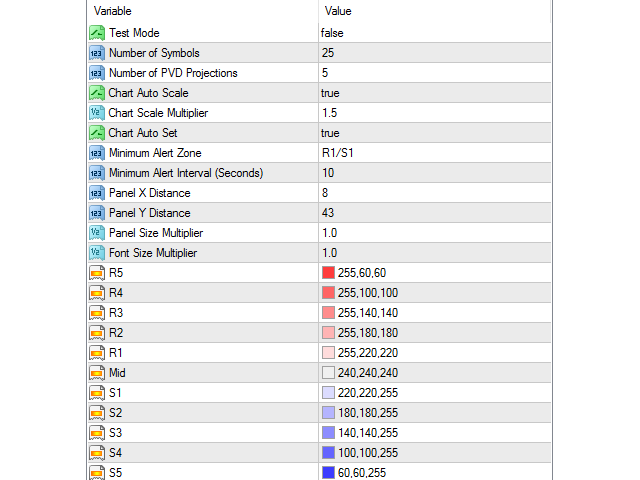
Settings
- Test Mode - prepare the indicator for work in the tester.
- Number of Symbols - how many symbol to show in the list.
- Number of PVD Projections - how many days to show. (1 means only the current day)
- Chart Auto Scale - enable/disable the automatic chart scaling.
- Chart Scale Multiplier - ratio for the vertical scale.
- Chart Auto Set - enable/disable the automatic chart configuration.
- Minimum Alert Zone - determines the alerts. For example, if you select R1/S1, the indicator will give you alerts for all levels. But if you select R5/S5 then you will not see alerts from the lower levels.
- Minimum Alert Interval - minimum time interval between the alerts for each symbol.
- Panel X Distance - horizontal distance from the upper left corner of the chart.
- Panel Y Distance - vertical distance from the upper left corner of the chart.
- Panel Size Multiplier - increase or decrease the size of the panel.
- Font Size Multiplier - increase or decrease the size of the font.
- Color Settings.
Note! The demo works only in the strategy tester with one symbol.
If you have some questions or if you need help, contact me via PM.