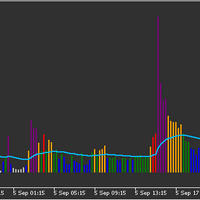
Volume Histogram with MA
- Indicateurs
- Version: 1.0

Volume Histogram with MA
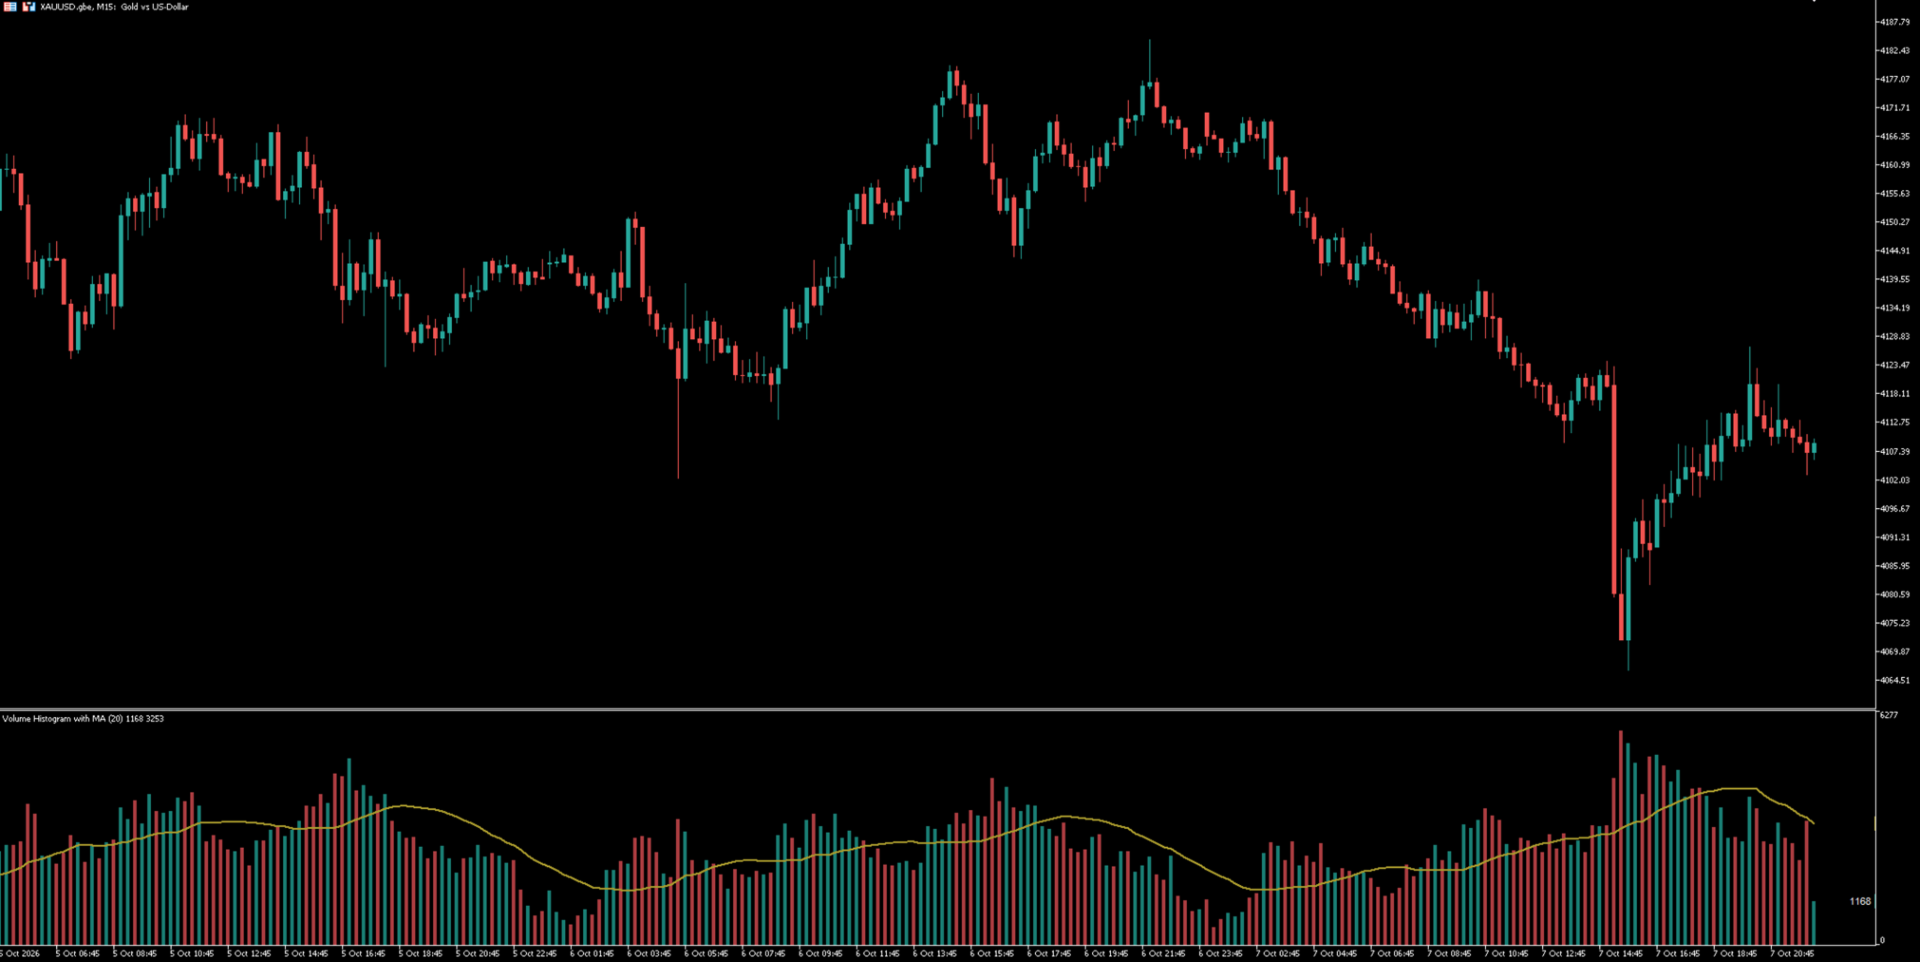
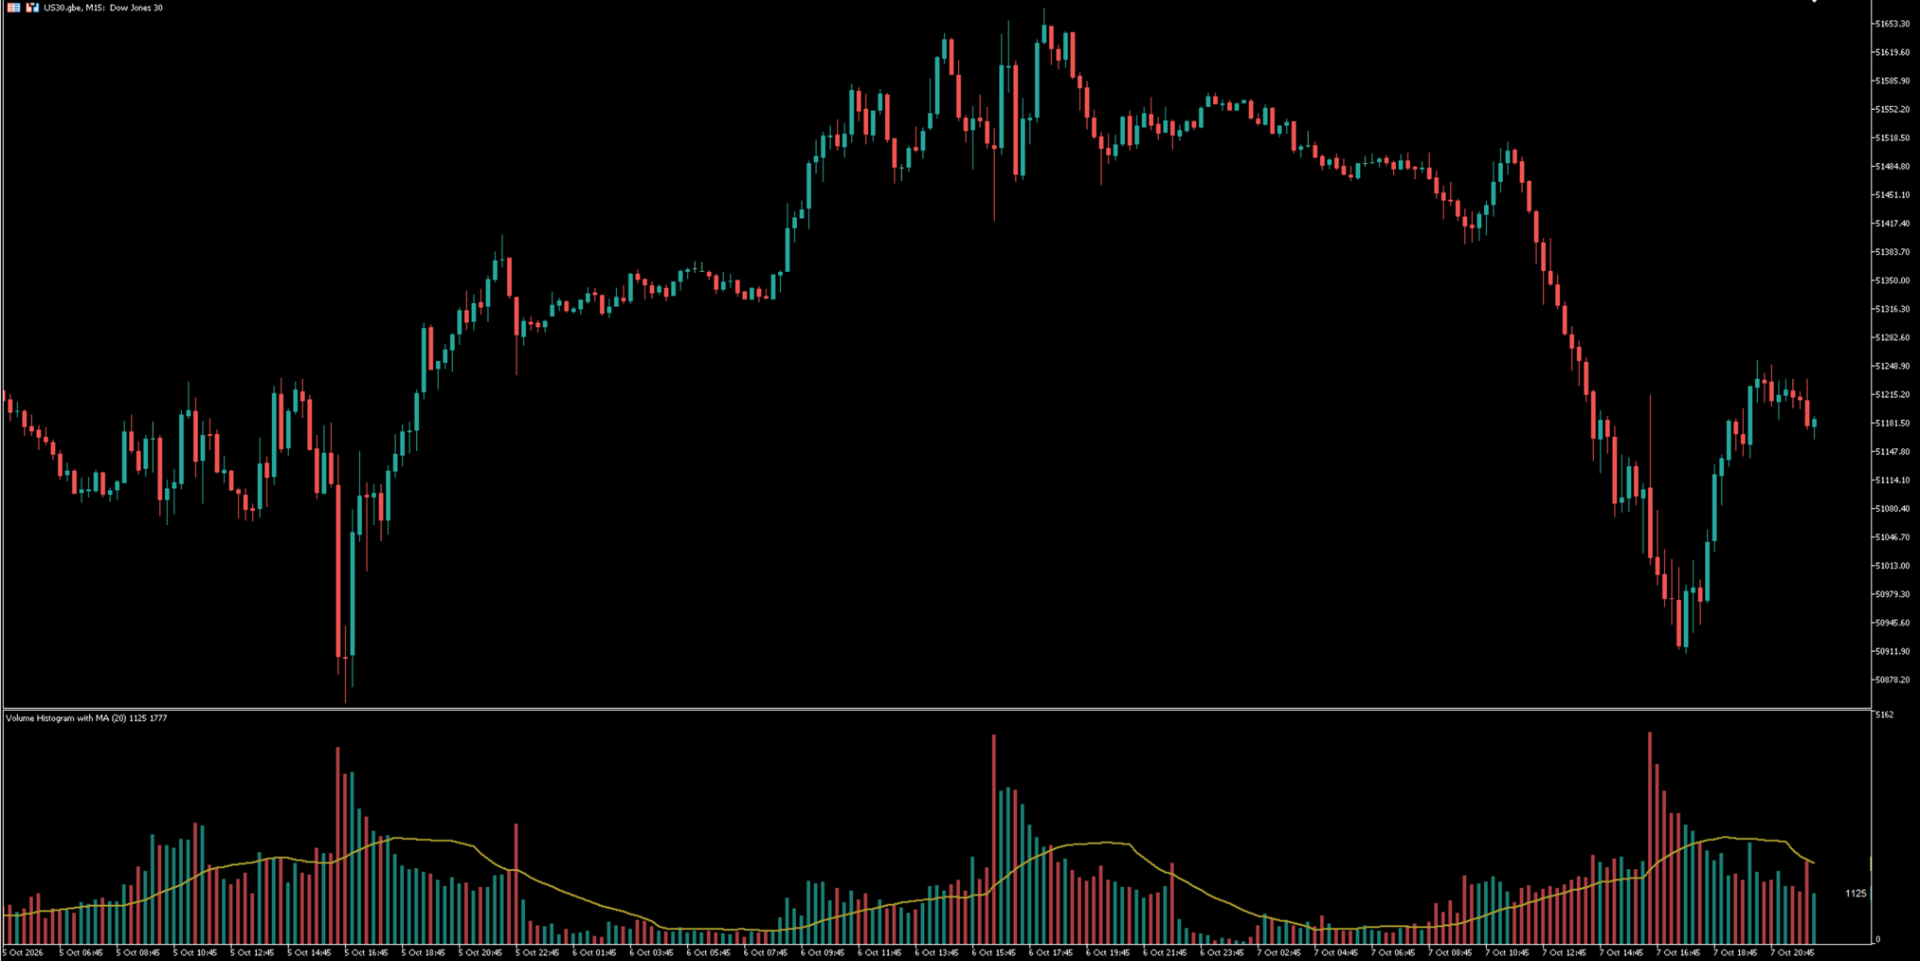
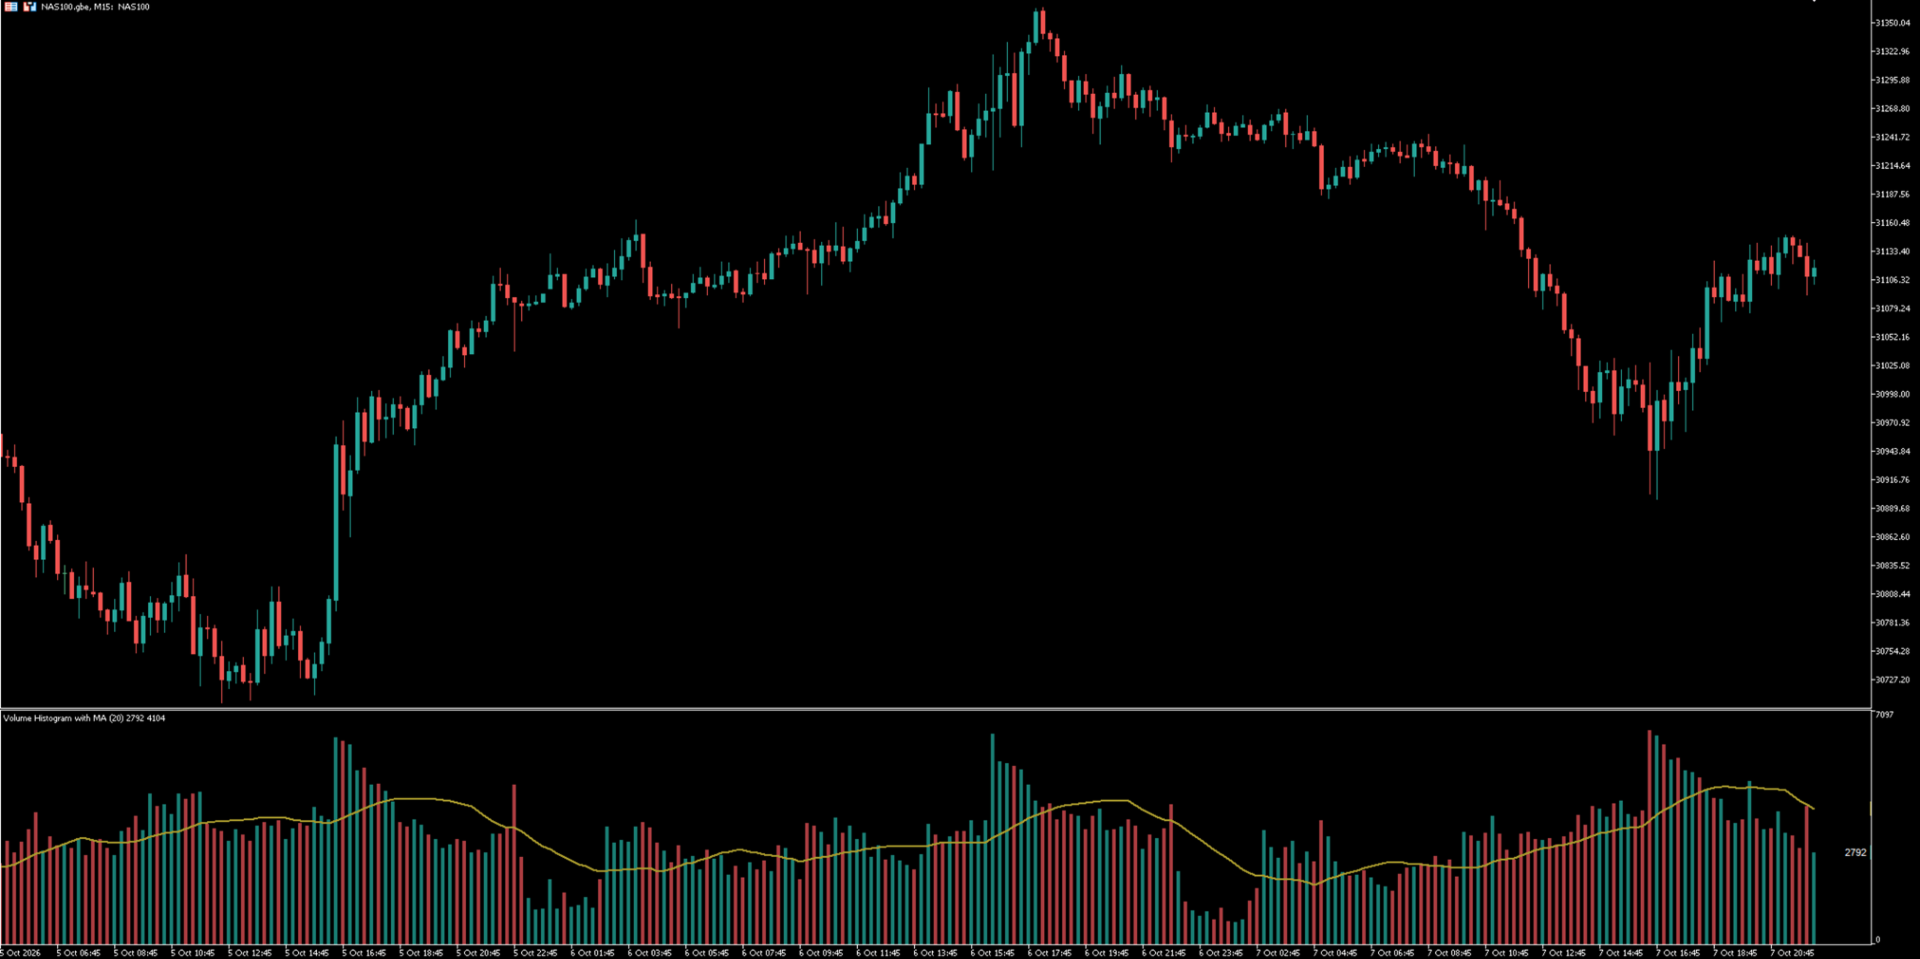
Volume Histogram with MA is a lightweight volume indicator for MetaTrader 5 designed to make changes in market activity easier to read.
The indicator displays volume as a color-coded histogram in a separate window and can overlay a simple moving average of the selected volume source.
The histogram color follows the direction of the corresponding price candle:
- Bullish or unchanged candle: bullish volume color
- Bearish candle: bearish volume color
The indicator supports Tick Volume, Real Volume and Auto mode. In Auto mode, it uses real volume when a non-zero real-volume value is available and automatically falls back to tick volume otherwise.
The optional Volume MA provides a simple visual reference for comparing current activity with its recent average.
Main Features
- Bullish and bearish volume histogram
- Optional simple moving average of volume
- Auto, Tick Volume and Real Volume source modes
- Automatic fallback to tick volume when real volume is unavailable
- Configurable bullish, bearish and MA colors
- Automatic histogram width based on chart zoom
- Optional manual histogram width
- Adjustable moving-average line width
- Optional current Volume and MA values on the right side
- Works on MetaTrader 5 chart timeframes
- No DLLs
- No WebRequest
- No external files
- No external indicators required
- Does not open, modify or close trades
How It Works
Volume Histogram
Each histogram bar represents the selected volume value for the corresponding price candle.
- Close >= Open -> bullish volume color
- Close < Open -> bearish volume color
Volume Moving Average
The moving-average line is calculated from the same volume source used by the histogram.
For example, with Moving Average Period = 20, the line represents the average selected volume over 20 bars.
Volume Source
Auto
Uses real volume when the broker provides a non-zero real-volume value. Otherwise, tick volume is used automatically.
Tick Volume
Always uses tick volume.
Real Volume
Always uses the real-volume data supplied by the broker. If the broker does not provide real volume for that instrument, values may be zero.
How to Use
1. Attach Volume Histogram with MA to any MetaTrader 5 chart.
2. Keep Volume Source = Auto for general use.
3. The default MA Period = 20 provides a balanced reference.
4. Compare the current volume bars with the Volume MA.
5. Use the information together with price action, market structure, support/resistance or your own trading methodology.
The indicator is intended as a market-analysis tool and is not a standalone buy/sell system.
Practical Examples
Above-average activity
When a volume bar rises above the Volume MA, current market activity is higher than its recent average.
Example:
Current Volume = 420
Volume MA = 280
This indicates stronger-than-usual activity during that candle.
Breakout confirmation
A trader can compare a breakout with current volume activity.
Example:
- Price breaks an important support or resistance level
- Current Volume is above the Volume MA
This shows that the breakout is occurring during increased market activity.
It does not guarantee that the breakout will continue.
Weak price move
If price makes a strong move while volume remains below its moving average, participation may be relatively weak.
Example:
- Price reaches a new local high
- Volume remains below the Volume MA
This can be used as additional context before making a trading decision.
Impulse versus pullback
During a trend, volume can help compare directional moves with corrections.
Example in an uptrend:
- Upward impulse -> higher volume
- Pullback -> lower volume
- New upward impulse -> volume increases again
This can help visualize whether participation is stronger during the trend direction or during the correction.
Volume spike
A sudden volume spike significantly above the Volume MA can highlight unusual activity.
This may occur during:
- Breakouts
- Economic news
- Session openings
- Strong momentum candles
- Periods of increased volatility
A volume spike should be interpreted together with price action and market context.
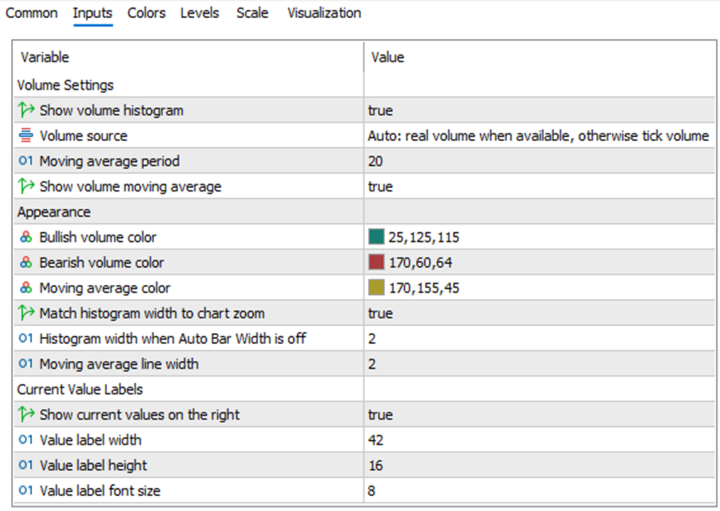
Inputs
Volume Settings
Show Volume Histogram
Shows or hides the volume histogram.
Volume Source
Selects:
- Auto
- Tick Volume
- Real Volume
Moving Average Period
Defines the number of bars used by the volume moving average. Default: 20.
Show Volume Moving Average
Shows or hides the Volume MA.
Appearance
Bullish Volume Color
Color used when Close >= Open.
Bearish Volume Color
Color used when Close < Open.
Moving Average Color
Color of the Volume MA line.
Match Histogram Width to Chart Zoom
Automatically adjusts histogram width when chart zoom changes.
Histogram Width
Manual width used when automatic width is disabled.
Moving Average Line Width
Controls the thickness of the Volume MA line.
Current Value Labels
Show Current Values on the Right
Displays current Volume and Volume MA values on the right side of the indicator window.
Value Label Width
Controls label width.
Value Label Height
Controls label height.
Value Label Font Size
Controls label font size.
Important Volume Information
On Forex and many CFD instruments, MetaTrader 5 commonly receives tick volume rather than centralized exchange-traded volume.
Tick volume represents the number of price updates received during a candle.
Real-volume availability depends on the broker, symbol and market.
For general use, Auto mode is recommended. It uses real volume when available and automatically falls back to tick volume otherwise.
Important Notice
Volume Histogram with MA is an analytical visualization tool.
It does not:
- Predict future market direction
- Guarantee breakout continuation
- Provide guaranteed trading signals
- Open trades
- Modify trades
- Close trades
Historical and live volume data depend on the information supplied by the broker.