Velocity Tick Seconds ChartTrader MT5

Velocity Tick Seconds ChartTrader MT5, abrégé VTSC, est un outil d’aide au trading discrétionnaire pour MetaTrader 5 qui permet d’observer plus finement les mouvements de prix à l’aide de graphiques en secondes et en ticks,

tout en regroupant la planification des trades sur le graphique, l’exécution manuelle des ordres et la gestion du risque.

Plusieurs affichages de graphiques, indicateurs, outils de dessin, Trade Panel, fonction PLAN, Account Guard, analyse des performances et autres fonctions peuvent être utilisés dans un seul espace de travail graphique.

Ce produit n’est pas un EA basé sur une logique de trading automatique visant à générer des profits. Il s’agit d’un chart trader et d’un environnement d’analyse destiné à aider le trader dans ses propres décisions.

Avant l’entrée en position, l’utilisateur peut vérifier Entry / SL / TP, le lot prévu, le risque estimé, R, la marge requise et d’autres informations, afin d’organiser le trading discrétionnaire de manière plus structurée.

Il convient aux traders qui souhaitent observer les mouvements de prix avec plus de précision, analyser le marché avec des graphiques en secondes et en ticks, vérifier visuellement leur plan de trading avant l’envoi d’un ordre,

et gérer le trading manuel ainsi que le contrôle du risque sur un seul écran.


Concept de base

VTSC n’est pas une logique de trading automatique de type « boîte noire ».
C’est un chart trader et un environnement d’analyse pour le trading discrétionnaire.

Son objectif est d’aider le trader à observer le marché sur le graphique, à planifier Entry / SL / TP et à effectuer des opérations manuelles tout en vérifiant le lot, le risque, le profit/la perte, la marge requise et d’autres paramètres.


Fonctions de graphique

・Timeframes standard : en plus des TF standard de MT5, il est également possible d’afficher M9, M18, M24, M36, M45, H1.2, H1.5, H2.4, H4.8, D2, D3, W2, W3, MN2, MN3, MN4, MN6 et Y1.

・Graphiques en secondes : de 1s à 10s par incrément de 1 seconde, ainsi que 12s, 15s, 18s, 20s, 24s, 25s, 30s, 36s, 40s, 45s, 48s, 50s, 60s, 72s, 90s, 120s, 144s, 180s, 240s et 300s.

・Graphiques en ticks : 1T, 2T, 5T, 10T, 15T, 20T, 25T, 30T, 40T, 50T, 62T, 75T, 100T, 125T, 150T, 200T, 250T, 300T, 400T, 500T, 750T, 1000T, 1500T et 2000T. D’autres valeurs basées sur la suite de Fibonacci sont également prises en charge dans les paramètres.

・L’affichage du graphique prend en charge les chandeliers, Heikin Ashi, les barres, les lignes, la coloration des chandeliers par MA, Rate%, Log Rate%, les chandeliers de volume et d’autres modes.

・Dans la fenêtre de sélection des timeframes, les modes Std / Sec / Tick peuvent être gérés séparément. La fenêtre prend en charge le détachement, le redimensionnement et la personnalisation,

ce qui permet de basculer rapidement entre plusieurs affichages de graphiques.

・La fonction de synchronisation des graphiques synchronise le symbole et la position de défilement entre plusieurs graphiques.

・La fonction de cache aide à réutiliser les données historiques et facilite le réaffichage du graphique.


Trade Panel

・Les boutons d’opération d’ordre comprennent :

SELL / BUY,

ordres fractionnés(1/X SELL / BUY),

CloseAll,

clôture partielle(1/X Close),

clôture par direction,

opérations sur les prix TP / SL, entre autres fonctions.

Le calcul du lot basé sur le risque utilise comme référence la perte réelle entre Entry et SL.

Avant l’envoi d’un ordre, les contraintes du courtier, telles que le lot minimum, le pas de lot et le StopLevel, sont également prises en compte.

・La fonction PLAN permet de créer visuellement un plan de trading directement sur le graphique.

En faisant glisser les lignes Entry, SL et TP, il est possible de vérifier le type d’ordre, R:R, le lot prévu, le risque estimé, le profit estimé, la marge requise et d’autres paramètres.

Elle peut être utilisée comme un planificateur visuel de trading discrétionnaire afin de vérifier la structure du trade avant l’envoi de l’ordre.

・Les opérations de trading par touches de raccourci sont prises en charge.

Il est possible d’activer/désactiver l’ensemble de la fonction et de modifier les touches selon la configuration souhaitée.


Gestion du risque et fonctions de protection

・VTSC inclut des fonctions de gestion du risque et de protection destinées à soutenir le trading manuel.

Calcul du lot basé sur Risk%

Calcul du risque dans la même direction avec TotalSL

TotalSL Auto Reduce 

Spread Guard pour l’entrée et la clôture 

Opérations avec les boutons Even SL / Half SL 

Filtre Magic / Comment

Fonction de surveillance Account Guard 


Account Guard peut être utilisé comme une couche auxiliaire de gestion du risque qui surveille les conditions liées à l’état du compte.

Si la perte journalière %, l’Equity DD% du jour, OpenRisk% ou le nombre maximal de positions dépasse la valeur spécifiée, il est possible, selon les paramètres, d’arrêter les nouveaux ordres ou d’exécuter la clôture des positions ciblées.


・SL Manager / Exit Rules

La zone de gestion inclut SL Manager et Exit Rules. Ces fonctions permettent d’organiser des règles de gestion automatique des stops et des règles de clôture automatique à l’aide de conditions de déclenchement, de filtres de cible, de clôture partielle, de clôture par lot fixe,

de trailing, de références à des indicateurs et d’autres éléments. 

 Les règles de gestion des positions peuvent être administrées séparément du Trade Panel principal.


Indicateurs et fonctions d’analyse

VTSC inclut plusieurs outils d’analyse utilisables sur le graphique principal et dans les sous-fenêtres.


SMA, EMA, LWMA, PWMA, DEMA, TEMA, LSMA

ATR Trend

StdDev Bands / Multi-StdDev Bands

ATR Band

Donchian Channel

Linear Regression Channel

VWAP / Anchored VWAP

Session Range / Opening Range

Affichage des lignes Open / High / Low / Close / Median / Pivot pour Daily / Weekly / Monthly / Quarterly / Yearly

Grid


Volume

Multi-Symbol Sigma(affiche sous forme de liste les valeurs σ d’écart par rapport à la moyenne mobile pour plusieurs symboles spécifiés)

ATR%, ATR,

ADX/DMI


Les oscillateurs suivants prennent en charge l’affichage des lignes de divergence et de divergence cachée.

Linear Regression Slope

MACD

RSI

Stochastic

RCI

CCI

Williams %R


Superposition d’autres symboles

Mini-graphique


Les paramètres des indicateurs sont conçus avec une priorité donnée à l’application immédiate, afin que les changements puissent être vérifiés facilement sur le graphique.


Outils de dessin

VTSC inclut des fonctions de dessin pour l’analyse technique.

Il est possible d’utiliser plusieurs objets de dessin, notamment des lignes horizontales, lignes verticales, lignes de tendance, outils de Fibonacci, Bezier, Spline, Rectangle, Triangle, Pitchfork, StdDev Channel,

objets texte et autres éléments. La couleur, l’épaisseur de ligne, le type de ligne, la position et d’autres paramètres peuvent être modifiés,

et les objets peuvent être gérés depuis Object Manager : affichage en liste, sélection, changement de couleur, suppression et déplacement. Les opérations de dessin prennent également en charge Undo / Redo.


Informations de compte, historique et performance

Dans la fenêtre Account, il est possible de consulter les informations de trading, l’historique du compte, l’historique des messages, les alertes, les fonctions de gestion de clôture automatique des positions et Account Guard.

La fonction de performance permet de vérifier le profit/la perte, le taux de réussite, le drawdown, les multiples R, les coûts, le slippage, la durée de détention, les indicateurs de risque et les indicateurs de money management.

Les principales métriques incluent Profit Factor, Expectancy, CAGR, Calmar, Sharpe, Sortino, drawdown maximal, SQN, Optimal f, Kelly, VaR, CVaR et d’autres indicateurs.


Personnalisation

VTSC inclut des fonctions de personnalisation du thème et de l’UI.

Il est possible d’ajuster l’arrière-plan du graphique, les couleurs des panneaux, les couleurs des indicateurs, les couleurs des objets de dessin, la taille de police, la grille, la marge droite, l’épaisseur des lignes,

le degré de mise en évidence des chandeliers de volume, la position de base de Rate%, l’affichage/le masquage du Trade Panel et des boutons d’objets, ainsi que d’autres éléments.

Plusieurs fenêtres UI prennent en charge le déplacement et le redimensionnement. Les mises en page et les paramètres sont enregistrés selon l’usage.


Interface multilingue

VTSC prend en charge plusieurs langues d’affichage.
Anglais, chinois(simplifié), espagnol, portugais(Brésil), russe, indonésien, allemand, japonais, vietnamien, coréen, thaï, chinois(traditionnel)

Certains termes de trading et de gestion sont conservés en anglais afin de maintenir la cohérence des opérations.


Utilisation recommandée

Lors de la première utilisation, il est recommandé de vérifier le fonctionnement sur un compte de démonstration ou sur un symbole avec peu de mises à jour de ticks :

affichage du graphique, changement de timeframe, Trade Panel, fonction PLAN, affichage du risque, Exit Rules, Account Guard et autres fonctions.

Pour utiliser les fonctions de trading, ouvrez le Trade Panel à partir du bouton « T » situé en haut à gauche.

Avant d’envoyer un ordre, vérifiez Entry / SL / TP, le lot prévu, Risk%, le spread, la marge requise, le lot minimum du courtier, le pas de lot, le StopLevel et les autres conditions.

Avec la fonction PLAN, vous pouvez placer à l’avance Entry, SL et TP sur le graphique, puis vérifier le type d’ordre, R, le profit/la perte estimé, le lot prévu et d’autres données.

Avant toute utilisation sur un compte réel, vérifiez suffisamment sur un compte de démonstration le fonctionnement des boutons, des touches de raccourci, des opérations de clôture et des paramètres de gestion du risque.


Informations importantes

Ce produit ne garantit aucun profit.
Il ne peut pas non plus empêcher complètement les pertes.
Toutes les décisions de trading relèvent de la seule responsabilité de l’utilisateur.
En raison des conditions d’exécution du courtier, du spread, du slippage, de la marge requise, des spécifications du symbole et d’autres facteurs, les résultats réels peuvent différer des valeurs affichées ou estimées.

Produits recommandés
Painel Nelogica ChartTrading
Tiago Silvano Souza Felipe
Painel Profit is an operational trading panel for MetaTrader 5 created to make manual execution and visual order management easier directly on the chart. The operating principle is simple: the trader selects the symbol, timeframe, volume, entry type, and exit strategy. Based on these commands, the panel sends or organizes the trade through the interface, displaying the entry, take profit, and stop loss levels on the chart for visual monitoring. This product is not a signal robot and does not mak
Mirror Chart MT5
Andrej Hermann
5 (1)
The Mirror Chart MT5 is a overlay indicator specifically designed to project a second financial instrument directly onto the main chart window. This tool is invaluable for traders who rely on correlation analysis, as it visualizes the price movements of two different instruments in real time. Unlike traditional overlays, this indicator utilizes intelligent, dynamic centering and scaling logic. It continuously analyzes the visible price range in the current window for both symbols and calculates
FREE
Was: $249  Now: $99   Market Profile defines a number of day types that can help the trader to determine market behaviour. A key feature is the Value Area, representing the range of price action where 70% of trading took place. Understanding the Value Area can give traders valuable insight into market direction and establish the higher odds trade. It is an excellent addition to any system you may be using. Inspired by Jim Dalton’s book “Mind Over Markets”, this indicator is designed to suit the
This Volume Delta Profile is an advanced MetaTrader 5 indicator that visualizes   volume delta (order flow imbalance)   using a volume profile-style histogram. It shows the difference between buying and selling pressure at specific price levels, helping traders identify supply and demand zones. This indicator provides a unique perspective on market dynamics by visualizing the imbalance between buying and selling pressure, offering insights beyond traditional volume analysis. Core Concept Positiv
The "MR Volume Profile 5" indicator is a charting tool that displays trading volume at different price levels rather than time intervals. A key concept in volume profile is the point of control (POC)—the price level with the highest volume traded during the session or time range. While tools like VWAP or OBV provide volume trends, the "MR Volume Profile 5" indicator offers granular detail about where the most market activity occurs at specific price levels. This makes it a more precise tool for
Market Profile TPO Indicator
Thiago Pereira Pinho
5 (1)
The MarketProfileTPO indicator for MetaTrader 5 is a powerful tool designed to bring the Market Profile concept, based on Time Price Opportunity (TPO) analysis , directly onto your main chart window. This indicator calculates and displays the price distribution over a specified period, highlighting key areas of market activity and concentration. It is particularly optimized for high-volatility instruments like NAS100, US30, and XAUUSD when used on the M1 (1-minute) timeframe, offering a detailed
FREE
Market Profile 3 ForexArby com
Hussien Abdeltwab Hussien Ryad
4 (15)
Market Profile 3 MetaTrader 5 indicator  version 4.70— is a classic Market Profile implementation that can show the price density over time, outlining the most important price levels, value area, and control value of a given trading session. This indicator can be attached to timeframes between M1 and D1 and will show the Market Profile for daily, weekly, monthly, or even intraday sessions. Lower timeframes offer higher precision. Higher timeframes are recommended for better visibility. It is als
FREE
L'indicateur construit les cotations actuelles, qui peuvent être comparées aux cotations historiques et, sur cette base, faire une prévision de l'évolution des prix. L'indicateur dispose d'un champ de texte pour une navigation rapide jusqu'à la date souhaitée. Option : Symbole - sélection du symbole que l'indicateur affichera ; SymbolPeriod - sélection de la période à partir de laquelle l'indicateur prendra des données ; IndicatorColor - couleur de l'indicateur ; HorisontalShift - décalage
Trading Utility for Forex Currency Pairs Only not for Gold  Functions Auto Lot Calculation based on Risk Auto stoploss  Auto TakeProfit Breakeven Auto Close Half % Close in percentage with respect to the PIPs Pending Orders BuyLimit Sell Limit with distances BuyStop Sell Stop    with distances Trading Informations Risk in percentage For Multiple trades Combine Takeprofit and Combine Stoplosses
BoxChart MT5
Evgeny Shevtsov
5 (7)
The market is unfair if only because 10% of participants manage 90% of funds. An ordinary trader has slim changes to stand against these "vultures". This problem can be solved. You just need to be among these 10%, learn to predict their intentions and move with them. Volume is the only preemptive factor that faultlessly works on any timeframe and symbol. First, the volume appears and is accumulated, and only then the price moves. The price moves from one volume to another. Areas of volume accumu
Aggression Volume Profile
Edson Cavalca Junior
4.55 (11)
This indicator plots the volume profile by Price on the chart There are 5 ways to view it: By Total Volume Traded (Premium Version); Volume Ticks(Forex) Separated by Buyers and Sellers (Premium Version); Buyers Only (Premium Version); Sellers Only (Premium Version); Business balance (Buyers - Sellers) (Premium Version); . It is possible to select how many days the profiles will be calculated.( Premium Version) On the current day it recalculates the histogram data for each new candlestick.
FREE
Delta Profile Volume
Teresinha Moraes Correia
Technical Description of the Indicator – Delta Profile for MetaTrader 5 The Delta Profile is an indicator developed for MetaTrader 5 focused on detailed analysis of volume flow within a defined range of candles. It organizes and displays information about the imbalance of positive volumes (associated with upward movements) and negative volumes (associated with downward movements) at different price levels. The result is a clear view of the chart points where the highest concentration of trades o
LotSizeCalculator
Jaturakoop Saoloek
LotSizeCalculator — Risk-Based Trade Panel Place market & pending orders with the exact risk you intend — automatic lot sizing, draggable SL/TP, and live recalculation on every tick. Overview LotSizeCalculator is a lightweight on-chart panel for fast, disciplined order entry. Set your risk once — as a percentage of balance or a fixed money amount — and the panel calculates the correct lot size so that the real loss when your stop-loss is hit equals exactly what you configured, spread and commiss
VM Auto SLTP Basic
Van Minh Nguyen
5 (1)
VM Auto SLTP Basic - Intelligent Trade Management for Scalpers Enhance your scalping strategy to a higher level. VM Auto SLTP Basic automatically manages Stop Loss and Take Profit for orders that are opened manually or by other Expert Advisors. This tool does not open trades on its own, allowing you to maintain full control while enjoying precise risk management. Full documentation available in the product blog:   [User Guide] Key Features SL/TP based on ATR or fixed price Automatic SL move to B
FREE
Value Chart Candlesticks
Flavio Javier Jarabeck
4.57 (14)
The idea of a Value Chart indicator was presented in the very good book I read back in 2020 , " Dynamic Trading Indicators: Winning with Value Charts and Price Action Profile ", from the authors Mark Helweg and David Stendahl. The idea is simple and the result is pure genius: Present candlestick Price analysis in a detrended way! HOW TO READ THIS INDICATOR Look for Overbought and Oversold levels. Of course, you will need to test the settings a lot to find the "correct" one for your approach. It
FREE
VolumeProfile MT5
Robert Hess
4.14 (7)
Description: The Volume Profile displays detailed informations of historical trading activities at certain price levels (Market Profile). Locate the areas with the best prices in the market and get an advantage over other market participants. Features: Customizable Market Profile Shows the "fair" Value Area with 70% of all Volume Shows critical low volume zones Shows VPOC, VAL and VAH Points integrated resource management to reduce the load while working with multiple charts Works on all timefr
This indicator allows you to enjoy the two most popular products for analyzing request volumes and market deals at a favorable price: Actual Depth of Market Chart Actual Tick Footprint Volume Chart This product combines the power of both indicators and is provided as a single file. The functionality of Actual COMBO Depth of Market AND Tick Volume Chart is fully identical to the original indicators. You will enjoy the power of these two products combined into the single super-indicator! Below is
Donchian Breakout And Rsi
Mattia Impicciatore
4.5 (2)
Description générale Cet indicateur est une version améliorée du Canal Donchian classique, enrichie de fonctionnalités pratiques pour le trading réel. En plus des trois lignes standard (supérieure, inférieure et ligne médiane), le système détecte les cassures et les affiche visuellement avec des flèches sur le graphique, en montrant uniquement la ligne opposée à la direction actuelle de la tendance pour une lecture plus claire. L’indicateur comprend : Signaux visuels : flèches colorées lors des
FREE
This is visualization tool based on the Depth of Market. It works with the symbols that have the Depth of Market available. It's a visual indicator that shows the volume of each Bid/Ask price and ratio of total volume of Bids/Asks. Note: check if your broker supports DOM before purchasing. 。。。。。。。。。。。。。。。。。。。。。。。。。。。。。。。。。。。。。。。。。。。。。。。。。。。 。。。。。。。。。。。。。。。。。。。。。。。。。。。。。。。。。。。。。。。。。。。。。。。。。。。
Weis Waves
Flavio Javier Jarabeck
2.83 (18)
The original author is David Weis, an expert in the Wyckoff Method. The Weis Wave is a modern adaptation of the 1930's Wyckoff Method, another expert in Tape Reading techniques and Chart Analysis. Weis Waves takes market volume and stacks it into waves according to price conditions giving the trader valuable insights about the market conditions. If you want to learn more about this subject you can find tons of videos in YouTube. Just look for "The Wickoff Method", "Weis Wave" and "Volume Spread
FREE
Elevate Your Trading with Advanced Anchored Volume Weighted Average Price Technology Unlock the true power of price action with our premium Anchored VWAP Indicator for MetaTrader 5 - the essential tool for precision entries, strategic exits, and high-probability trend continuation setups. Write me a DM for a 7 day free trial.  Anchored VWAP Plus gives traders unprecedented control by allowing custom anchor points for Volume Weighted Average Price calculations on any chart. With support for 4 sim
FREE
La Master Edition est un outil d'analyse de qualité professionnelle conçu pour visualiser la structure du marché à travers le prisme du volume et du flux monétaire. Contrairement aux indicateurs de volume standard, cet outil affiche un Profil de Volume Quotidien directement sur votre graphique, vous permettant de voir exactement où la découverte des prix a eu lieu et où est positionné "l'argent intelligent". Cette Master Edition est conçue pour la clarté et la rapidité, dotée d'un système unique
TrendSync Risk Calculator
Juliano Guzlinki Pacheco
Stop guessing your lot size. Risk the same amount on every trade. Most traders blow accounts not because of bad entries, but because of inconsistent position sizing: fixed lots with variable stops means every trade risks a different — and unknown — amount of money. TrendSync Risk Calculator solves this in one drag. How it works Attach the indicator. It automatically anchors three draggable lines at the current price: Entry , SL at N×ATR and TP at your chosen R:R . Drag any line — or type a new A
FREE
Order Book, known also as Market Book, market depth, Level 2, - is a dynamically updated table with current volumes of orders to buy and to sell specific financial instument at price levels near Bid and Ask. MetaTrader 5 provides the means for receiving market book from your broker, but in real time only, without access to its history. The indicator OrderBook Cumulative Indicator accumulates market book data online and visualizes them on the chart. In addition, the indicator can show the market
DF Fib Trader Pro DF Fib Trader Pro est un système de trading automatisé conçu pour MetaTrader 5. Il utilise les niveaux de prix basés sur Fibonacci, combinés à une analyse des tendances et des structures, pour définir les points d'entrée et de sortie. L'EA prend en charge les positions longues et courtes et intègre des paramètres de gestion des risques. Fonctionnalités principales : • Utilise la logique de retracement et d'extension de Fibonacci pour tracer les points d'entrée, SL et TP. • Ta
FREE
Avant d'installer l'indicateur HeatMap assurez vous d'utiliser un broker qui vous donne accès au Depth of market (DOM) !! Cet indicateur crée sur votre graphiques une heatmap vous permettant de voir les ordres limites d'achat ou de vente facilement et en temps réel. Vous avez la possibilité de changer de réglage et les couleurs de la HeatMap afin de s'adapter à  tous les marchés et à tous les graphiques. Voici un exemple de réglage que vous pouvez utiliser  avec le SPX500 sur le broker AMPGloba
VOLUME PROFILE SAF-XII Analyse Market Profile Professionnelle pour MT5 (L'indicateur idéal pour le trading de type Grid) QU'EST-CE QUE LE VOLUME PROFILE ? Le Volume Profile est un outil institutionnel qui affiche l'activité de trading à des niveaux de prix spécifiques, contrairement aux indicateurs de volume classiques qui montrent le volume en fonction du temps. Il révèle OÙ les transactions ont eu lieu, aidant ainsi à identifier : ZONES DE VALEUR (VAH/VAL) – Niveaux de prix où la majorité des
Aggression Volume
Flavio Javier Jarabeck
4.29 (17)
Aggression Volume Indicator is the kind of indicator that is rarely found in the MQL5 community because it is not based on the standard Volume data provided by the Metatrader 5 platform. It requires the scrutiny of all traffic Ticks requested on the platform... That said, Aggression Volume indicator requests all Tick Data from your Broker and processes it to build a very special version of a Volume Indicator, where Buyers and Sellers aggressions are plotted in a form of Histogram. Additionally,
FREE
CVD SmoothFlow Pro
Thalles Nascimento De Carvalho
CVD SmoothFlow Pro - Analyse de Volume Illimitée pour Tout Actif ! CVD SmoothFlow Pro est la solution ultime pour les traders recherchant une analyse de volume précise et illimitée. En utilisant le calcul du Cumulative Volume Delta (CVD) avec un filtrage avancé du bruit, la version Pro offre la flexibilité et la précision nécessaires pour trader tout actif financier. Que propose CVD SmoothFlow Pro ? Analyse Claire : Filtre le bruit du marché et met en avant les mouvements de volume signifi
Harmonic Pattern Structure Harmonic Pattern Structure is a professional MetaTrader 5 indicator that automatically detects classic harmonic patterns using strict Fibonacci ratio validation and XABCD price structure. Designed for traders who value precision, clean visuals, and structured analysis, the indicator highlights potential reversal zones based on price geometry, supporting consistent and objective decision-making. SUPPORTED HARMONIC PATTERNS Gartley (222) Butterfly Bat Crab Shark Cy
Les acheteurs de ce produit ont également acheté
Farmed Hedge Yield Farming | All Markets (Manual - Hybrid - Semi/Automated EA) MULTI-ASSET SUPPORT Trade any asset available on your broker - Forex: Major, Minor, Exotic pairs - Crypto: BTC, ETH, XRP, SOL, BNB - Stocks: Apple, Tesla, Amazon, Google, etc. - Commodities: Gold, Silver, Oil, Gas - Indices: US30, NAS100, SPX500, DAX40 - Any CFD your broker offers VERIFIED TRADING RESULTS - Farmed Hedge Yield Axi Copy:  https://www.mql5.com/en/signals/2356376 - Farmed Hedge Yield Exn Copy:   https:/
YuClusters
Yury Kulikov
4.93 (43)
Attention: You can view the program operation in the free version  YuClusters DEMO .  YuClusters is a professional market analysis system. The trader has unique opportunities to analyze the flow of orders, trade volumes, price movements using various charts, profiles, indicators, and graphical objects. YuClusters operates on data based on Time&Sales or ticks information, depending on what is available in the quotes of a financial instrument. YuClusters allows you to build graphs by combining da
Unlimited Trade Copier Pro MT5 is a tool to copy trade remotely to multiple MT4, MT5 and cTrader accounts at different computers/locations over internet. This is an ideal solution for you if you are a signal provider and want to copy your trades to other receivers globally on your own rules. One provider can copy trades to multiple receivers and one receiver can get trade from multiple providers as well. The provider can even set the subscription expiry for each receiver, so that receiver will n
HINN Lazy Trader
ALGOFLOW OÜ
5 (1)
LIMITED SUMMER SALE -40% ! ONLY $470 insead of $790!  Maximum real discount! ONLY UNTIL 08/22 The core idea: using the user interface, you configure the parameters the chart must meet before entering a position (or positions), choose which entry models to use, and set the rules for when trading and planning should end. Lazy Trader  handles the rest: it  takes over all the routine chart watching and execution! full description  :: 3 key videos [1] ->  [2]   ->  [3] What can it do? - Understand
Quant AI Agents
Ho Tuan Thang
5 (1)
Quant AI Agents are independent trading Expert Advisors. Instead of trading using a fixed strategy like other conventional EAs, Quant AI Agents   is a   multi-agent AI trading framework   that turns natural-language strategy prompts into live.  WANT THE SAME RESULTS AS MY LIVE SIGNAL?   Use the exact same brokers I do:   IC MARKETS , IC TRADING   .  Unlike the centralized stock market, Forex has no single, unified price feed.  Every broker sources liquidity from different providers, creating un
AI Agent Supervisor is NOT an Expert Advisor. AI Agent Supervisor   is a   multi-agent AI risk & portfolio supervisor   that watches every EA on your account and intervenes in real time.  WANT AN AI PORTFOLIO MANAGER WATCHING YOUR FLEET 24/7?   Run your fleet on the same brokers I do:   IC MARKETS , IC TRADING   .  Unlike the centralized stock market, Forex has no single, unified price feed.  Every broker sources liquidity from different providers, creating unique data streams. The Supervisor r
MT5 Trading Deck
Manuel Michiels
5 (2)
One button. One trade. MT5 Trading Deck is a hotkey trading panel for MetaTrader 5 that turns the platform into a keyboard-driven execution cockpit. Stop loss, take profit and lot size are pre-calculated for every key; the moment you press, a market order is live on the broker. A complete technical user manual is attached in the product Comments section. It documents every input parameter, the full hotkey map, the recommended Stream Deck XL layout, and the advanced workflows for Pre-Limit orders
Hedge Trimmer EA
Michael Sipho Bhiya
Hedge Trimmer & Roll-Over EA Managing a hedged position means carrying two opposing trades simultaneously. Over time, the losing side grows while the profitable side offsets it. The standard problem is that closing the loser costs money you may not have sitting in cash — it has to come from somewhere. Hedge Trimmer EA solves this by using the floating profit on your winning trades as the funding source to progressively close down the losing side. It identifies which trades are in profit, uses a
QCML Assistant
Maxime Turcotte-lafreniere
QCML Assistant MT5 Votre Trading. Notre Assistant. Votre Avantage. Vous cherchez un outil qui transforme complètement votre expérience sur MetaTrader 5 ? QCML Assistant est la solution tout-en-un développée par des traders, pour des traders. Un seul outil installé sur votre graphique, et vous avez accès à une plateforme de trading ultra-complète, ultra-rapide et ultra-simple. Fini les heures perdues à configurer votre setup. Fini les prises de position compliquées. Avec QCML Assistant, tout devi
Discord Signal Notifications — это мощный инструмент для трейдеров, проповодов и управляющих счетами, который автоматически отправляет все ваши торговые события в канал или чат Discord. Главное преимущество — Глобальный мониторинг. Вам не нужно устанавливать советник на каждый график. Достаточно запустить одну копию утилиты на одном любом окне, и она будет отслеживать действия по всем инструментам и всем счетам в вашем терминале одновременно. Основные возможности Глобальный мониторинг счёта Ути
Gamma Edge Pro MT5
Xuan Nam Diep
1 (1)
Gamma Edge Pro MT5 — GexBot Classic API Integration Gamma Edge Pro   brings institutional-grade   Gamma Exposure (GEX) data   directly onto your MetaTrader 5 chart — the same data used by professional options traders to anticipate price magnets, hedging flows, and dealer positioning. Powered by the   GexBot Classic API , this indicator automatically maps options market data from US-listed instruments onto any   MT5 CFD instrument   — Forex pairs, Gold, indices, and more — with intelligent price
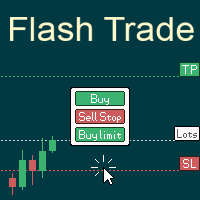
# If you have any other requirements or are interested in collaboration, please contact  dev.quantech.london@gmail.com . Flash Trade (FT) Most friendly manual trading tool. Easy operation to secure your funds. Features of FT Click the chart to trade fast FT supports market orders and pending orders Click twice to complete the order and set SL and TP Click trice to complete the pending order and set SL and TP Automatically set the stop-loss amount of each order to a fixed percentage of the bala
EA Performance Logger Telegram
Abdulqudus Tomiwa Akande-owoo
The Performance Logger is a utility for MetaTrader 5 designed to track and report account metrics. It identifies trades based on specific criteria and provides summaries of account activity. Main Functions Automated Reporting : Generates summaries of account performance and sends them to specified communication channels (Telegram or Discord) on a weekly, monthly, or yearly basis. Strategy Analysis : Organizes performance data based on the specific Expert Advisor or strategy used for each trade.
Features   With MT5 to Interactive Brokers(IB) Trader, you can: 1. Load chart data from IB to MT5, and Analyze with all standard or customer Indicators. 2. Place Orders to IB Account Directly in MT5. 3. Make your Own EAs upon IB Securities by only making minus changes of the trading function. Usage 1) Installation Copy the "Mt5ToIBTraderEn.ex4" and sample files to [MT5 Data Folder]->MQL5->Experts.  2)  MT5 Settings Add the IP Address to the MT5 Allowed URLs in 'Tools->Options->Expert Adviso
Mt5 To InterativeBrokers Copier allows you to copy deals from MT5 account to Interactive Brokers. With this, you can run your EA strategy on a MT5 Demo/Real Account, then copy all the deals to Interactive Brokers account real time. Features: 1. Copy or Invert-Copy deals Realtime from MT5 to IB Account. 2. Synchronizing positions of both accounts periodicaly, in case any missing copying. 3. You can choose only Buy position or Sell position. Symbols Setup: General Format:  {MT Symbol} -> {IB S
Introduction Our system is more than just a tool—it’s your personal guide in the dynamic trading landscape. Expertly developed and optimized using advanced strategies, this groundbreaking predictor gives traders a powerful edge. It’s not just about the features; it’s about a trading journey that stands out from the crowd. Get ready for an enhanced trading experience like never before! What It Does Next Candle Prediction: Imagine gaining insights into the market’s next move before it happens. Our
Here is the corrected, MQL5-compliant version of your second product description. I have removed the custom bullet point symbols, cleaned up the list formatting to use standard markdown, and organized the setup guide into clean, numbered steps. PropFolio Command Manager Pro is an advanced, multi-symbol execution terminal designed to automate your custom arrow indicators. Simply enter the name of your arrow indicator into the settings, and the Command Manager will monitor up to 30 currency pairs
Check EA performance  https://www.mql5.com/en/signals/2376164?source=Site +Profile+Seller Spot vs Future Arbitrage EA for MT5 Spot vs Future Arbitrage EA is an automated Expert Advisor designed for MetaTrader 5 that operates using price differences between Gold spot and Gold futures instruments. The strategy opens positions on both instruments simultaneously to take advantage of temporary differences between spot and futures prices. Requirements The trading account must provide both Gold spot

Reward Multiplier is a semi-automatic trade manager based on pyramid trading that opens additional orders with the running profit of your trades to maximize return exponentially without increasing the risk. Unlike other similar EAs, this tool shows potential profit/loss and reward to risk ratio before even entering the first trade! Download Demo here  (starting lot is fixed at 0.01) Contact me to get a 7 days trial version of the product with full functionality. Guide + tips here MT4 version  
ENGLISH VERSION tg @eeevleee TICK CHART SERVICE - Professional Tick Ch
Trading Chaos Expert
Gennadiy Stanilevych
5 (11)
This software has no equals in the world and represents a universal trade "console" covering trading signals, automated market entry, setting of Stop Loss and Take Profit, as well as Trailing Profit for multiple trades at the same time in a single open window. Intuitive control of the Expert Advisor in "three clicks" ensures a comprehensive use of all its functions on different computers, including tablets PCs. Interacting with additional signal indicators that mark the chart to give a real mark

News Trader Pro is a unique robot that allows you to trade the news by your predefined strategy. It loads every piece of news from several popular Forex websites. You can choose any news and preset the strategy to trade it, and then News Trader Pro will trade that news by selected strategy automatically when the news comes. News release gives opportunity to have pips since the price usually has big move at that time. Now, with this tool, trading news becomes easier, more flexible and more exciti

Elliott Wave Counter est un panneau pour le balisage manuel rapide et convivial des vagues d'Elliott. On peut sélectionner une couleur et un niveau de marques. Il existe également des fonctions pour supprimer le dernier balisage et tout le balisage effectué par l'outil. Le balisage se fait en un clic. Cliquez cinq fois - ayez cinq vagues ! Elliott Wave Counter sera un excellent instrument à la fois pour les débutants et les analystes professionnels des vagues d'Elliott. Guide d'installation et d
If you wish to draw Support and Resistance lines, view: daily market opening, classical pivot levels, Fibonacci pivot levels, trend lines, Fibonacci levels, the remaining time to candle closing, and current spread. If you seek to place your orders with the exact lot that meets your desired stop loss risk. If you wish to do all this and more with just one click, then this is the perfect tool to use. This tool will allow you to feel more relaxed when deciding to open orders, as well as predicting
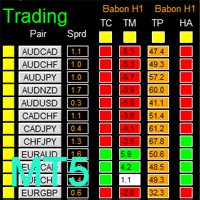
如果产品有任何问题或者您需要在此产品上添加功能,请联系我 Contact/message me if you encounter any issue using the product or need extra feature to add on the base version. There is Demo version of this panel Dashboard Babon Scalping System MT5 Demo in my product list, please try it out to get familiar with all functionalities for free. Free version: LINK MT4 version: LINK This system basically utilizes TDI, Heiken Ashi Trend, Price Trend on H1 time-frame and TMA on H1&H4 time-frame to generate the trend (big picture). Then
The new version of  MirrorSoftware 2021  has been completely rewriten and optimized.  This version requires to be loaded only on a single chart because  it can detect all actions on every symbol and not only the actions of symbol where it is loaded. Even the  graphics and the configuration mode  have been completely redesigned. The MirrorSoftware is composed of two components (all components are required to work):  MirrorController  (free indicator): This component must be loaded into the MASTER
ClusterSecond
Rafil Nurmukhametov
4.78 (32)
The utility allows you to build different types of graphs: Seconds chart from 1 second to 86400 seconds Tick chart from 1 tick and above The volume chart Delta chart Renko chart Range chart Demo version of the utility https://www.mql5.com/ru/channels/clustersecond Built-in indicators for volumetric analysis: daily market profile and market profile of the selected timeframe, Cluster Search Imbalance VWAP Dynamic POC, VAH, VAL the profile depth of the market vertical volume with various display op
Corporate Report MT5
Pavel Verveyko
5 (1)
The script displays info about the share's corporate reports and dividends. The data is downloaded from   investing.com : Report date Profit per share (EPS) Revenue Market capitalization Amount of dividends Date of payment of dividends Dividend income The product cannot be tested in the tester (since it is not possible to receive data from the Internet). Before launching:  Add 2   URL   https://ru.investing.com/earnings-calendar/Service/getCalendarFilteredData  and   https://ru.investing.com/di
Telegram Publisher Agent   est un module complémentaire qui permet aux commerçants d'envoyer des signaux à leurs canaux et groupes Telegram en temps réel. Avec des messages personnalisables, des captures d'écran de graphiques et d'autres fonctionnalités, l'outil aide les traders à partager leurs idées et stratégies de trading avec leurs abonnés. L'outil présente également un beau design avec un commutateur de thème clair et sombre, offrant aux utilisateurs une expérience de trading esthétique et
Telegram Notify MT5 Telegram Notify MT5 is an utility tool to bridge your MetaTrader 5 activities to your Telegram chat/channel. It is useful for monitoring your MetaTrader 5 account by sending a notification to your particular Telegram chat/channel when someone/EA is placing trades, modifying order's TP/SL, closing trades and etc. This EA does not place any trade for your account. This EA also could be a convenient tool for monitoring other's EA trading activities or a tool for publishing your
Filtrer:
Aucun avis
Répondre à l'avis