Pro Seconds Chart
- Indicateurs
- Version: 1.41
- Mise à jour: 10 octobre 2026
- Activations: 10

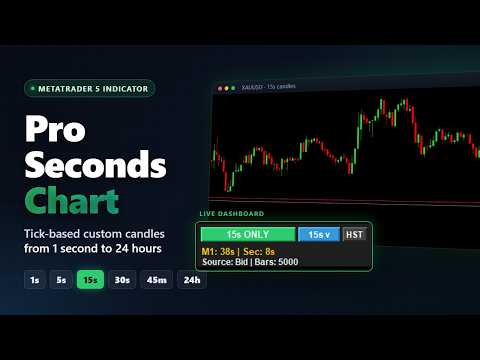
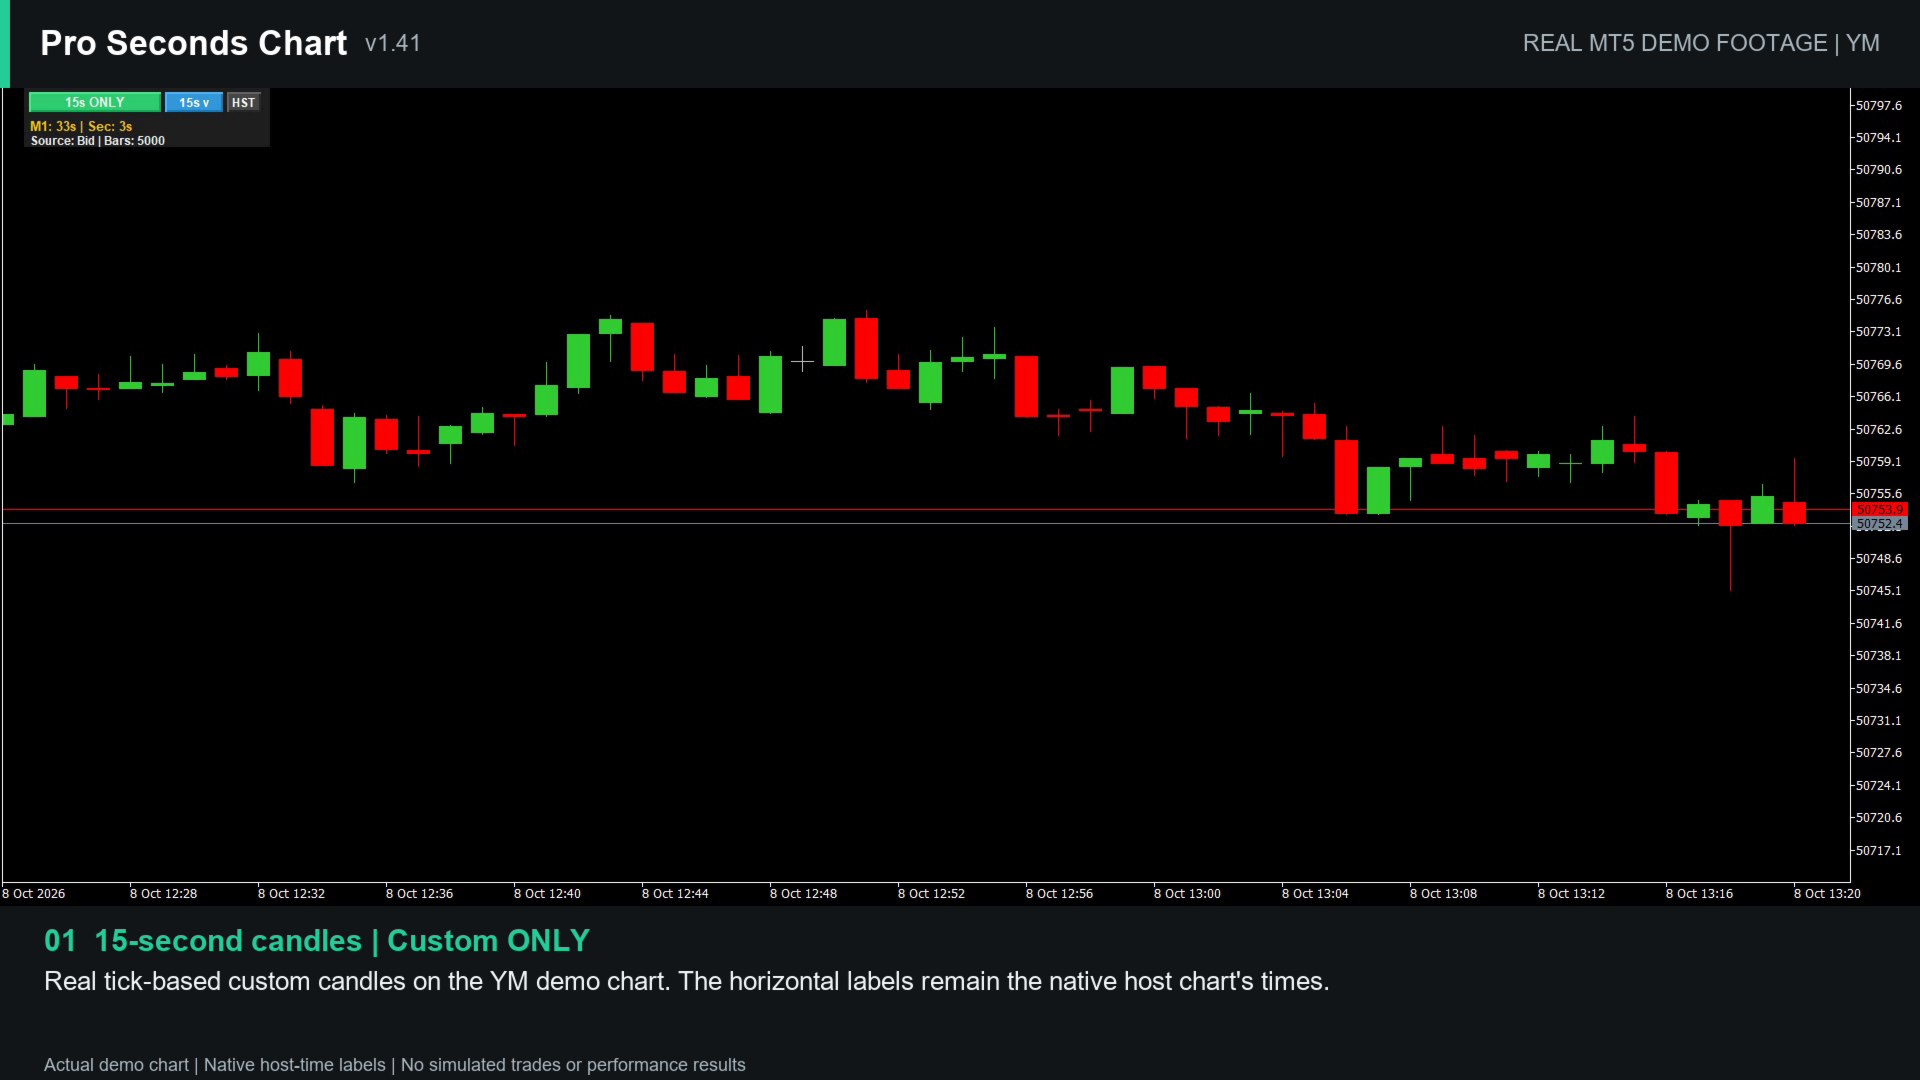
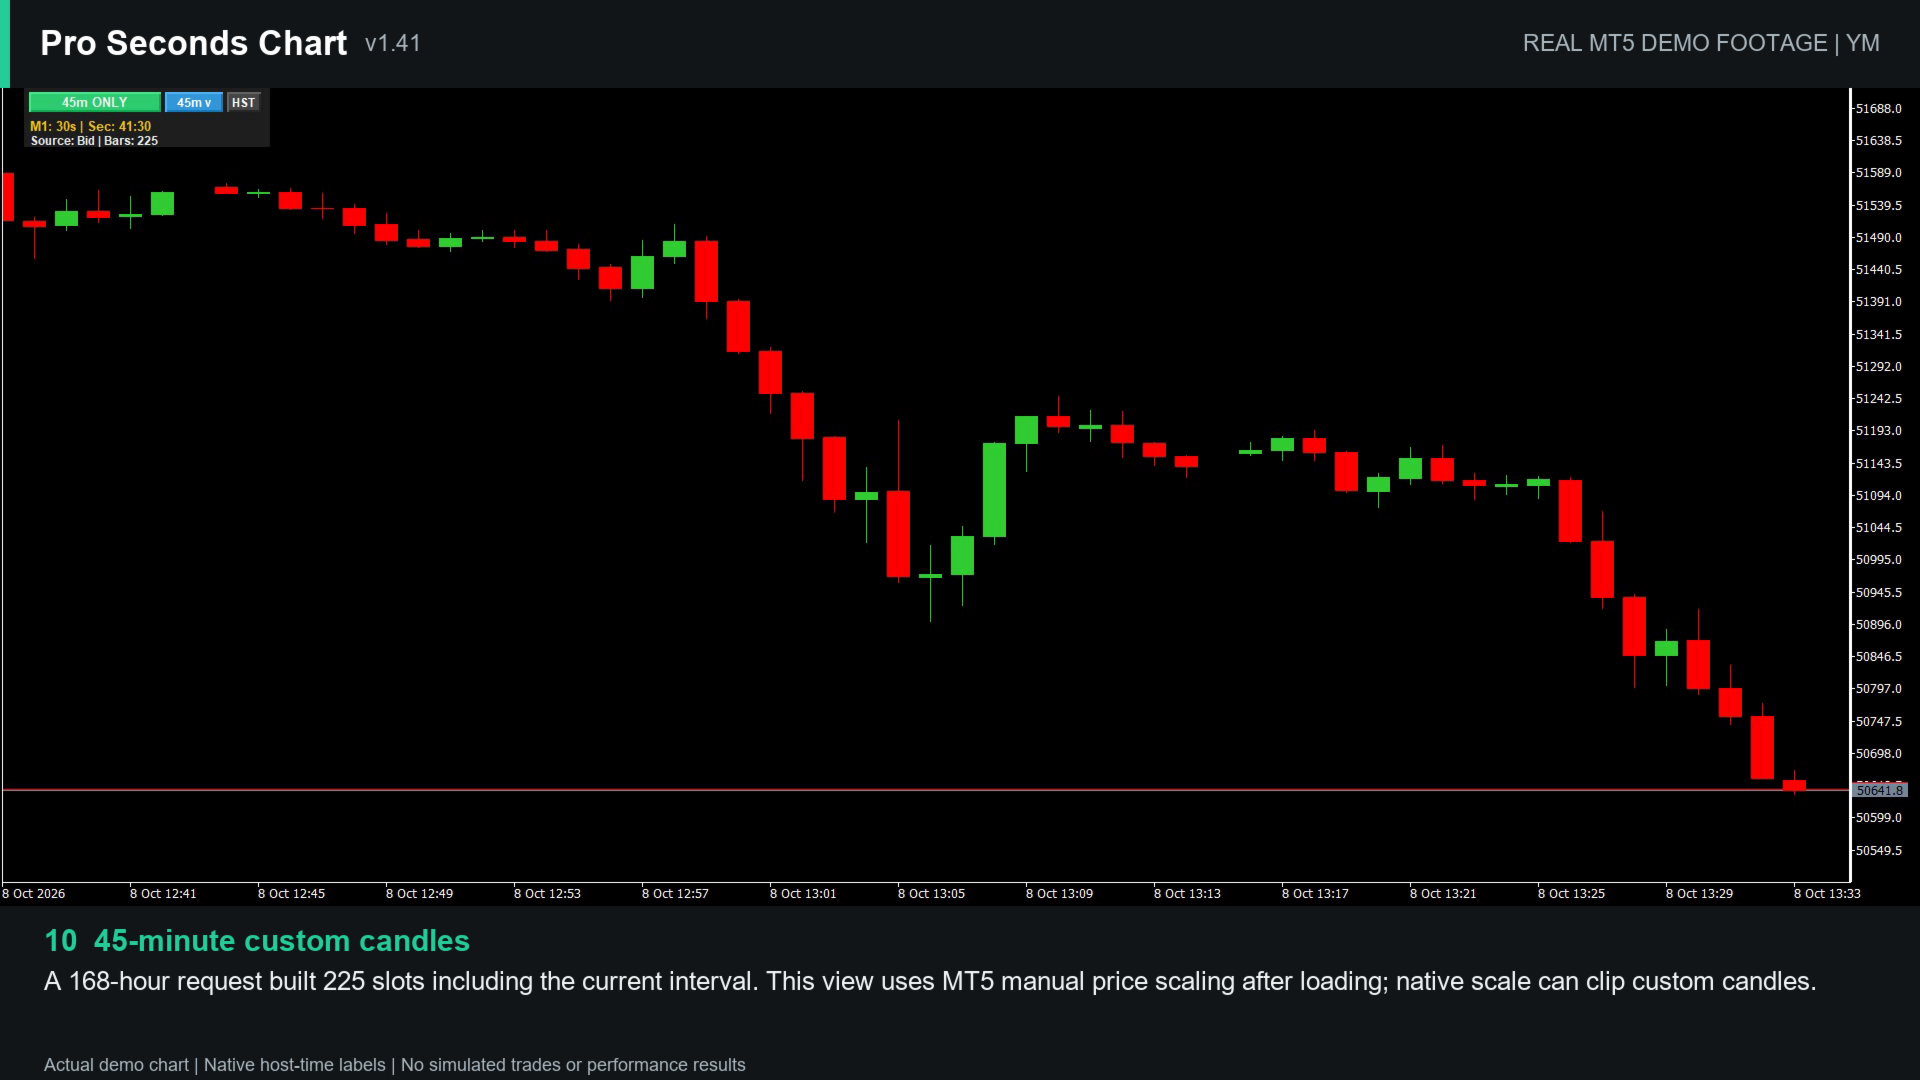
Pro Seconds Chart brings seconds charts to MetaTrader 5. It builds custom candles from real tick data directly on your current chart, so you can follow price action below the 1-minute timeframe or on any custom interval from 1 second up to 24 hours, such as 7s, 45m or 90m.
There is no offline chart or custom symbol to manage. Attach the indicator to an M1 chart, choose an interval from the on-chart dashboard and keep working on the same chart.
It is intended for traders who want a closer view of short-term price movement, and for traders who work with non-standard intervals that MetaTrader 5 does not offer.
Main features
- Candles built from MT5 tick data, using Bid, Ask, Mid or Last price
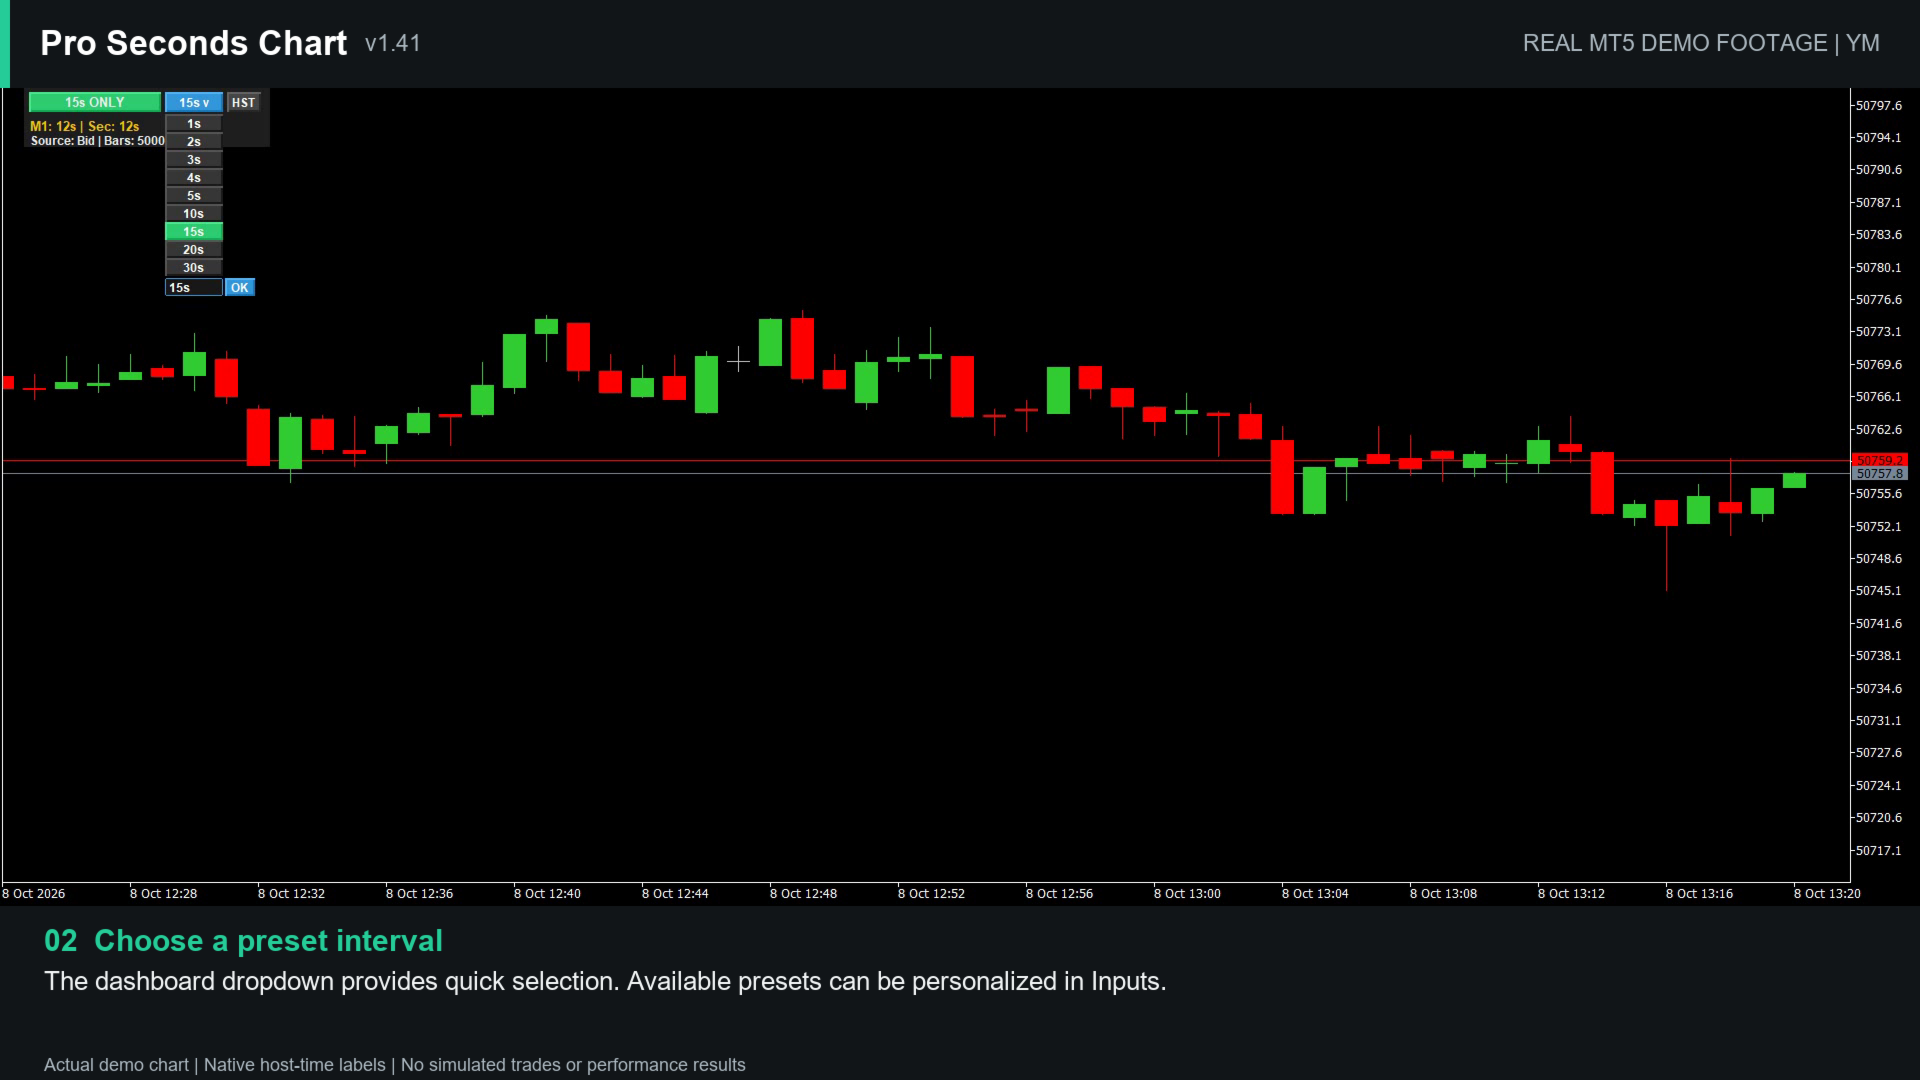
- One-click interval presets on the dashboard, editable in the inputs
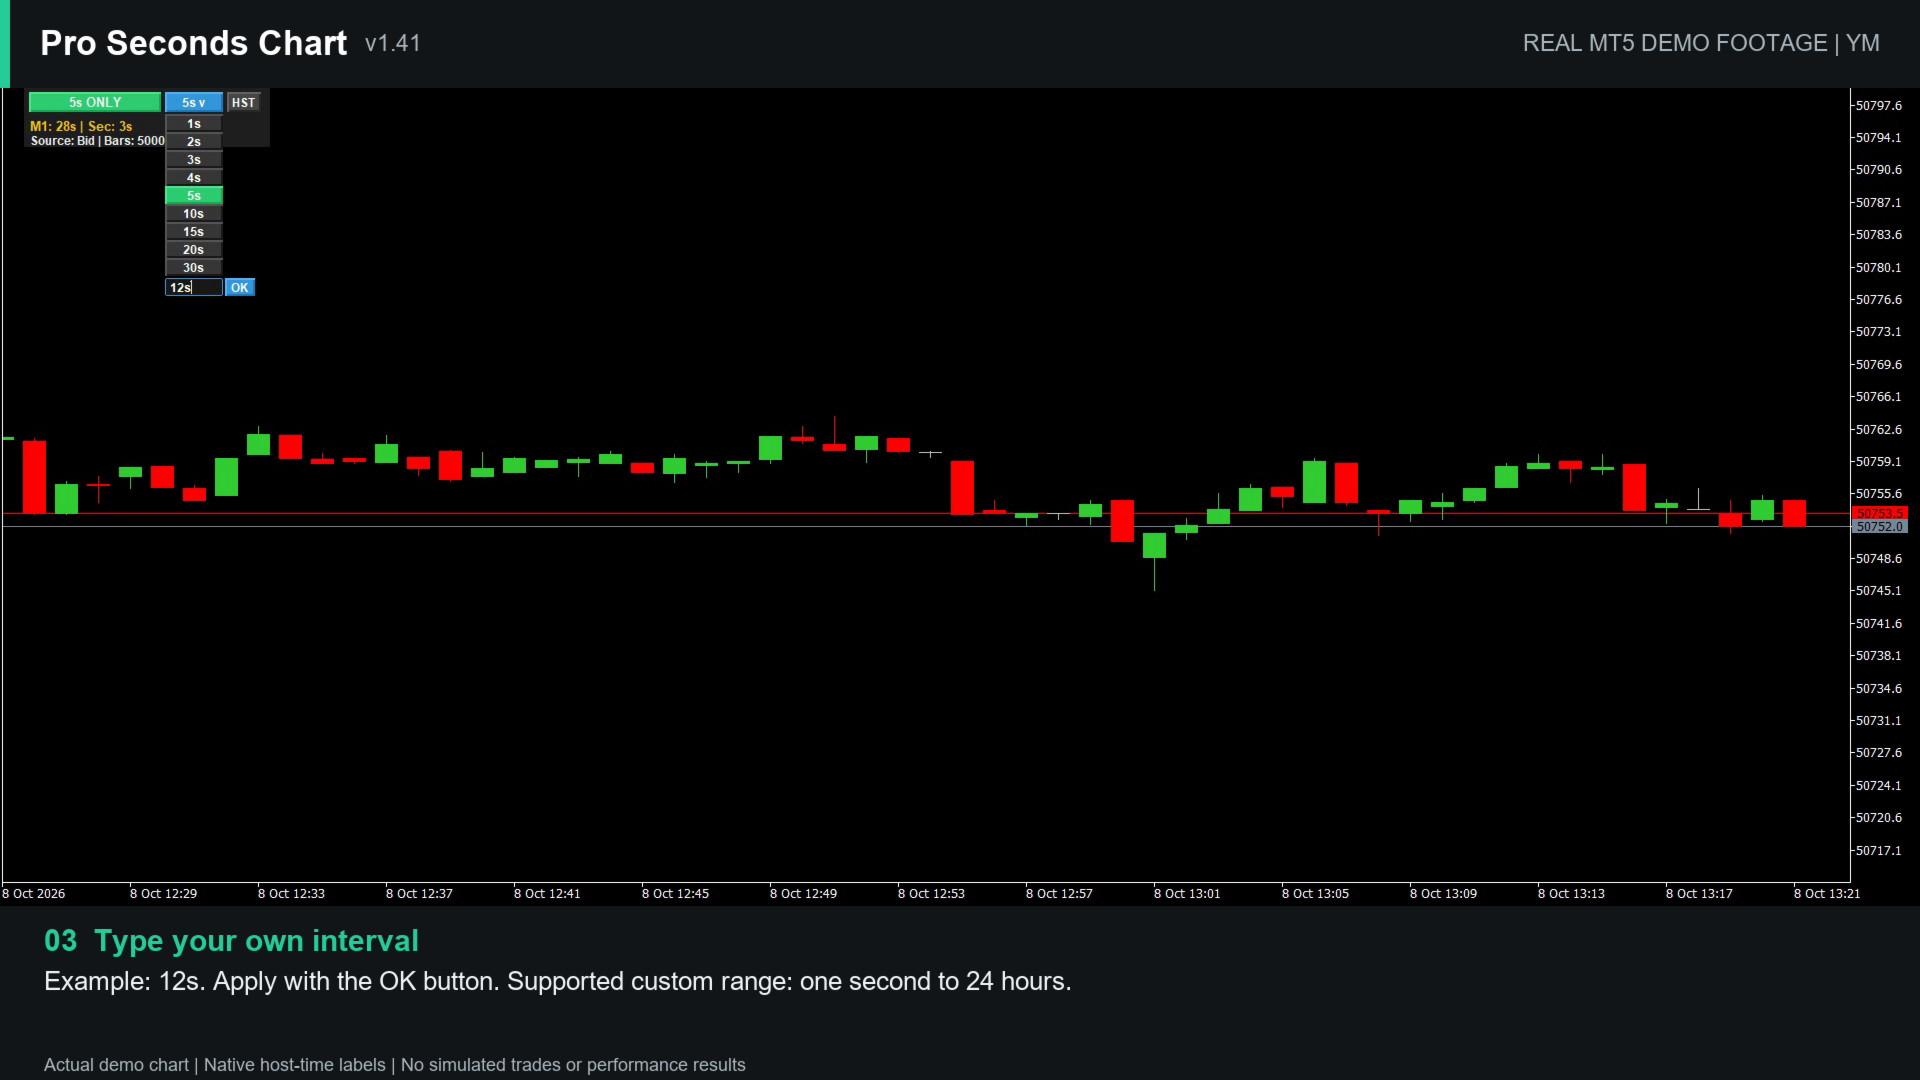
- Custom intervals from 1 second to 24 hours, applied with the OK button
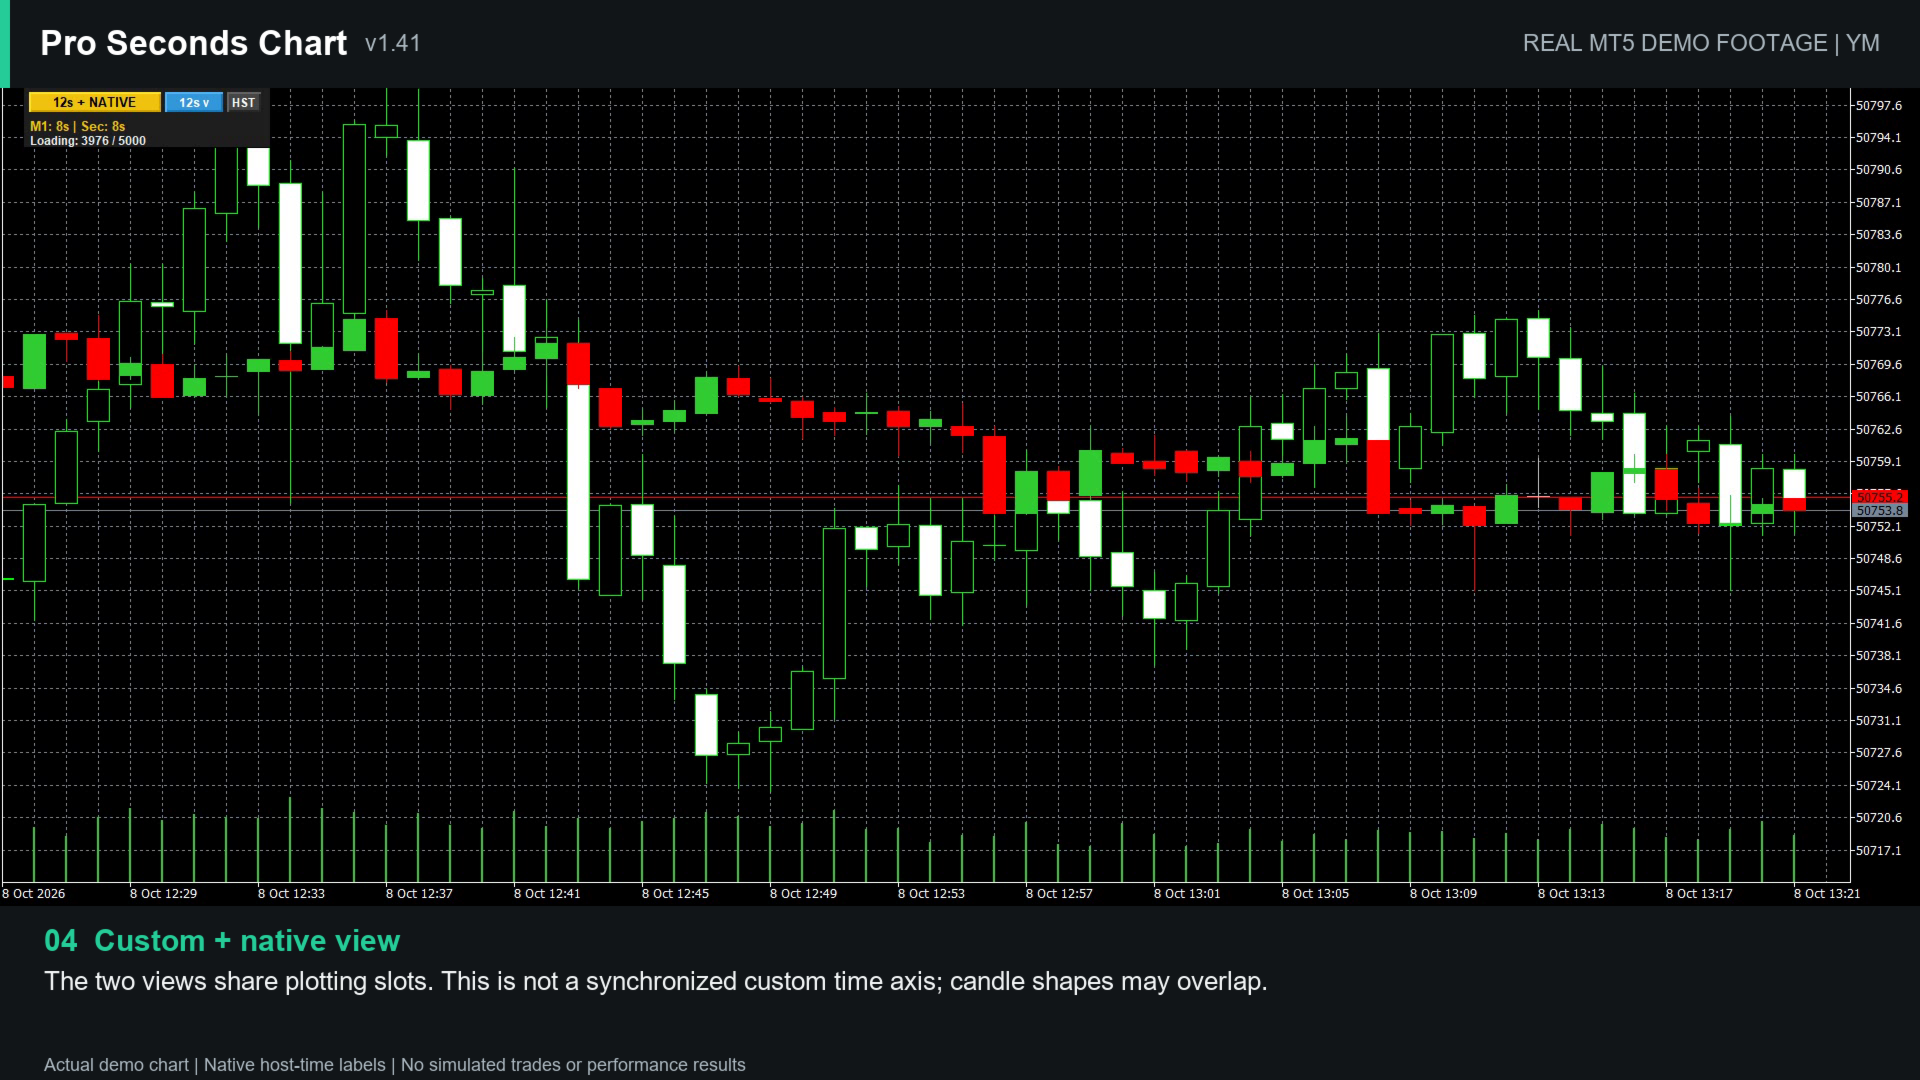
- Three display modes: custom candles only, custom candles with the native chart, native chart only
- Countdowns for the host bar and the current custom candle
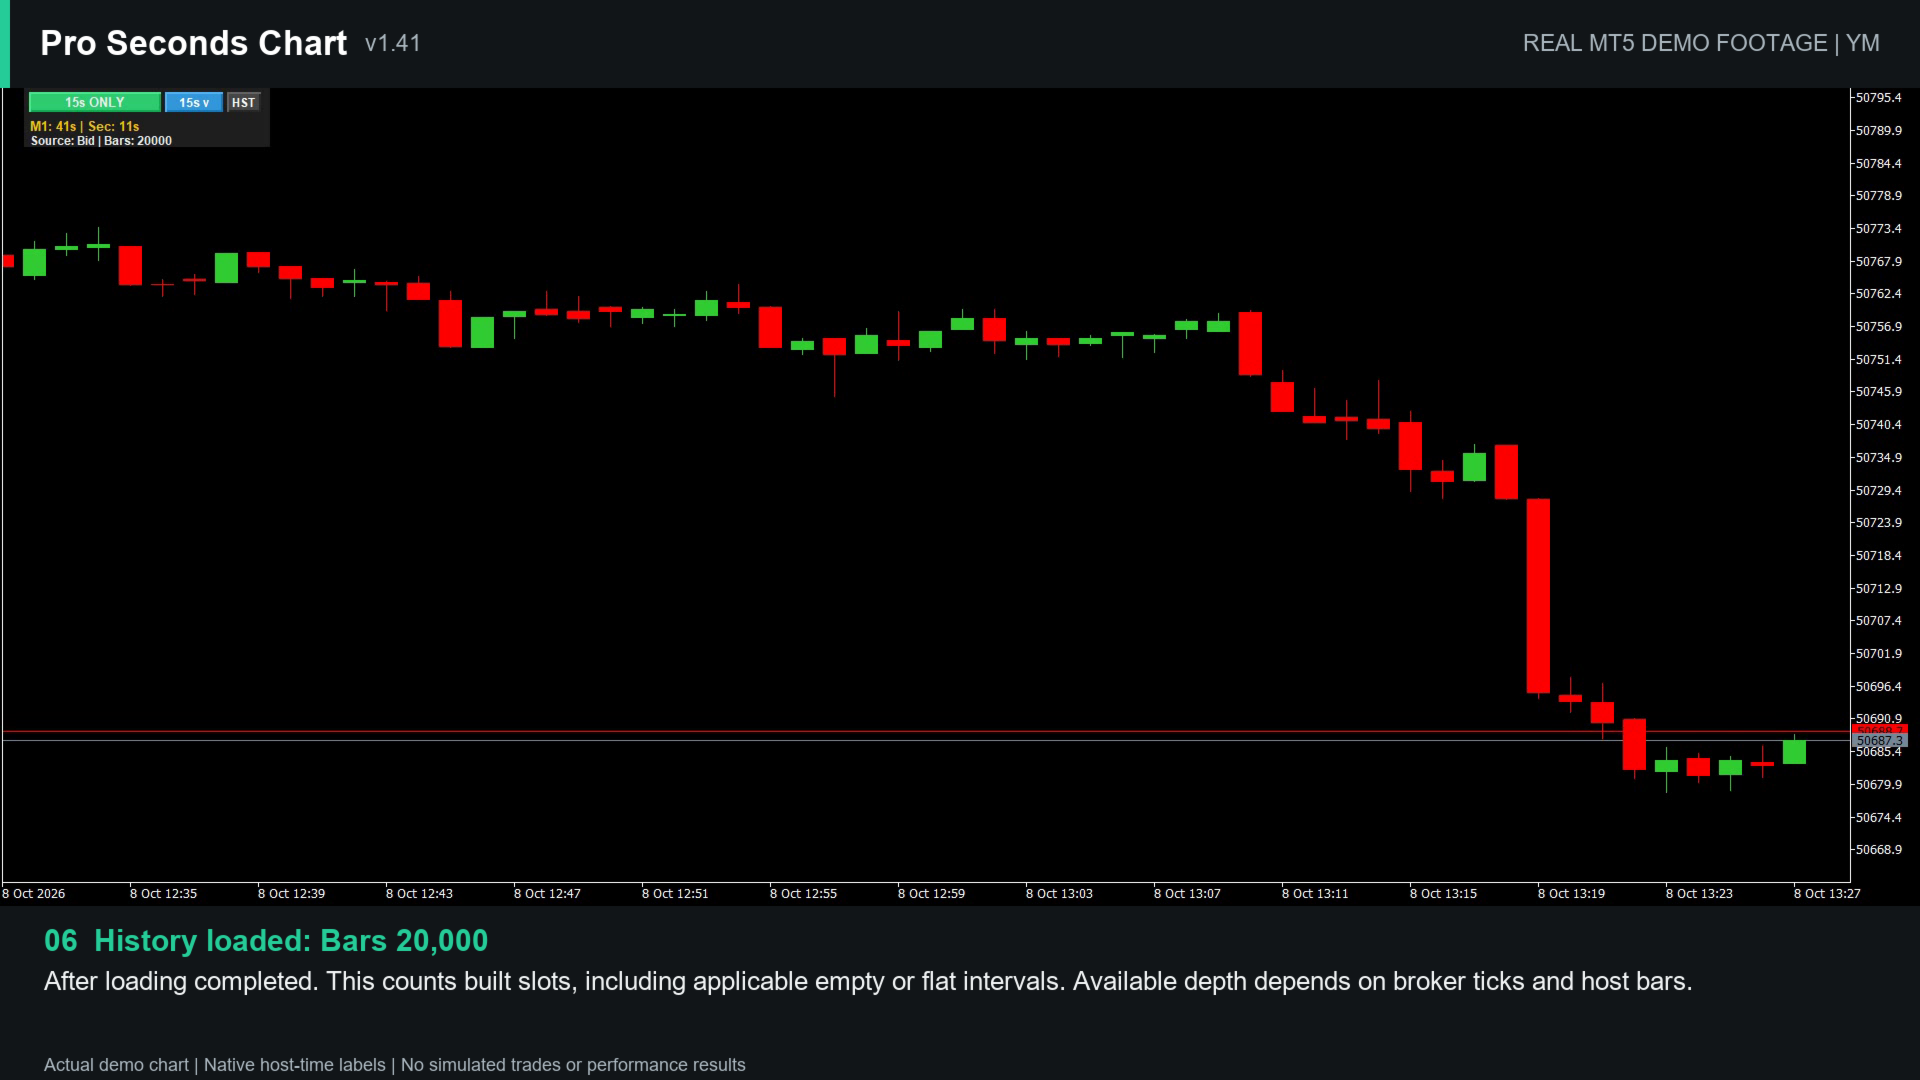
- Progressive history loading and an HST button to rebuild history
- Optional filling or hiding of intervals without ticks
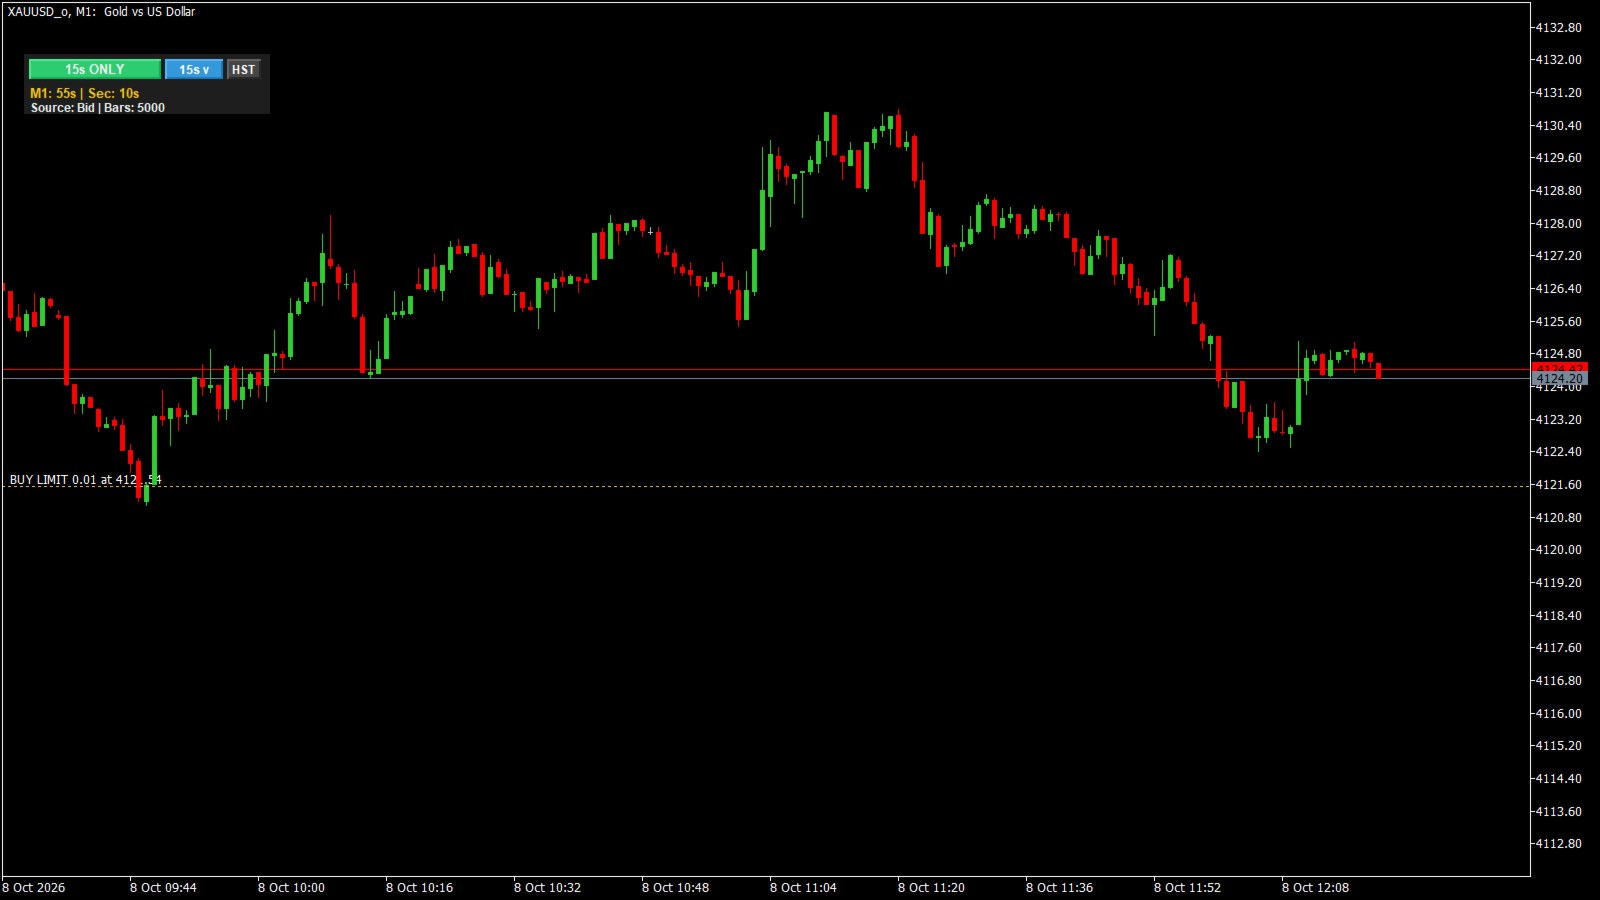
- Dotted entry reference lines for open positions and pending orders
- The chart's original appearance is restored when the indicator is removed
How to use
- Attach the indicator to a chart with available tick history. M1 is the recommended host chart for seconds charts, although the indicator is not restricted to M1. The default settings work out of the box.
- Wait while history loads progressively. The dashboard shows "Loading x / y" during this step.
- Click the interval button to choose a preset, or type a custom interval in the box below the presets and press OK. Pressing Enter or clicking elsewhere does not apply a value, and invalid input is rejected with a short warning.
- Use the mode button to switch between custom candles, custom candles with the native chart, and the native chart. Changing the custom interval does not change the host chart's timeframe.
Keep enough chart space for the dashboard and its preset menu. A very short or narrow chart window may clip some controls. If the custom candles look compressed or clipped, adjust the MT5 vertical price scale, because the automatic scale follows the native chart data.
Input parameters
Interval and dashboard
- Seconds: starting preset interval.
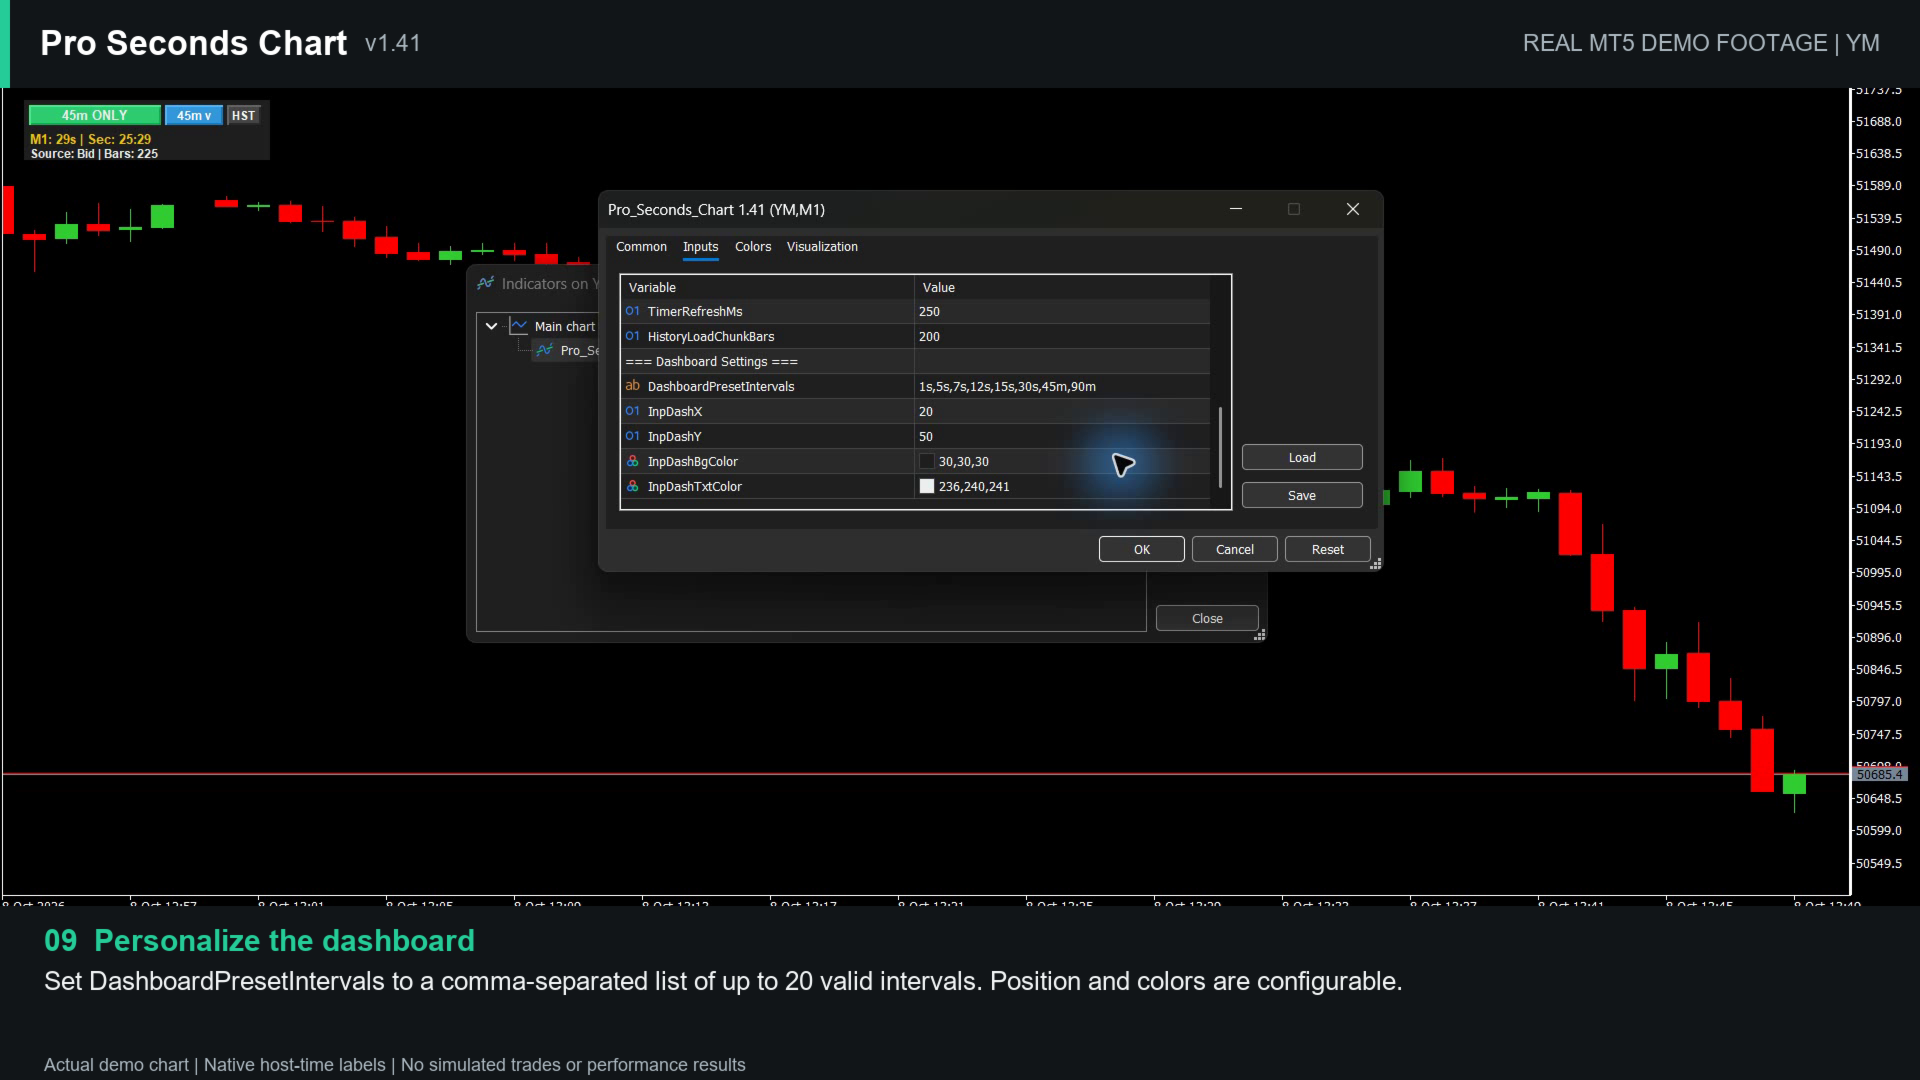
- DashboardPresetIntervals: comma-separated preset list for the menu, up to 20 values, for example 1s,3s,5s,7s,15s,30s,45s,2m.
- InpDashX, InpDashY, InpDashBgColor, InpDashTxtColor: dashboard position and colors.
- TimerRefreshMs: dashboard refresh period, 100 to 1,000 ms.
Price source
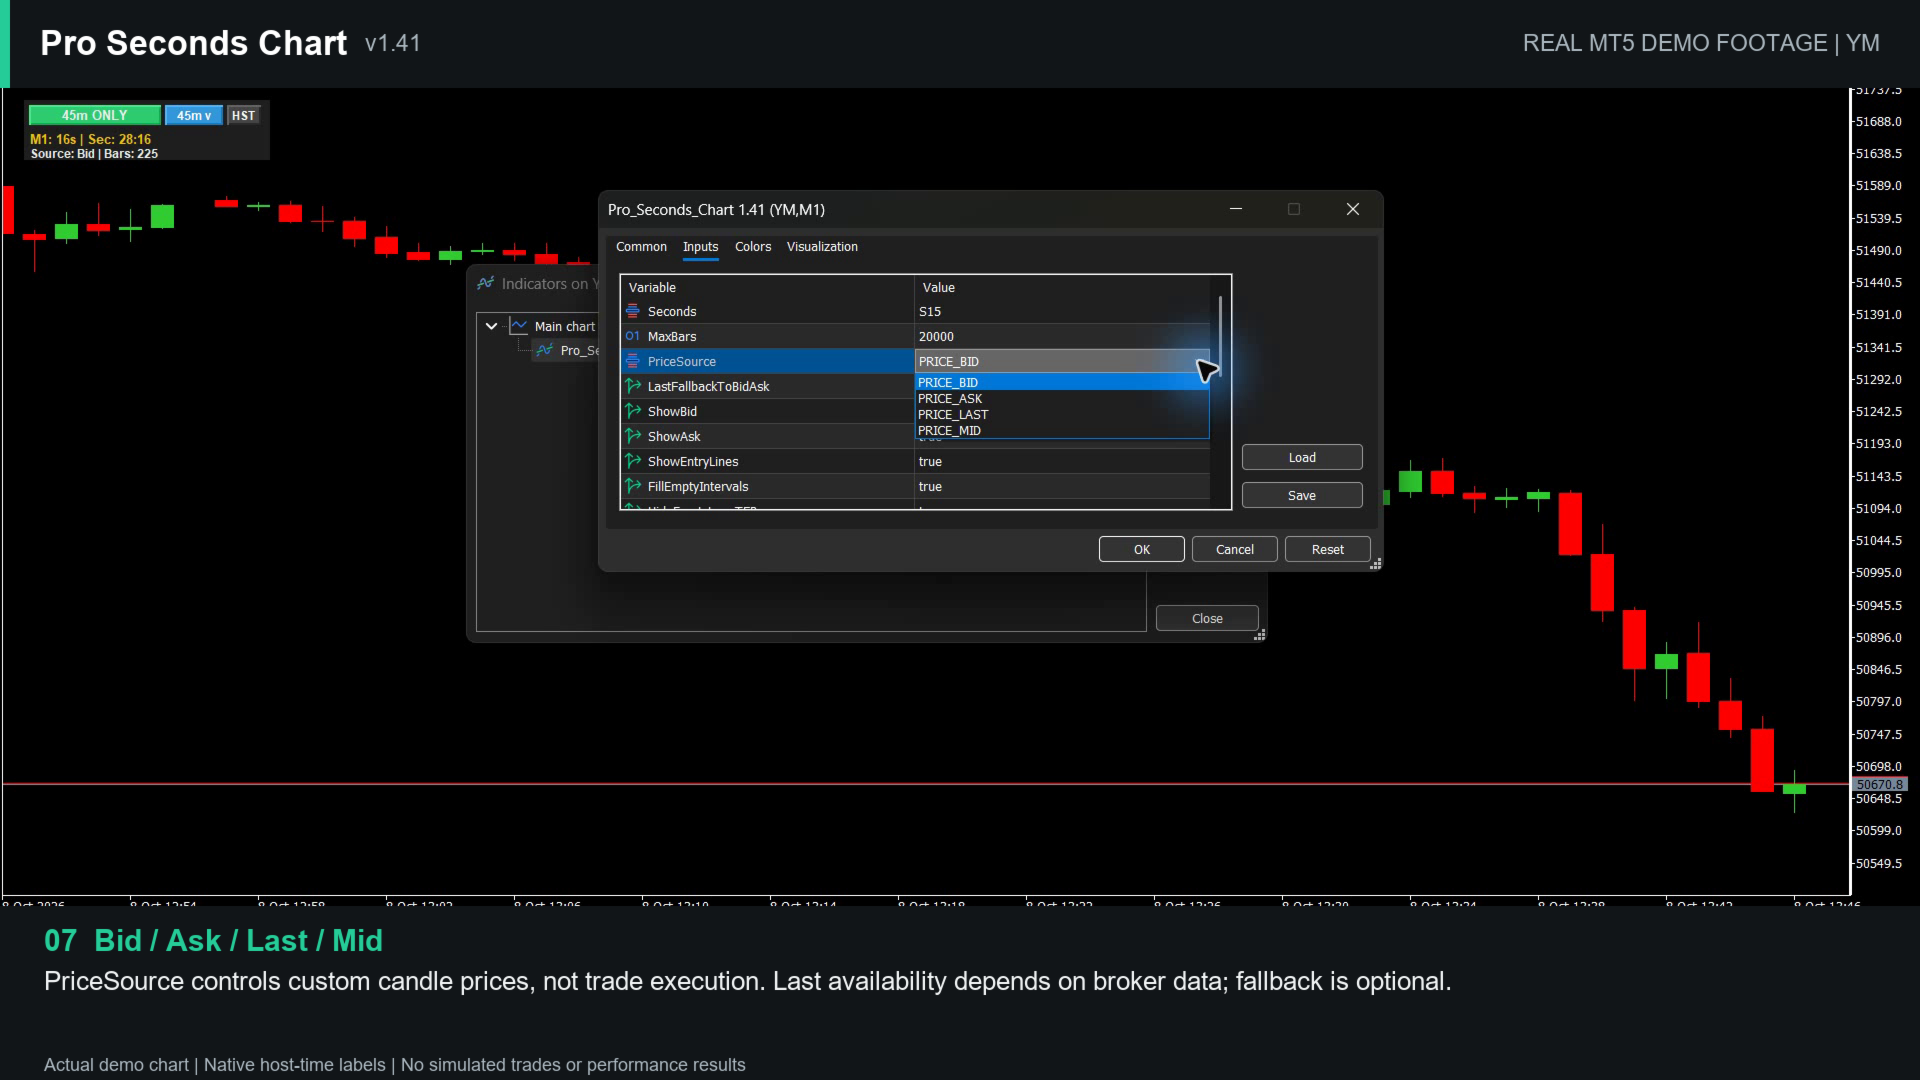
- PriceSource: Bid, Ask, Mid or Last.
- LastFallbackToBidAsk: uses Bid/Ask data when Last prices are not available. If Last is unavailable and this option is disabled, no candles are substituted and the dashboard asks you to enable the fallback.
History
- MaxBars: requested maximum number of custom bar slots, 10 to 50,000. Around 5,000 is recommended. The actual number also depends on the host chart's available bars, the broker's tick history and the interval.
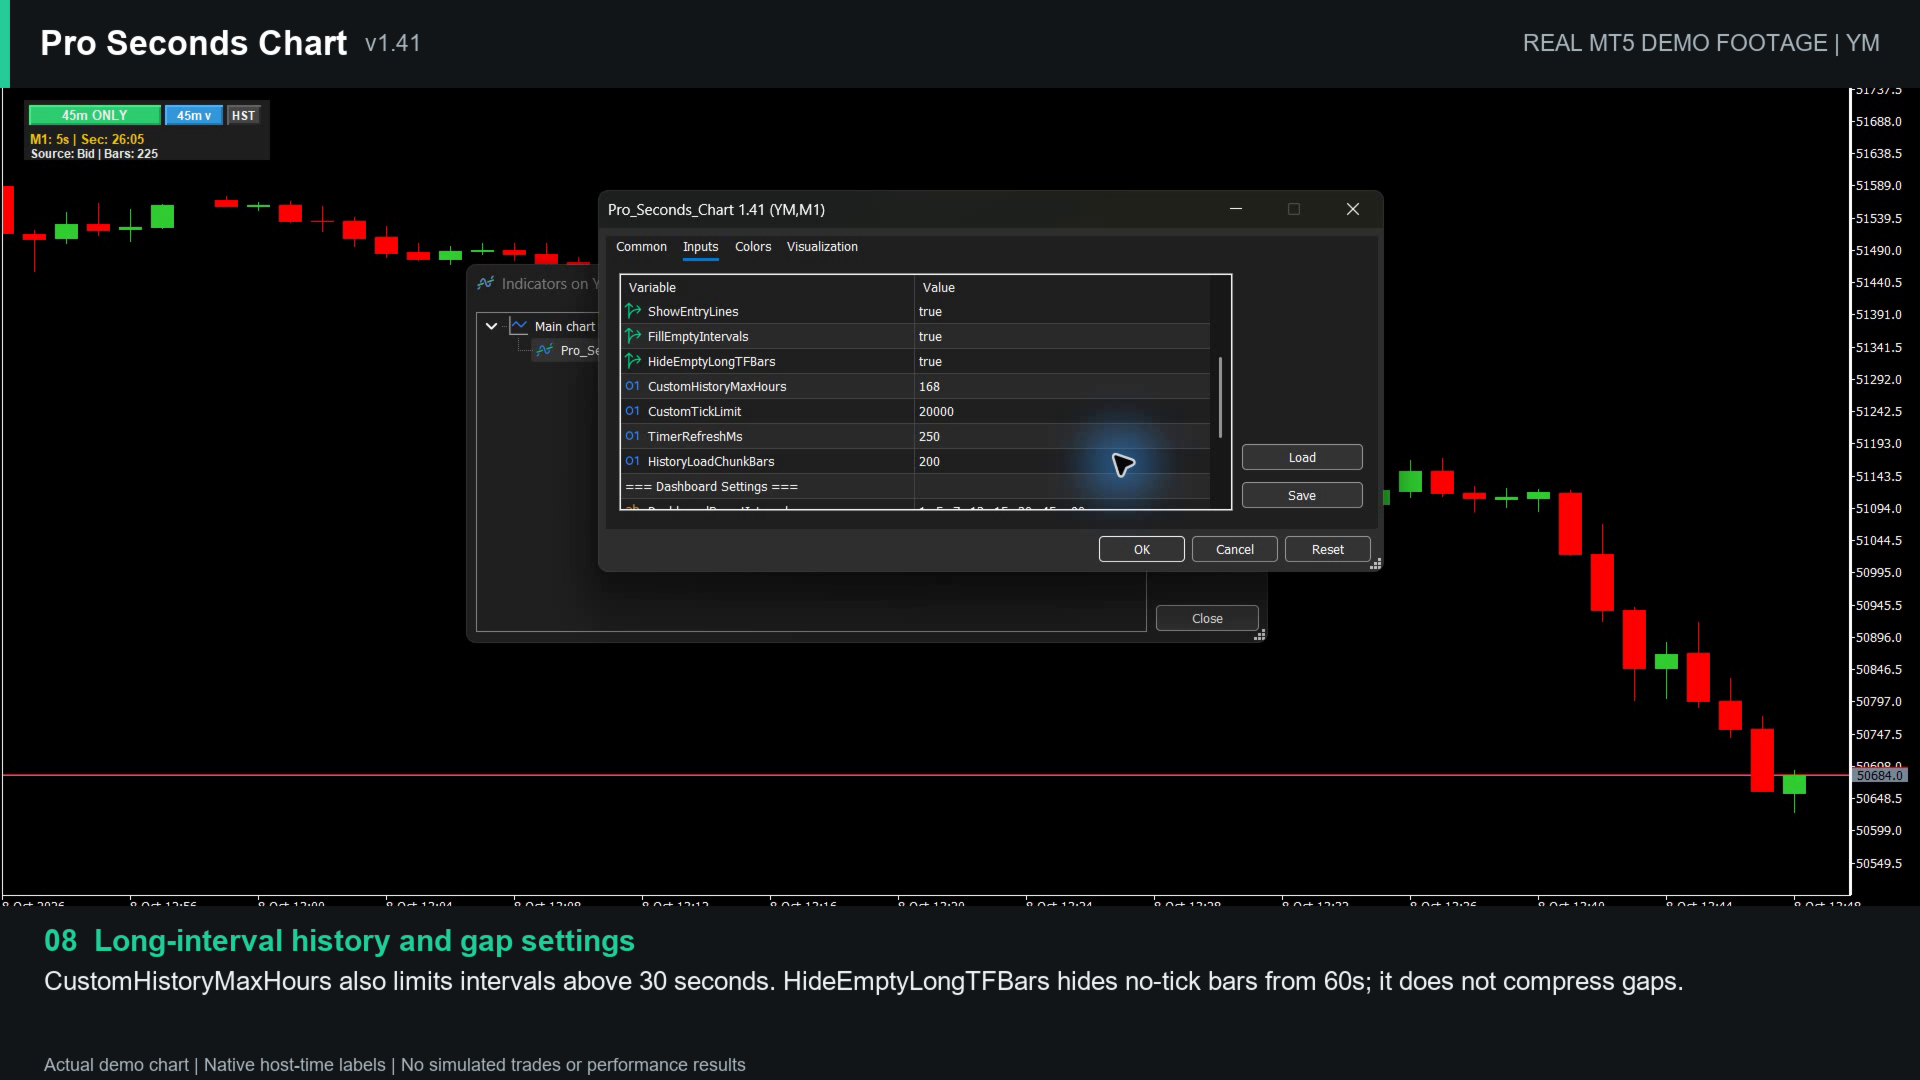
- CustomHistoryMaxHours: history window for intervals above 30 seconds, 1 to 168 hours. To show more 45m or 90m candles, increase this value as well as MaxBars.
- CustomTickLimit: tick budget per history loading page, 1,000 to 20,000. It is not a total history limit. Keep the default of 20,000 unless your own testing shows a reason to change it.
- HistoryLoadChunkBars: number of older bar slots targeted per loading step, 10 to 1,000. It does not raise the final history limit.
Empty intervals
- FillEmptyIntervals: shows an interval without ticks as a flat candle using the previous valid price. Slots before the first valid price may remain empty.
- HideEmptyLongTFBars: for intervals of 60 seconds or longer, hides the drawing of slots without ticks. It does not remove the slots or compress the horizontal spacing, so gaps may remain visible.
Display
- ShowBid, ShowAsk: show or hide the Bid and Ask lines.
- ShowEntryLines: dotted entry reference lines for open positions (green) and pending orders (yellow) on the current symbol. Stop Loss and Take Profit lines remain MetaTrader 5's own trade levels.
Performance
History loads progressively. Deeper history, very short intervals such as 1 second, and symbols with dense tick activity need more loading time, CPU and memory, so increase MaxBars gradually. Performance depends on your computer, broker, other open charts and other running tools. The dashboard countdown is refreshed periodically and is not a millisecond-accurate clock; a new candle appears when its first tick arrives.
Good to know
- Custom candles are drawn into the host chart's bar slots, so the time axis shows the host chart's time labels, not the opening times of the custom candles. Native chart data can also influence the automatic vertical price scale.
- Standard indicators such as Moving Average, RSI, MACD or Bollinger Bands are calculated from the native chart data, not from the custom candles. Indicators on the custom intervals are not supported in this version.
- There is no separate volume histogram for the custom candles. In custom-only mode the native volume is hidden; a separate Volumes indicator still shows host chart volume.
- The indicator does not trade and does not use DLLs, WebRequest or external files. It can run alongside Expert Advisors, trade panels or trade-management tools, but compatibility depends on how each tool reads the indicator. An Expert Advisor that reads native chart bars does not automatically use these custom candles. Test your exact setup on a demo account.
Free demo
MetaTrader 5 runs Market demo versions only in the Strategy Tester. Choose Indicator mode, a major forex pair such as EURUSD, the M1 timeframe, "Every tick based on real ticks" and a short weekday range. The dashboard buttons do not respond inside the Strategy Tester, so choose the interval with the Seconds input. Visual testing is very slow during periods without ticks, such as market-closed hours, and Strategy Tester visualization may not fully match live chart behavior.
A short demo video of all features is available in the video section of this page.
When updating from an older version, start from a chart with its normal native appearance and do not stack different versions on the same chart. For questions, contact the seller through MQL5 messages or the product comments.
Pro Seconds Chart is an indicator only. It does not open or close trades, modify orders, manage risk or provide trading signals.