 MetaTrader 5
 Experts
 Indicateurs
 Bibliothèque
 Utilitaires
 Widgets
 Règles
Regardez les tutoriels vidéo de Market sur YouTube
Comment acheter un robot de trading ou un indicateur
Exécutez votre EA sur
hébergement virtuel
hébergement virtuel
Test un indicateur/robot de trading avant d'acheter
Vous voulez gagner de l'argent sur Market ?
Comment présenter un produit pour qu'il se vende bien
Indicateurs techniques pour MetaTrader 5 - 223
 Les signaux provenant des indicateurs techniques jouent un rôle crucial dans l'ouverture et la clôture des transactions sur les marchés boursiers et les marchés forex. L'essence des indicateurs est une transformation mathématique du prix d'un symbole financier visant à prévoir les changements de prix futurs. Testez les indicateurs techniques pour mieux prédire le comportement du marché et en tirer profit.
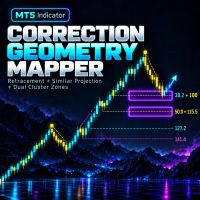
TOOLFORGE CORRECTION GEOMETRY MAPPER — INDICATEUR MT5 TRACEZ LES RETRACEMENTS. PROJETEZ DES CORRECTIONS SIMILAIRES. VISUALISEZ LES CONFLUENCES.
ToolForge Correction Geometry Mapper est un indicateur d'analyse graphique manuelle pour MetaTrader 5. Il associe un retracement de Fibonacci défini par le trader à des projections fondées sur une correction de référence antérieure sélectionnée manuellement. Lorsqu'un niveau de retracement actif et une projection active sont suffisamment proches, leur

ATS Round Number Cascade Stats mesure ce qu'a fait le prix après avoir franchi des niveaux ronds sur votre propre symbole, à partir de l'historique de prix de votre courtier. Le résultat s'affiche dans un panneau dans le coin du graphique. Les niveaux sont tracés sous forme de lignes sur le graphique. Beaucoup de traders surveillent les prix ronds comme des niveaux de réaction possibles. Cet indicateur ne suppose pas qu'ils comptent. Il compte ce qui s'est passé après chaque franchissement et le

See every hour against its own past
Session Pulse measures how each hour of the week usually behaves. It reads the symbol's H1 history on your broker and builds a weekday by hour fingerprint, Monday to Friday, hour by hour. For each hour of each weekday it stores the usual range, the usual spread and how often that hour produced a spike. Then it puts the live market next to that fingerprint.
Main features
1. Weekday by hour fingerprint. Monday 09:00 and Friday 09:00 are different hours, and S

A Chart-style Long/Short Position tool for MT5. Drag entry, take profit and stop loss directly on the chart, see the risk/reward ratio and the lot size calculated from your risk % instantly. Green TP zone, red SL zone, clean English labels, and a round on-chart button to show or hide the tool. Purely visual - it never opens, modifies or closes orders. Plan trades on MetaTrader 5 visually, directly on the chart. Place the box, drag the levels, and read the price, RR and position size at a glance.

Smart Forex Trend and Signal Indicator
Smart Forex Trend and Signal Indicator is a technical analysis tool designed to help traders identify market trends and potential buy and sell opportunities directly on their trading charts.
Its user-friendly design makes it suitable for beginners and experienced traders who want a clearer view of market direction and price movements.
Key Features
* Trend Analysis: Helps identify potential bullish and bearish market trends. * Buy and Sell Signals: Disp

SMC AI Pro: Smart Money Concepts Indicator with Multi-Timeframe Confluence and Trade Plan Dashboard Reading Smart Money Concepts by hand means judging structure, order blocks and gaps across several timeframes. SMC AI Pro does that work on your chart. It maps six core concepts, checks them against the next higher timeframe, and turns the result into a trade plan with a price for entry, stop loss and take profit. 2. WHAT THIS INDICATOR DOES SMC AI Pro detects and tracks six Smart Money Concepts

Every fair value gap on your chart shows how much of it is already filled, and how often gaps on this symbol and timeframe were filled before.
Rift measures every fair value gap. Each gap carries a live fill meter, and the panel tells you what the gaps of this symbol and timeframe did in the past on your broker's own data. You see at a glance which gaps are fresh, which are half used, and how far price is from the next one, in the right unit for the symbol.
Main features
1. A fill meter on ev

Spike Hunter — Master the Spikes. Protect Your Capital. Spike Hunter is a premium, fully automated indicator specifically engineered for Spike Markets . Unlike generic indicators that fail on synthetic markets, Spike Hunter uses a proprietary algorithm that automatically detects the exact behavior of your chart—whether it is an upward-spiking market or a downward-spiking market—and adapts its strategy instantly. No complex setups. No manual direction switching. Just attach it to your chart, a

Model S/R + Rotation + Sessions One overlay. Three engines. No repaint Indicator A professional analytical indicator that combines historical Support/Resistance with strength scoring , a rotation trend channel with live angle readout , and a session engine with countdown monitor — all rendered natively on the MT5 chart with zero external dependencies. What It Does Engine Output S/R Engine Auto-detected historical bands, colour-coded (RES/SUP), tagged xN touches and strength % (0–100). Strongest

Вот профессиональный перевод описания индикатора на английский язык, полностью оформленный и готовый для публикации на площадке MQL5 Market : ADX-Trend Pro MTF — Professional Trend Indicator for MetaTrader 5 ADX-Trend Pro is a modern, high-tech tool for comprehensive market analysis designed to identify strong, sustainable trends and filter out market noise (flat ranges). The indicator combines classic moving average analysis, a powerful ADX/DI trend strength filter, and dynamic ATR-based volati

OMA Hourly Liquidity Scanner is a professional MT5 indicator designed to identify high-quality liquidity and market structure setups in real time. It combines: The indicator automatically builds a rolling reference range and monitors the market for liquidity sweeps, structural changes and institutional confirmation before presenting a trading setup.
Instead of generating signals from a single pattern, the system combines multiple elements of market structure to filter lower-quality conditions a

Trading sessions set in each city's own clock, with daylight saving handled for you, and each session measured against the average daily range (ADR).
With Meridian Sessions you enter London, New York, Tokyo and Sydney in their own city time. The indicator converts them to your broker's clock day by day, including the weeks when Europe, the United States and Australia change their clocks on different dates. For each session the panel tells you how big its range is, what share of the ADR it used

Brief Description:
An assistant for analyzing market dynamics and volatility across timeframes (MT), featuring an automated position simulator based on the "R" (risk multiple) concept. Decision-Support Assistant (based on multi-timeframe ATR analysis) This tool is a professional, multi-timeframe (MTF) entry system designed to identify high-probability trend continuation (CONT) and trend reversal (RV) patterns. Key Strengths and Technical Structure A robust, three-layer "pinned" multi-timeframe

Neuron Chart is a complete charting workspace for MetaTrader 5 from Neuron Systems. It turns the standard chart into a modern, web-style workspace: a top toolbar, a drawing toolbar on the left, a panel bar on the right, indicator panes inside the chart, price alerts, bar replay, a watchlist, a screener, the economic calendar and more, all on the chart you already use. It is an indicator for chart analysis only: it draws on the chart, it does not place, modify or close trades, it does not send or

ATR MultiTF PRO is a professional volatility and Volume Profile tool for MT5. It projects Daily, Weekly, and Monthly ATR expansion bands alongside institutional Volume Profile metrics (POC, VAH, VAL) on your chart to identify exhaustion, mean-reversion, and high-probability setups.
MAIN FEATURES: - Multi-Timeframe ATR Bands: Plots 1D, 1W, and 1M Fibonacci-based ATR expansion zones simultaneously. - Integrated Volume Profile Filter: Tracks POC, VAH, and VAL using customizable lookback periods (

HD Candels Chart – Ultra-Light MT5 Chart Controller HD Candels Chart is a lightweight MetaTrader 5 indicator designed to let traders switch chart styles and customize their chart appearance instantly with simple on-chart buttons. Key Features Line Chart Toggle: Quickly switch to Line Chart mode and toggle between Parrot Green and Black line colors. HD Chart Mode: Apply a professional TradingView-inspired dark slate theme with teal bullish candles, coral bearish candles, and a clean chart backgro

Voyez d'un coup d'œil où vous en êtes dans la journée de trading. QuantEdge Sessions & Levels dessine les sessions d'Asie, de Londres et de New York, les niveaux que tout trader surveille et les cassures du range asiatique - avec des flèches qui ne repeignent jamais.
Des sessions bien faites - Rectangles Asie, Londres et New York de leur plus haut à leur plus bas, avec la taille en pips - Chaque session est réglée sur l'heure locale de sa ville (Tokyo, Londres, New York) : les changements d'heu

MV Support & Resistance (SNR) Indicator MT5 The Support & Resistance (SNR) Indicator helps traders identify important price levels where the market may experience a price reversal, rejection, or breakout. Support and resistance levels are useful for understanding market structure, identifying potential entry opportunities, and planning trading strategies. Understanding Support & Resistance Green Line – Resistance Resistance is a price level where selling pressure may increase, potentially cau

Pattern Oracle is an all-in-one chart pattern engine for MetaTrader. It scans three zigzag levels at once, finds more than 30 harmonic, chart, continuation and reversal patterns, scores every setup and draws a complete trade plan with entry, stop-loss and two take-profit levels. A built-in teaching mode explains every pattern right on the chart. Pivots are only used once they are confirmed and every decision is made on a closed bar, so signals do not repaint . Patterns detected Reversal : Double

Quantum Edge is a machine-learning trend and signal indicator for MetaTrader. It combines a Lorentzian-distance k-nearest-neighbours classifier, a rational-quadratic kernel regression cloud and a multi-timeframe trend filter into one clean chart tool, then turns the result into clear, tiered BUY and SELL setups with ready-made stop-loss and three take-profit levels. Every signal is calculated on closed bars only . Once a label appears on the chart it stays exactly where it is: no repainting, no

LQ NEWS SCANNER — GOLD IMPACT & HISTORICAL EDGE Understand the news. Read the reaction. Discover the edge. Economic releases can create some of the most volatile moments in the Gold market. But knowing when the news is released is only part of the picture. Understanding its potential implications and examining how Gold has reacted to similar events can provide valuable context for your trading decisions. LQ News Scanner brings economic news monitoring, fundamental interpretation and historical

Day, week and month VWAP with sigma bands, a manual anchored VWAP you set with one click, and six automatic anchors. Every line gets a respect score measured on your own chart, so you can see which VWAPs price has actually reacted to.
Fulcrum VWAP Pro draws the volume weighted average price from several starting points at once. For each line it keeps a record of how price behaved around it: the respect score, shown next to the line and in the panel. Automatic anchors with a weak record switch t

Support and resistance levels from six kinds of sources, each with a biography: how many times price tested it, how many breaks failed, the share of tests that held, and whether a break was clean or suspected. Broken levels flip role, and the strongest overlaps become confluence zones.
Levels Memory collects levels from swings, higher timeframe swings, the previous day, week and month, floor pivots, Fibonacci retracements and round numbers. Levels that sit close together are merged into one lev

Ultimate Gold Scalper Ultimate Gold Scalper is a MetaTrader 5 indicator designed to present structured short-term XAUUSD trading setups directly on the M1 and M5 chart. It combines multi-timeframe market filtering with clear entry, stop-loss, and take-profit visualization. If the indicator does not appear on your chart, simply right click anywhere on the MT5 chart screen and select Refresh
Key Features BUY and SELL setup detection Clearly marked Entry, Stop Loss, and Take Profit levels Fixed 1:

How many CRT opportunities are missed while you are watching another chart or timeframe? The Candle Range Theory Indicator monitors three configurable timeframes simultaneously and brings qualifying bullish and bearish CRT setups directly to your current chart. Spend less time switching between charts and more time evaluating structured trading opportunities.

Delta Footprint: Order Flow, Volume Profile & Risk Calculator for MT5 See who is really buying and selling. Footprint, delta profile with POC/VAH/VAL, large-order bubbles and a position-size calculator, all inside one indicator. IMPORTANT: broker requirement This indicator needs real trade ticks with volume , which are available on futures contracts . You must trade with a broker that offers futures on MetaTrader 5 (for example index, commodity or currency futures). On symbols without real tra

Indicateur Crypto_Forex « Histogramme de Tendance Majeure » pour MT5, sans refonte. - L'indicateur Histogramme de Tendance Majeure est conçu pour détecter les tendances majeures. - L'indicateur est disponible en deux couleurs : rose pour une tendance baissière et vert pour une tendance haussière (couleurs modifiables). - Il détecte les tendances dès leur amorce, bien plus efficace que n'importe quelle moyenne mobile standard. - L'Histogramme de Tendance Majeure peut être combiné avec d'autres m

RatioFang detects harmonic patterns on your chart and draws the PRZ (Potential Reversal Zone) together with entry, stop-loss and take-profit guides. It is a display-only indicator: it never places, modifies or closes orders. What it detects Gartley, Bat, Alt Bat, Butterfly, Crab, Deep Crab, ABCD, Cypher, Shark, 5-0 and Three Drives, both bullish and bearish. Every pattern is checked against its commonly published Fibonacci ratios, with an adjustable tolerance. What you see on the chart The X-A-B

Mega MNFM MT5
Mega MNFM brings ten technical readings, a seven-timeframe trend map, regional session clocks and account-deal statistics into one MetaTrader 5 dashboard.
Technical dashboard RSI, MACD histogram, Stochastic, EMA trend, ADX, Bollinger Bands, an asset technical Fear & Greed proxy, an indicative synthetic dollar basket, ATR rank and OBV flow. Readings use completed candles. The timeframe map covers M1, M5, M15, M30, H1, H4 and D1. The dashboard includes a directional summary, trend

Synthetic Machine – SuperTrend, Cloud, Niveaux de Trade & Coach de Trading Un indicateur MT5 complet pour analyser les tendances et gérer vos trades sur les indices synthétiques. Les indices synthétiques évoluent 24h/24. Pour les trader, vous avez besoin d'outils capables de suivre le marché à tout moment, sans dépendre des horaires des sessions de trading classiques. Synthetic Machine réunit dans un seul indicateur tout ce dont vous avez besoin pour structurer votre analyse : un SuperTrend avec

️ UTS Prime Zones — The Ultimate Multi-Timeframe Support & Resistance Engine UTS Prime Zones is an advanced, institutional-grade indicator that automatically maps out the most critical Support and Resistance zones across two different timeframes simultaneously . Stop drawing lines by hand. Stop guessing where the market will reverse. UTS Prime Zones uses a sophisticated fractal and ATR-based algorithm to identify high-probability "zones" (areas, not just single lines) where price is highly l

THV Camarilla Pivot MT5 – Reversal, Breakout & Target Levels
Overview THV Camarilla Pivot MT5 is a technical indicator that automatically calculates and displays Camarilla Pivot levels on your MetaTrader 5 chart. Based on the previous candle of the selected timeframe, the indicator plots eight key levels: H3, H4, H5, H6, L3, L4, L5, and L6. These levels help traders identify potential reversal zones, breakout areas, and price targets. The indicator also provides customizable line colors, styles

A pair moves because one of its two currencies moved. EURUSD falling can mean a weak euro or a strong dollar, and the two call for different pairs. Checking that by hand means opening a dozen charts.
Currency Strength Desk ranks all nine currencies — AUD, CAD, CHF, EUR, GBP, JPY, NZD, USD and gold — on one 0 to 100 scale, across 29 pairs, and keeps the ranking live on a single panel.
WHAT EACH COLUMN SHOWS
Strength — where each currency stands from 0 to 100, built from every pair it appears

Indicateur Crypto_Forex « MFI Speed » pour MT5, sans refonte. - Le calcul de cet indicateur est basé sur des équations physiques. Le MFI Speed est la dérivée première du MFI lui-même. - L'indice de flux monétaire (MFI) est un oscillateur technique qui utilise les données de prix et de volume pour identifier les zones de survente et de surachat. - Le MFI Speed est idéal pour scalper les entrées de momentum dans le sens de la tendance principale. - Utilisez-le en combinaison avec un indicateu

THV SMC Plus MT5 – Smart Money Concepts & Multi-Timeframe Analysis
Overview THV SMC Plus MT5 is a comprehensive Smart Money Concepts (SMC) indicator designed to help traders analyze market structure, identify potential liquidity zones, and recognize high-probability trading setups directly on MetaTrader 5. The indicator combines multiple price-action and institutional trading concepts into one customizable tool, including Break of Structure (BOS), Change of Character (CHoCH), Order Blocks (OB)

Inversion FVG détecte les Fair Value Gaps (déséquilibres de 3 bougies) et trade le moment où ils échouent. Lorsque le corps d'une bougie clôture à travers le gap, celui-ci est "inversé" et devient un support ou une résistance. Quand le prix le retest et est rejeté, l'indicateur affiche une flèche avec des niveaux prêts d'entrée, de Stop Loss, de TP1 et de TP2.
Fonctionnement 1. Un FVG haussier ou baissier est détecté et dessiné comme zone brute. 2. Une clôture du corps d'une bougie à travers l

> SMC Vision Pro finds price structures using fixed, documented rules. They are reference points for analysis. They do **not** predict reversals and are not trading signals. Every rule below can be checked by hand on a chart.
---
## 1. Signal timing and repainting
| Item | Behaviour | |---|---| | Evaluation point | Every detection runs on **closed bars only**. The forming bar (index `rates_total-1`) is never part of a detection. | | Can a signal change before the candle closes? | **No.** BOS

Malaysian SnR Precision IndicatorThe Ultimate Institutional Support & Resistance System for Forex & Synthetic Indices Take your trading to institutional precision with Malaysian SnR — an advanced, logic-driven indicator designed to identify high-probability Buy & Sell reaction levels on every timeframe. Built for traders who demand absolute transparency, Malaysian SnR completely eliminates lag, repainting, and late entries. Key Features & Highlights 1. 100% Non-Repainting & Closed-Bar Precision

H4 Range Setups Indicator by SaintEmma Fx Systems. It is a multi-pair scanner built on one idea: the first H4 range of the New York day, and what happens when price breaks it and fails. It watches your whole Market Watch list, ranks the freshest setups in a dashboard, and prices each one with entry, stop, target and a lot size for 1% risk.
WHAT THIS INDICATOR DOES Early-session range breaks often fail. This indicator is built to catch that failure. It marks the opening H4 range of the NY day,

SBR / RBS FLIP INDICATOR (MT5) The Ultimate Non-Repainting Support & Resistance Flip Engine Dominate Forex Pairs & Catch Volatile Spikes on Synthetic Crash & Boom Indices! Why The SBR / RBS Flip Indicator Changes Everything Most Support & Resistance indicators repaint, lag, or give late signals after the move has already happened . The SBR / RBS Flip Indicator was specifically engineered for precision traders who need absolute transparency and zero-lag alert speed . Instead of showing messy, sub

Elliott Wave Auto Count labels Elliott waves automatically on four degrees at the same time: the base degree and the three degrees above it. It follows the rules and guidelines of "Elliott Wave Principle" (Frost & Prechter). For the current wave it also shows a price x time target zone and an invalidation level.
HOW IT WORKS 1. Swings: five ATR(100)-based zigzags. Each higher degree uses a larger swing threshold. The finest zigzag is hidden and is used only to count the sub-waves inside each l

Tick Volume Dots — Uptick/Downtick Confirmation Indicator
A simple visual filter to confirm momentum, spot exhaustion, and add tick-level confluence to your existing strategy. Description:
"Read Real Order Flow, Not Just Candle Color" — shows a run of red dots quietly warning of a reversal before the candles confirm it, then the flip to green dots at the exact turn. "Confirm Scalp Entries in Seconds" — pairs the on-chart dots with the histogram Sub window, showing how a burst of green dots + a

Overview Quantum Levels is a technical indicator for MetaTrader 5. It calculates market structure zones, liquidity nodes, and a multi-layer price consensus, and displays these elements directly on the chart. Displayed elements The indicator provides the following elements: 1. Market structure zones based on swing highs and lows, indicating active and broken structural areas. 2. Liquidity node areas and shift lines derived from structural breaks. 3. Color-coded consensus candles representing p

Zone Risk Planner turns support and resistance zones into a complete trade plan: where to enter, where to place the stop loss (SL), where the take profit (TP) goes and how many lots match your risk. It also shows the risk of your whole account, the market regime on several timeframes and a multi-symbol scanner, all in one indicator.
It is a planning and risk-management tool. It does not give buy or sell signals and it does not open, modify or close trades.
Support and resistance zones
- Calcu

Desi Bulls PA King Pro — Pure Naked Price Action Sniper Indicator Desi Bulls PA King Pro is an institutional-grade, 100% NON-REPAINTING Naked Price Action indicator designed for precision scalping on Gold (XAUUSD) and Bitcoin (BTCUSD) on the M5 and M15 timeframes. Unlike conventional indicators that clutter your chart with lagging moving averages, RSI, or stochastics, PA King Pro uses pure candlestick geometry, fractal liquidity sweeps, and macro trend flow to identify high-probability instit

Dow Structure MTF shows the Dow theory trend structure of five timeframes at the same time, using the pullback low / rally high approach that is common among Japanese traders. For each timeframe you see whether the trend is up, down or range, which price would change it, and how far the current price is from that level. Only closed bars are used, so a confirmed result never changes afterwards (no repaint).
WHAT YOU SEE - Table of five timeframes (M15, H1, H4, D1, W1 by default, all changeable)

TrendLens - Multi-Timeframe Trend Indicator with Trend Cloud, No-Repaint Arrows and Trade Plan
TrendLens shows the trend of a higher timeframe directly on the chart you trade. Candles are coloured by trend, unclear phases turn grey, and a clean on-chart panel tells you in plain words what the market is doing. It works on any symbol (forex, gold, indices, crypto CFDs) and on any timeframe from M1 to D1.
The idea is simple: trade in the direction of the bigger trend, stay out when the trend is

Description & Core Concept Professional Extra Triangle Scalper v18.2 is an advanced geometric analysis and multi-asset correlation indicator engineered after years of testing on live market conditions. Built upon dynamic vector scanning of triangle structures and 3-asset algorithmic cross-validation, it effectively filters market noise to deliver high-precision price projections. Risk & Money Management Money Management is the foundation of long-term trading consistency. Always calculate positi

Fibo Price Time Zones combines Fibonacci price levels with Fibonacci time targets and draws them on the chart as boxes (price x time zones). It helps you organize which price areas to watch and roughly when. Where boxes from several waves and from higher timeframes overlap, the area is emphasized in three levels. Base waves are built only from confirmed swings, so a confirmed box does not move afterwards (see the conditions below).
WHAT IT DRAWS - Price levels: retracement 38.2 / 50 / 61.8 / 7

LIGHTHOUSE — la structure du marché en un coup d'œil. Sans repaint. LIGHTHOUSE lit la structure du prix à partir de points de swing confirmés et l'affiche sur le graphique de façon claire et simple. Il répond à trois questions que tout trader discrétionnaire se pose avant d'entrer : où va l'unité de temps supérieure ? Où va le graphique actuel ? Où sont les niveaux de prix importants ?
C'est un outil d'aide à la décision. Il ne passe pas d'ordres et ne prédit pas les prix. Pourquoi « LIGHTHOUSE

TrendLadder — indicateur de tendance adaptatif avec panneau multi-unités de temps
OBJECTIF TrendLadder affiche la direction de la tendance sous la forme d'une « ligne en escalier » épurée. Tant que le marché ne fait que du bruit, la ligne reste immobile ; elle ne bouge que lorsque le prix effectue un mouvement significatif et confirmé. Vous voyez ainsi d'un coup d'œil qui contrôle le marché — acheteurs ou vendeurs — et quand la tendance a réellement changé. MT4-version: https://www.mql5.com/en

ATR River est un indicateur de tendance pour MT5 qui trace des bandes ATR lissées (un canal ATR, similaire à un canal de Keltner) sous la forme d'une rivière vivante sur le graphique, avec une ligne lumineuse de trailing stop basée sur l'ATR et des signaux d'achat et de vente confirmés à la clôture de la barre. Pour le forex, l'or (XAUUSD), les indices et les cryptomonnaies, sur toutes les unités de temps. Ce qu'il affiche La rivière : verte en tendance haussière, rouge en tendance baissière. La

Advance AI Scanner is a multi-symbol analysis indicator for MetaTrader 5. It scans Forex pairs, metals, energy, stock indices and cryptocurrencies at the same time and rates each instrument with its own self-training model. It explains in plain English what moved each market and why, and it estimates how far upcoming economic news usually moves each symbol, measured on your broker's own price history. $99 instead of $499. 10 copies left at this price. One time purchase life-time access
All re

Gold Compass Lite is a premier multi-timeframe trend and signal system engineered specifically for XAUUSD (Gold) on the M15 chart . It acts as a comprehensive diagnostic dashboard, synchronizing momentum while shielding your capital. ️ THE UNFAIR ADVANTAGE Unlike 99% of indicators that print delayed arrows based on simple moving averages, Gold Compass Lite features an advanced, data-driven Fair Value Gap (FVG) probability model tested on over 20,000 historical gaps. It automatically calculates

Manzano Index Intelligence Analysis of the underlying constituents of the Nasdaq 100, S&P 500 and Dow Jones 30 for MetaTrader 5 It is not just about knowing where an index is moving, but understanding what is driving that move. BEFORE BUYING OR TRYING: CHECK YOUR BROKER The indicator requires your broker to provide both the index CFD and CFDs for its constituent stocks within the same MT5 account. Having a Nasdaq 100, S&P 500 or Dow Jones 30 CFD does not necessarily mean the broker also offers i

AURUM Line Alerts [SNAP] [Please leave a review if you find the indicator useful and how we can improve it further] Description AURUM Line Alerts gives you four horizontal price alert lines that place themselves on the levels where price has repeatedly turned. Instead of drawing lines by hand and setting alerts one by one, attach the indicator and the lines appear on the strongest aligned tops and bottoms: two above price and two below. Drag any line to a new price at any time, and its alert re-

Stoch Zone Pro n'est pas juste un énième oscillateur, c'est une véritable station d'analyse complète directement sur votre graphique. Nous avons repris la mécanique classique de retour à la moyenne (mean-reversion) et résolu son principal problème : l'énorme quantité de faux signaux lors de forts mouvements directionnels des prix. Grâce à l'algorithme propriétaire intégré Advanced Trend Filter (Filtre de Tendance Avancé), l'indicateur analyse en continu l'élan (momentum) caché du marché. Vous ne

Orderflow Footprint with Delta and Trade Bubbles est un indicateur de flux d'ordres pour MetaTrader 5 (MT5). Il transforme chaque bougie en un graphique d'empreinte, également appelé graphique en cluster, qui affiche le volume échangé à chaque niveau de prix, ventilé entre volume d'achat (ask) et volume de vente (bid). Chaque bougie indique également son delta, son profil de volume et son point de contrôle. Une fenêtre de bulles affiche les transactions en temps réel, permettant ainsi de suivre

BRSI BUY SELL INDICATOR BB RSI Histogram Scanner – Multi-Symbol Bollinger + RSI Confluence Scanner with Trade Ticket A professional MetaTrader 5 indicator that combines a Bollinger Bands state filter with an RSI histogram, multi-timeframe confluence, daily bias, and a live multi-symbol scanner. It surfaces high-quality breakout signals across major pairs on M15–H4, draws clear trade boxes with calculated risk levels, and provides a one-click trade ticket so you can act on verified setups witho

EN
LumenSMC draws Smart Money Concepts zones, structure and teaching drawings where you click. It does not find zones by itself, does not trade and gives no signals.
What you can build
- SMC zones: Order Block (bullish/bearish), Order Block with sweep, Fair Value Gap with a 50% CE line, Liquidity and EQH/EQL.
- Structure: Swing (HH/HL/LH/LL), BOS/CHoCH, Premium/Discount with a 50% line, Fibonacci, R:R box.
- Drawing: line, rectangle, triangle, ellipse.
- Patterns: zigzag, Head and Shoul

Gold Xauusd Structure Compass Mt5 is a MetaTrader 5 indicator designed for discretionary gold trading analysis. It identifies sweep-and-reclaim and trend-pullback setups on XAUUSD, combining closed-candle confirmation, completed context candles and volatility filters. The indicator brings setup markers, market context and reference stop-loss and take-profit levels into one chart interface. It supports manual decision-making and does not open or manage trades. Two setup models The sweep-and-recla

Time Average Lines draws four averages that are measured by time, not by the number of bars. When you switch timeframes, each line still averages the same length of time. The main line (3) averages how far price had moved from the day's open at the same clock time on past days, and the rest of today is shown as a dotted path that joins those past averages. The path is a summary of the past, not a forecast.
THE FOUR LINES - (1) Time MA: average close of the bars that started within the last N m

Elevate your MetaTrader 5 strategy with PnTrend , a precision trading indicator engineered to capture high-probability market shifts with absolute clarity . Designed for algorithmic traders and discretionary chart analysts alike, PnTrend cuts through market noise by seamlessly combining multi-timeframe candlestick pattern recognition with real-time trend confirmation Core Architecture & How It Works PnTrend scans historical and real-time tick data to identify high-accuracy reversal and continuat

QPC OSCILLATOR | INSTITUTIONAL TARGET AND VOLATILITY ENGINE
Precision Quantitative Trading System with Real-Time Dynamic Target Projections (ENTRY, SL, TP1, TP2, TP3)
OVERVIEW
QPC OSCILLATOR is a professional institutional-grade quantitative indicator engineered for MetaTrader 5. Built for discerning traders who demand mathematical precision over emotional guesswork, QPC Oscillator dynamically identifies structural market turning points, high-probability momentum breakouts, and trend exhaus

Multi MA Ribbon Crossover and Pullback This indicator draws nine exponential moving averages as one ribbon on the price chart. Every line is coloured by its own slope, so the ribbon shows at a glance which part of the trend is still rising and which part has already turned. On top of the ribbon it marks two kinds of signals: a crossover of the fastest line with the main line, and a pullback to the main line inside an established trend. All signals are confirmed on closed bars only. How The Ribbo

Auto Trendline Channel MTF draws trendlines, parallel channels and horizontal support / resistance automatically from confirmed swing highs and lows. For each line it records the touch count, close breaks, wick breaks and retests. A table shows, for the chart timeframe and two higher timeframes, the nearest line above and below the price, the distance to it and the Dow theory direction. Touch counts and break records describe what happened on the past chart. They do not tell whether price will

This indicator automatically detects and visualizes Fair Value Gaps (FVGs) from a user-selected timeframe directly on your MetaTrader 5 chart. It plots color-coded rectangles to highlight unmitigated bullish and bearish gaps, dynamically shrinking or removing these zones in real-time as ongoing price action fills them. Crucially, it allows you to project higher timeframe gaps onto lower timeframe charts—such as viewing a 1-hour FVG on a 5-minute chart or a 4-hour FVG on a 1-minute chart—making i

The indicator maps market structure by dynamically tracking significant Swing Highs and Swing Lows using high-end engines to pinpoint massive pools of resting buy-side and sell-side liquidity. Because these extreme pivot points represent areas where retail stop-losses and breakout orders naturally cluster, the indicator instantly projects a "Swing Box" anchored to the exact high or low the moment a valid swing is confirmed. This creates a highly precise, unmitigated Point of Interest (POI) that

MNFM Gold Conditions MT5
A read-only Gold/USD technical context indicator. It combines completed H1 and M15 candle readings with live spread information in one chart panel. It does not execute trades or estimate a probability of profit.
Dashboard - H1 direction from close versus EMA50, EMA50 versus EMA200, EMA50 slope and directional movement (+DI/-DI). - H1 ADX14 strength and whether the reading is rising or falling. - M15 momentum: three-bar close change normalized by ATR14, confirmed by RSI

This indicator automatically identifies and highlights the market's opening range by drawing a dynamic visual box around the highest and lowest prices formed during the initial minutes of the trading session, complete with a built-in alert system that notifies traders the moment price crosses these boundaries. Relying specifically on the 15-minute Opening Range Breakout (ORB) is a highly effective strategy because the first 15 minutes of the trading day absorb the chaotic influx of overnight ins
Découvrez comment acheter un robot de trading sur le MetaTrader Market, le magasin d'applications de la plateforme MetaTrader.
e système de paiement de MQL5.community prend en charge les transactions via PayPal, les cartes bancaires et les systèmes de paiement populaires. Nous vous recommandons vivement de tester le robot de trading avant de l'acheter, pour une meilleure expérience client.

Vous manquez des opportunités de trading :
- Applications de trading gratuites
- Plus de 8 000 signaux à copier
- Actualités économiques pour explorer les marchés financiers
Inscription
Se connecter
Vous acceptez la politique du site Web et les conditions d'utilisation
Si vous n'avez pas de compte, veuillez vous inscrire