 MetaTrader 5
 Experts
 지표
 라이브러리
 유틸리티
 위젯
 규칙
MetaTrader 5용 기술 지표 - 223
 기술 지표의 시그널은 주식 및 외환 시장에서 거래를 개시 및 종료하는 데 중요한 역할을 합니다. 지표의 본질은 미래의 가격 변화를 예측하기 위한 금융 시그널 값의 수학적 변형입니다.
기술 지표를 테스트하여 시장 행동과 그로 인한 이익을 더 잘 예측할 수 있습니다.

Mega MNFM MT5
Mega MNFM brings ten technical readings, a seven-timeframe trend map, regional session clocks and account-deal statistics into one MetaTrader 5 dashboard.
Technical dashboard RSI, MACD histogram, Stochastic, EMA trend, ADX, Bollinger Bands, an asset technical Fear & Greed proxy, an indicative synthetic dollar basket, ATR rank and OBV flow. Readings use completed candles. The timeframe map covers M1, M5, M15, M30, H1, H4 and D1. The dashboard includes a directional summary, trend

Volume Anomaly Candle Radar — MT5 Indicator Volume Anomaly Candle Radar is a price-action and volume analysis indicator for MetaTrader 5. It compares each completed candle's trading activity and price structure with a rolling baseline of older candles, helping traders identify unusually active directional moves and high-activity candles with limited price movement. Instead of treating every volume spike as a trading signal, the indicator separates three observable market conditions and displays

Synthetic Machine – SuperTrend Cloud, Trade Levels & Trading Coach A complete trend-following and trade management indicator built for Synthetic Indices Synthetic indices move around the clock. There are no traditional market sessions to wait for, which means your analysis tools need to be just as flexible. Synthetic Machine combines a clean SuperTrend system, automatic trade levels, multi-timeframe trend analysis, a trading coach dashboard and built-in backtesting into one practical MT5 indicat

THV Camarilla Pivot MT5 – Reversal, Breakout & Target Levels
Overview THV Camarilla Pivot MT5 is a technical indicator that automatically calculates and displays Camarilla Pivot levels on your MetaTrader 5 chart. Based on the previous candle of the selected timeframe, the indicator plots eight key levels: H3, H4, H5, H6, L3, L4, L5, and L6. These levels help traders identify potential reversal zones, breakout areas, and price targets. The indicator also provides customizable line colors, styles

MT5용 Crypto_Forex 지표 "MFI 속도", 리페인트 없음. - 이 지표는 물리학 방정식을 기반으로 계산됩니다. MFI 속도는 MFI 자체의 1차 미분값입니다. - Money_Flow_Index(MFI)는 가격과 거래량 데이터를 사용하여 과매도 및 과매수 구간을 식별하는 기술적 오실레이터입니다. - MFI 속도는 주요 추세 방향으로 모멘텀 진입을 스캘핑하는 데 유용합니다. - 표준 EMA(그림 참조)와 같은 적절한 추세 지표와 함께 사용하십시오. - MFI 속도 지표는 MFI 자체의 방향이 얼마나 빨리 변하는지를 보여주며, 매우 민감합니다. - MFI 속도 지표 값이 0보다 작으면 속도는 음수이고, 0보다 크면 속도는 양수입니다. - 이 지표에는 모바일 및 PC 알림 기능이 내장되어 있습니다. 여기를 클릭하여 고품질 트레이딩 로봇과 지표를 확인하세요! 본 제품은 MQL5 웹사이트에서만 제공되는 정품입니다.

THV SMC Plus MT5 – Smart Money Concepts & Multi-Timeframe Analysis
Overview THV SMC Plus MT5 is a comprehensive Smart Money Concepts (SMC) indicator designed to help traders analyze market structure, identify potential liquidity zones, and recognize high-probability trading setups directly on MetaTrader 5. The indicator combines multiple price-action and institutional trading concepts into one customizable tool, including Break of Structure (BOS), Change of Character (CHoCH), Order Blocks (OB)

RatioFang은 차트에서 하모닉 패턴을 자동으로 찾아 PRZ(잠재 반전 구간)와 진입·손절·익절 가이드를 그려 줍니다. 표시 전용 인디케이터로, 주문을 내거나 수정·청산하지 않습니다. 감지하는 패턴 Gartley, Bat, Alt Bat, Butterfly, Crab, Deep Crab, ABCD, Cypher, Shark, 5-0, Three Drives 등 11가지(상승·하락 모두). 각 패턴은 널리 알려진 피보나치 비율과 대조하며, 허용 오차를 조정할 수 있습니다. 차트에 표시되는 내용 X-A-B-C-D 각 구간과 구간별 비율 PRZ 구간, 중심선, 무효화 선 진입·손절 및 3단계 익절 가이드 선과 각 목표의 손익비 오른쪽 위에 패턴 이름(상승/하락) 왼쪽 위 정보 패널: 패턴, 비율 정확도, PRZ 범위, 현재가와 PRZ까지의 거리, 리스크(pips), 랏 크기 가이드 비율 정확도 패널에 이상적인 비율과의 차이를 Ideal/Good/Fair/Edge of tolerance

Inside Bar Breakout Retest Radar
Inside Bar Breakout Retest Radar is a price-action indicator for MetaTrader 5. It identifies completed inside candles, keeps the original mother bar boundaries fixed, and tracks a setup through a candle-close breakout and an optional first retest.
The indicator is designed for traders who study consolidation and the reaction of price around previously established levels. It shows chart events rather than placing orders.
Features
- Inside bar detection using

> SMC Vision Pro finds price structures using fixed, documented rules. They are reference points for analysis. They do **not** predict reversals and are not trading signals. Every rule below can be checked by hand on a chart.
---
## 1. Signal timing and repainting
| Item | Behaviour | |---|---| | Evaluation point | Every detection runs on **closed bars only**. The forming bar (index `rates_total-1`) is never part of a detection. | | Can a signal change before the candle closes? | **No.** BOS

️ UTS Prime Zones — The Ultimate Multi-Timeframe Support & Resistance Engine UTS Prime Zones is an advanced, institutional-grade indicator that automatically maps out the most critical Support and Resistance zones across two different timeframes simultaneously . Stop drawing lines by hand. Stop guessing where the market will reverse. UTS Prime Zones uses a sophisticated fractal and ATR-based algorithm to identify high-probability "zones" (areas, not just single lines) where price is highly l

Inversion FVG는 공정가치 갭(3개 캔들로 만들어진 불균형)을 찾아내고, 그 갭이 무너지는 순간을 거래하는 인디케이터입니다. 캔들 몸통이 갭을 넘어 마감하면 갭이 "반전"되어 지지 또는 저항이 됩니다. 가격이 재테스트 후 거부되면 화살표와 함께 진입, 손절, TP1, TP2 레벨이 바로 표시됩니다.
작동 방식 1. 상승 또는 하락 FVG를 감지해 기본 구간으로 표시합니다. 2. 캔들 몸통이 구간을 넘어 마감하면 구간이 반전됩니다. 3. 첫 재테스트 + 거부 마감 = 신호 화살표 (파란 위쪽 = 매수, 빨간 아래쪽 = 매도). 4. 손절은 구간 바깥에 ATR 여유를 더해 설정합니다. TP1과 TP2는 R 배수(기본 1R, 2R)입니다.
기능 - 마감된 캔들만 사용: 화살표는 다시 그려지지 않으며 캔들 마감 후 움직이지 않습니다. - 진입, SL, TP1, TP2 선은 가격이 도달하면 거기서 멈춥니다. - 50%(CE) 선, 정보 패널, 활성 구간 카운터. - 팝업, 푸시

H4 Range Setups Indicator by SaintEmma Fx Systems. It is a multi-pair scanner built on one idea: the first H4 range of the New York day, and what happens when price breaks it and fails. It watches your whole Market Watch list, ranks the freshest setups in a dashboard, and prices each one with entry, stop, target and a lot size for 1% risk.
WHAT THIS INDICATOR DOES Early-session range breaks often fail. This indicator is built to catch that failure. It marks the opening H4 range of the NY day,

Malaysian SnR Precision IndicatorThe Ultimate Institutional Support & Resistance System for Forex & Synthetic Indices Take your trading to institutional precision with Malaysian SnR — an advanced, logic-driven indicator designed to identify high-probability Buy & Sell reaction levels on every timeframe. Built for traders who demand absolute transparency, Malaysian SnR completely eliminates lag, repainting, and late entries. Key Features & Highlights 1. 100% Non-Repainting & Closed-Bar Precision

Elliott Wave Auto Count labels Elliott waves automatically on four degrees at the same time: the base degree and the three degrees above it. It follows the rules and guidelines of "Elliott Wave Principle" (Frost & Prechter). For the current wave it also shows a price x time target zone and an invalidation level.
HOW IT WORKS 1. Swings: five ATR(100)-based zigzags. Each higher degree uses a larger swing threshold. The finest zigzag is hidden and is used only to count the sub-waves inside each l

Tick Volume Dots — Uptick/Downtick Confirmation Indicator
A simple visual filter to confirm momentum, spot exhaustion, and add tick-level confluence to your existing strategy. Description:
"Read Real Order Flow, Not Just Candle Color" — shows a run of red dots quietly warning of a reversal before the candles confirm it, then the flip to green dots at the exact turn. "Confirm Scalp Entries in Seconds" — pairs the on-chart dots with the histogram Sub window, showing how a burst of green dots + a

SBR / RBS FLIP INDICATOR (MT5) The Ultimate Non-Repainting Support & Resistance Flip Engine Dominate Forex Pairs & Catch Volatile Spikes on Synthetic Crash & Boom Indices! Why The SBR / RBS Flip Indicator Changes Everything Most Support & Resistance indicators repaint, lag, or give late signals after the move has already happened . The SBR / RBS Flip Indicator was specifically engineered for precision traders who need absolute transparency and zero-lag alert speed . Instead of showing messy, sub

Neuron Chart is a complete charting workspace for MetaTrader 5 from Neuron Systems. It turns the standard chart into a modern, web-style workspace: a top toolbar, a drawing toolbar on the left, a panel bar on the right, indicator panes inside the chart, price alerts, bar replay, a watchlist, a screener, the economic calendar and more, all on the chart you already use. It is an indicator for chart analysis only: it draws on the chart, it does not place, modify or close trades, it does not send or

Zone Risk Planner turns support and resistance zones into a complete trade plan: where to enter, where to place the stop loss (SL), where the take profit (TP) goes and how many lots match your risk. It also shows the risk of your whole account, the market regime on several timeframes and a multi-symbol scanner, all in one indicator.
It is a planning and risk-management tool. It does not give buy or sell signals and it does not open, modify or close trades.
Support and resistance zones
- Calcu

Desi Bulls PA King Pro — Pure Naked Price Action Sniper Indicator Desi Bulls PA King Pro is an institutional-grade, 100% NON-REPAINTING Naked Price Action indicator designed for precision scalping on Gold (XAUUSD) and Bitcoin (BTCUSD) on the M5 and M15 timeframes. Unlike conventional indicators that clutter your chart with lagging moving averages, RSI, or stochastics, PA King Pro uses pure candlestick geometry, fractal liquidity sweeps, and macro trend flow to identify high-probability instit

Dow Structure MTF shows the Dow theory trend structure of five timeframes at the same time, using the pullback low / rally high approach that is common among Japanese traders. For each timeframe you see whether the trend is up, down or range, which price would change it, and how far the current price is from that level. Only closed bars are used, so a confirmed result never changes afterwards (no repaint).
WHAT YOU SEE - Table of five timeframes (M15, H1, H4, D1, W1 by default, all changeable)

A pair moves because one of its two currencies moved. EURUSD falling can mean a weak euro or a strong dollar, and the two call for different pairs. Checking that by hand means opening a dozen charts.
Currency Strength Desk ranks all nine currencies — AUD, CAD, CHF, EUR, GBP, JPY, NZD, USD and gold — on one 0 to 100 scale, across 29 pairs, and keeps the ranking live on a single panel.
WHAT EACH COLUMN SHOWS
Strength — where each currency stands from 0 to 100, built from every pair it appears

Smart Forex Trend and Signal Indicator
Smart Forex Trend and Signal Indicator is a technical analysis tool designed to help traders identify market trends and potential buy and sell opportunities directly on their trading charts.
Its user-friendly design makes it suitable for beginners and experienced traders who want a clearer view of market direction and price movements.
Key Features
* Trend Analysis: Helps identify potential bullish and bearish market trends. * Buy and Sell Signals: Disp

Description & Core Concept Professional Extra Triangle Scalper v18.2 is an advanced geometric analysis and multi-asset correlation indicator engineered after years of testing on live market conditions. Built upon dynamic vector scanning of triangle structures and 3-asset algorithmic cross-validation, it effectively filters market noise to deliver high-precision price projections. Risk & Money Management Money Management is the foundation of long-term trading consistency. Always calculate positi

Fibo Price Time Zones combines Fibonacci price levels with Fibonacci time targets and draws them on the chart as boxes (price x time zones). It helps you organize which price areas to watch and roughly when. Where boxes from several waves and from higher timeframes overlap, the area is emphasized in three levels. Base waves are built only from confirmed swings, so a confirmed box does not move afterwards (see the conditions below).
WHAT IT DRAWS - Price levels: retracement 38.2 / 50 / 61.8 / 7

RSI Divergence Structure Confirmation RSI Divergence Structure Confirmation is a MetaTrader 5 indicator that combines RSI divergence analysis with confirmed price pivots and a subsequent market-structure break. It is designed for traders who want to distinguish an early divergence observation from a later, price-confirmed signal. How the Analysis Works First, the indicator identifies confirmed price swing highs and lows and compares the RSI values at eligible pairs of pivots. The detection proc

Product Title Multi-Stage Fibonacci Structure – Wave-Based Support & Resistance English Description A Fibonacci structure designed to identify high-value price levels by preserving the Fibonacci relationships created during previous market waves. Instead of drawing Fibonacci levels only from the most recent high and low, this method keeps the important levels created during previous 1st to 5th wave structures and uses them as reference points for future price action. The key concept is simple: P
FREE

LIGHTHOUSE — 시장 구조를 한눈에. 리페인트 없음. LIGHTHOUSE는 확정된 스윙 고점과 저점으로 가격 구조를 읽고, 차트에 깔끔하게 표시합니다. 재량 트레이더가 진입 전에 묻는 세 가지 질문에 답합니다. 상위 시간 프레임은 어느 방향인가? 현재 차트는 어느 방향인가? 중요한 가격대는 어디인가?
판단을 돕는 도구로, 거래를 하거나 가격을 예측하지 않습니다. 왜 "LIGHTHOUSE"(등대)인가?
등대는 배에 길을 알려 주고 암초를 경고하지만, 키를 잡는 것은 선장입니다. LIGHTHOUSE도 차트에서 시장의 방향과 가격이 반응하기 쉬운 구간을 보여 줍니다. 결정은 여러분의 몫입니다. 작동 방식 스윙 고점·저점은 봉이 마감된 뒤에만 확정됩니다. 한 번 표시된 라벨은 움직이거나 사라지지 않습니다. 구조 돌파는 꼬리가 아니라 종가로 판단합니다. 방향은 마지막 구조 돌파의 방향과 최근 두 고점·저점의 배열(다우 이론)로 정합니다. 같은 로직을 상위 시간 프레임(기본 H1)에도

프롭 펌 펀딩 계좌 챌린지의 손실 한도까지 여유가 얼마나 남았을까요? Prop Floor Monitor는 이를 차트에서 한눈에 보여 줍니다. 일일 손실 하한선, 총 손실 하한선, 그중 어느 쪽이 더 가까운지, 그리고 이 종목의 보유 포지션이 어느 가격에서 하한선에 닿는지를 보여 줍니다. 일일 리셋은 선택한 시간대를 따르며 서머타임도 반영합니다. 리셋 시각은 2024년부터 2027년까지 18,688개 시점에서 IANA 시간대 데이터베이스와 대조했으며, 모든 시간 변경을 포함해 차이가 없었습니다. 모든 숫자는 출시 전마다 별도의 독립 구현과 대조해 검증합니다. 기능 패널은 현재 에퀴티와 하한선까지의 여유를 에퀴티 대비 비율로 보여 주고, 일일 하한선과 일일 한도의 사용 비율, 총 손실 하한선과 그 사용 비율, 하한선까지의 여유 금액과 이를 정하는 한도, 그리고 당일 에퀴티 저점과 그 시각을 보여 줍니다. 초록색은 한도의 절반 넘게 남았음을, 주황색은 4분의 1에서 절반 사이, 빨간색은
FREE

Overview Quantum Levels is a technical indicator for MetaTrader 5. It calculates market structure zones, liquidity nodes, and a multi-layer price consensus, and displays these elements directly on the chart. Displayed elements The indicator provides the following elements: 1. Market structure zones based on swing highs and lows, indicating active and broken structural areas. 2. Liquidity node areas and shift lines derived from structural breaks. 3. Color-coded consensus candles representing p

크리스마스 세일 : ALL PRODUCTS 모두 $30 SMC Scanner 는 단순한 인디케이터가 아니라 Smart M0ney Concept (SMC) 에 기반한 종합적인 트레이딩 분석 시스템 입니다. 이 방법론은 트레이더들이 대형 금융기관(Smart M0ney )의 가격 움직임을 이해하고 활용할 수 있도록 합니다. 고급 기능을 갖춘 SMC Scanner 는 복잡한 분석을 실행 가능한 트레이딩 인사이트로 단순화합니다. 왜 SMC Scanner를 선택해야 할까요? 시장 행동 이해: SMC Scanner는 Smart M0ney의 동작을 해석하고 잠재적 거래 기회를 포착하도록 돕습니다. 리스크 감소: Order Blocks(OB), Fair Value Gaps(FVG), 유동성 구역 등 중요한 가격 지대를 식별하여 시장 함정을 피합니다. 시간 절약: 자동화된 시장 분석과 실시간 알림으로 의사결정에 집중할 수 있습니다. 다양한 기능: 모든 시간대와 통화쌍에서 작동하여 최대한의 유연성
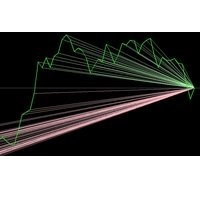
**Price Power — 가격 위치로 보는 매수/매도 힘**
Price Power는 현재가 대비 가격이 위아래로 얼마나 공간이 있는지 한눈에 보여줍니다. 최근 캔들 중 현재가보다 위에 있는 수(매수 힘)와 아래에 있는 수(매도 힘)를 세어, 둘 다 숫자와 선으로 차트에 표시합니다.
가격 위 캔들이 아래보다 훨씬 많으면 하방 공간과 압력이 크고, 아래가 훨씬 많으면 상방으로 기웁니다. 패널은 두 값과 명확한 Buy / Sell / Wait 상태를 보여줍니다.
**표시 내용:** - Buy 값 = 현재가보다 위에 있는 최근 캔들 수 - Sell 값 = 현재가보다 아래에 있는 최근 캔들 수 - 센 각 캔들로의 선(두 스타일 중 선택) - 패널: 이름, 조회 개수, Buy, Sell, 신호 상태
**두 가지 그리기 스타일(선택):** - 수평 레벨 — 각 캔들의 가격 레벨에 선 - 레이 — 각 캔들에서 현재가로 모이는 선
**신호와 알림:** - 한쪽이 다른 쪽의 두 배를 넘

This is the test product. Please, DO NOT BUY IT! This is the test product. Please, DO NOT BUY IT! This is the test product. Please, DO NOT BUY IT! This is the test product. Please, DO NOT BUY IT! This is the test product. Please, DO NOT BUY IT! This is the test product. Please, DO NOT BUY IT! This is the test product. Please, DO NOT BUY IT! This is the test product. Please, DO NOT BUY IT!
MetaTrader 플랫폼 어플리케이션 스토어에서 MetaTrader 마켓에서 트레이딩 로봇을 구매하는 방법에 대해 알아 보십시오.
MQL5.community 결제 시스템은 페이팔, 은행 카드 및 인기 결제 시스템을 통한 거래를 지원합니다. 더 나은 고객 경험을 위해 구입하시기 전에 거래 로봇을 테스트하시는 것을 권장합니다.
