SuperIndices
- Indicadores
-
Stanislav Korotky
 Trading is just my hobby. I'm working in IT industry. So developement of experts, indicators, and script is not a problem at all to me. Wide range of technologies are used: MQL4, MQL5, system and applied programming, web-services, neural networks and more.
New: - Versión: 1.1
- Activaciones: 5
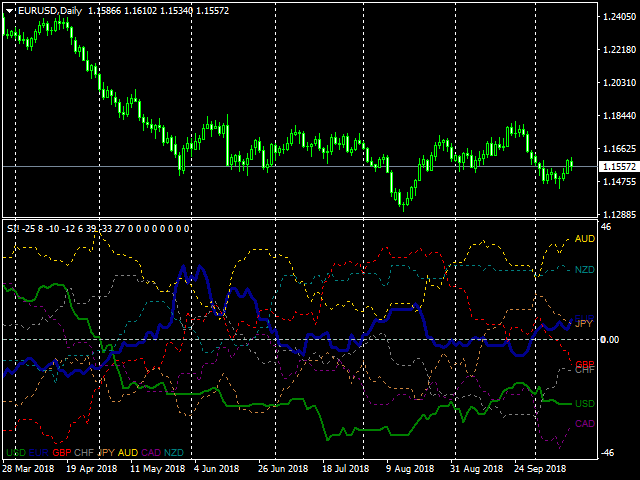
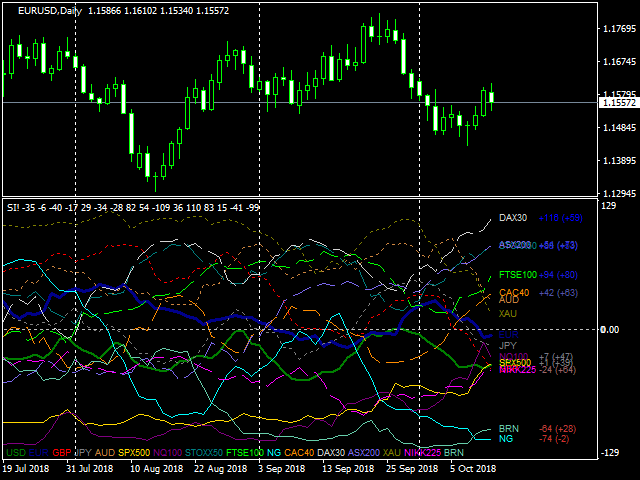
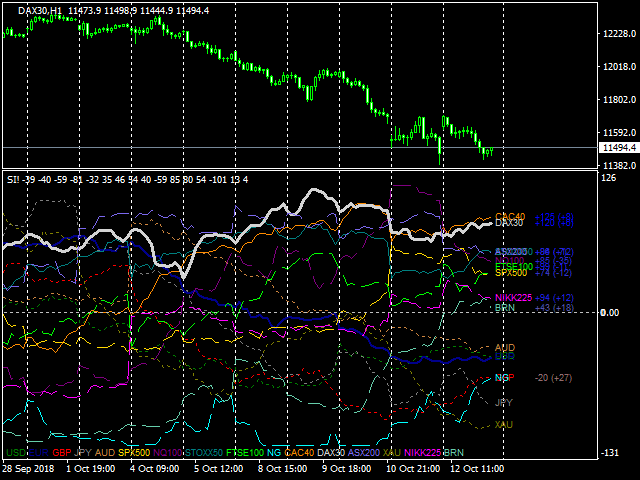
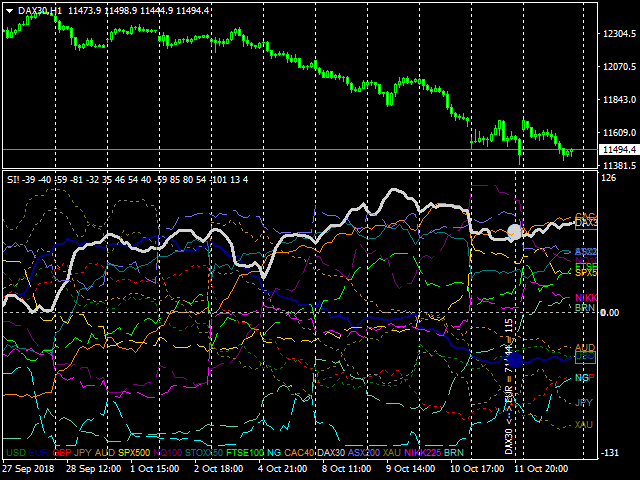
Este indicador de clúster es una nueva generación de CCFpExtraSuperMulti. Se ha mejorado de manera que permite procesar clusters mixtos, en los que se pueden incluir símbolos de varios mercados. Por ejemplo, puede manejar Forex, índices, CFDs, spot al mismo tiempo. El número de líneas visibles ha aumentado a 16. Se puede activar una regla interactiva para medir la fuerza de las señales en el historial.
El indicador crea un conjunto de indicadores de clúster incrustados (CCFpExtraIndices) con períodos cuidadosamente seleccionados y combina sus resultados utilizando algoritmos inteligentes de ponderación y normalización. Se pueden especificar hasta 15 instrumentos.
Las señales son: cuanto más alto sea el ticker/divisa, más fuerte será la señal para comprarlo, cuanto más bajo sea el ticker/divisa, más fuerte será la señal para venderlo. El plan más fiable es comprar los más altos y vender los más bajos.
Las líneas de un ticker y/o una divisa, que corresponden al símbolo de trabajo actual, se muestran gruesas. Por ejemplo, en un gráfico DAX30 la línea más pesada es DAX30, un poco menos pesada - EUR, ya que es la moneda de cotización para DAX30. Otros índices, CFD, materias primas con la misma moneda de cotización se muestran como líneas sólidas delgadas (en nuestro caso, como STOXX50, CAC40). Otros índices, CFD y materias primas (con diferentes monedas de cotización) se muestran como líneas discontinuas. El resto de divisas son líneas de puntos.
A la derecha de las líneas hay etiquetas con los nombres del ticker/moneda y la intensidad de la señal, que se muestran como +-N(+-D), donde N - diferencia entre el ticker y su moneda de cotización, D - cambio medio de la intensidad en el último periodo (24 horas o 12 barras, lo que sea mayor). Cuanto mayor sea el valor positivo, más brillante será el color azul. Cuanto mayor sea el valor negativo, más brillante será el color rojo. La mejor oportunidad es cuando tanto la señal como su cambio tienen la misma dirección. La fuerza de la mitad de la escala o más aumenta las posibilidades.
Haga clic consecutivamente en 2 etiquetas a la derecha de las líneas para activar la regla (línea vertical). Mueva el cursor del ratón sobre las barras del historial para ver la señal entre las etiquetas seleccionadas en el pasado (resaltadas por la regla). Vuelva a hacer clic en las etiquetas para ocultar la regla.
Parámetros:
- Instruments - lista de instrumentos separados por comas, máximo 15; los instrumentos pueden no tener una divisa común - el indicador intentará encontrar la regla de conversión a través de la divisa por defecto (DefaultBase, ver más abajo) analizando la divisa base (para símbolos Forex) y la divisa de cotización; el conjunto de instrumentos por defecto incluye todas las divisas principales EURUSD,GBPUSD,USDCHF,USDJPY,AUDUSD,USDCAD,NZDUSD; por favor, tenga en cuenta que el NZDUSD puede faltar en algunos servidores demo, así que no olvide editarlo según corresponda;
- MA_Method - método de media móvil, por defecto es lineal ponderada;
- Price - tipo de precio aplicado a la media móvil, por defecto es precio ponderado;
- All_Bars - número de barras para calcular, por defecto 1000; 0 significa todas las barras disponibles (no recomendado);
- BarByBar - false significa recalcular la barra 0 en cada tick, true (por defecto) significa calcular la barra sólo una vez (en el tick 1 y cuando se cierra);
- DefaultBase - moneda común por defecto a utilizar; se utiliza sólo si la base no puede ser detectada automáticamente.
- Prefix, Suffix - prefijo y sufijo opcionales, utilizados en los nombres de los símbolos (si son utilizados por su broker); por defecto - vacío;
- Indicator_Prefix - prefijo común para todos los objetos del indicador, por defecto "S2_"; debe ser único para cada instancia del indicador aplicado en el mismo gráfico.
El usuario no ha dejado ningún comentario para su valoración