• Tipo del indicador
  • Precio
     - 
  • Resetear
Ve el tutorial sobre el Market en YouTube
Cómo comprar un robot comercial o indicador
Inicia el robot en el
hosting virtual
Pruebe un indicador/robot comercial antes de comprarlo
¿Quieres ganar en el Market?
Cómo ofrecer un producto para que lo compren

Indicadores técnicos de pago para MetaTrader 5

icon Usando como base las señales de los indicadores técnicos, usted podrá tomar decisiones sobre la apertura y el cierre de transacciones en fórex y los mercados de valores. La esencia de los indicadores consiste en la transformación matemática del precio y/o el volumen de un instrumento financiero para pronosticar los cambios de precio en el futuro. Ponga a prueba los indicadores técnicos para predecir mejor el comportamiento del mercado y ganar dinero con ello.
El panel de alertas RSI / TDI le permite monitorear los RSI a la vez (seleccionables por usted) en cada par principal que opere. Puedes usarlo de dos maneras: 1. Seleccione varios marcos de tiempo y el guión le mostrará cuándo hay varios marcos de tiempo que se extienden más allá de las condiciones comerciales normales. Un gran indicador de que el precio ha subido con fuerza recientemente, ya que ha alcanzado un nivel de sobrecompra o sobreventa en múltiples marcos de tiempo, por lo que p
Matrix Arrow Indicator MT5
Juvenille Emperor Limited
5 (14)
Matrix Arrow Indicator MT5   es una tendencia única 10 en 1 que sigue un indicador   100% sin repintado   de marcos temporales múltiples que se puede usar en todos los símbolos/instrumentos:   divisas ,   materias primas ,   criptomonedas ,   índices ,   acciones .  Matrix Arrow Indicator MT5  determinará la tendencia actual en sus primeras etapas, recopilando información y datos de hasta 10 indicadores estándar, que son: Índice de movimiento direccional promedio (ADX) Índice de canales de prod
Este indicador de panel de divergencia de múltiples marcos de tiempo y múltiples símbolos envía una alerta cuando se han identificado una o dos divergencias diferentes en varios marcos de tiempo y no en divergencias individuales. Se puede utilizar con todos los marcos de tiempo de M1 a MN. Se pueden mostrar un máximo de 9 períodos de tiempo en el panel de control al mismo tiempo. Es posible habilitar el filtro de tendencia de bandas de media móvil, RSI o Bollinger para filtrar solo las configura
Divergence indicator 10 different indicators. Finding and displaying classic and hidden divergences. Indicators in which divergences are searched: MACD MACD Histogram; RSI; Stochastic; CCI; momentum; OBV; VWmacd; Chaikin Money Flow; Money Flow Index. This is a replica of the indicator from the   tradingview   resource, adapted for the MT5 terminal. MT4 version available here:  https://www.mql5.com/en/market/product/87846 Settings: Bars in history for analysis - number of bars for analysis
Very powerful indicator! converted from TradingView with upgraded alerts and added notifications.  Ideal use in EAs. Use as a supplementary Indicator to confirm your entries, but it is as good on it's own. The indicator consists of 3 different Trend Meters and a  2 Trend Bars which are used to confirm trend How to Use: The more Trend meters are lit up the better =>>   -more GREEN COLOR at one bar means more confirmation to open buy  trade, - more RED COLOR signals for one bar = more
Este indicador de marco de tiempo múltiple y símbolo múltiple puede identificar las siguientes 5 cruces: cuando una media móvil rápida cruza una línea de media móvil lenta. cuando el precio ha alcanzado una única media móvil (cerrado por encima / por debajo o simplemente rebotando). cuando ha aparecido una formación de media móvil triple (las 3 MA: s en alineación consecutiva) cuando la línea principal del MACD cruza la línea de señal. cuando la línea de señal cruza la línea MACD cero (0). Combi
Currency RSI Scalper MT5 es un indicador profesional basado en el popular indicador Relative Strength Index (RSI). Aunque el indicador RSI funciona bien para un intervalo del mercado, no genera señales rentables cuando cambian las condiciones del mercado y, por lo tanto, produce señales incorrectas que resultan en grandes pérdidas. ¿Ha pensado alguna vez en un indicador RSI adaptativo que se adapte a las condiciones del mercado? El indicador presentado implementa un algoritmo de optimización qu
ADXW Cloud Pro
Shahabeddin Baset
Full implementation of Directional Movement System for trading, originally developed by Welles Wilder, with modifications to improve profitability, to reduce the number of unfavorable signals, and with Stop Loss lines. No re-paint Features Buy/sell signals displayed on the chart Stop levels visually indicated on the chart Profit-taking points presented in the indicator window Exit points for unfavorable positions presented in the indicator window Signal confirmation through high/low swing c
RSI Divergences Scanner MT5
Reza Aghajanpour
4.7 (10)
** All Symbols x All Timeframes scan just by pressing scanner button ** ***Contact me after purchase to send you instructions and add you in "RSI scanner group" for sharing or seeing experiences with other users. Introduction RSI divergence is a main technique used to determine trend reversing when it’s time to sell or buy because prices are likely to drop or pick in the charts. The RSI Divergence indicator can help you locate the top and bottom of the market. This indicator finds Regular diver
Este indicador de marco de tiempo múltiple e indicador de símbolo múltiple identifica patrones dobles superior / inferior, cabeza y hombro, banderín / triángulo y bandera. También es posible configurar alertas solo cuando se ha producido una ruptura del escote / triángulo / asta de bandera (ruptura del escote = señal confirmada para arriba / abajo y cabeza y hombros).       El indicador también se puede utilizar en modo de gráfico único. Lea más sobre esta opción en el producto   blog . Combinad
As it name implies, this is an exaustion oscillator. However, you may wonder: what differs you from others oscillators like RSI, Stochastic, CCI etc? The difference is that ours is more powerful and accurate ! Your oscillator filters the nois e made by other oscillators, and shows you only the exact moment to enter the trade. Of course, using it alone, like any other indicator, has its risks. Ideally, reconcile it with technical analysis and/or others indicators. If you buy i t you ge t up  to 1
Currency Strength Meter is the easiest way to identify strong and weak currencies. This indicator shows the relative strength of 8 major currencies + Gold: AUD, CAD, CHF, EUR, GBP, JPY, NZD, USD, XAU. Gold symbol can be changed to other symbols like XAG, XAU etc. By default the strength value is normalised to the range from 0 to 100 for RSI algorithm: The value above 60 means strong currency; The value below 40 means weak currency; This indicator needs the history data of all 28 major currenc
KT Knoxville Divergence MT5
KEENBASE SOFTWARE SOLUTIONS
The KT Knoxville Divergence is a powerful tool that reveals unique price divergences in a financial instrument by employing a carefully crafted combination of the Relative Strength Index (RSI) and a momentum oscillator. This indicator effectively captures subtle variations in market dynamics and assists traders in identifying potentially profitable trading opportunities with greater precision. Knoxville Divergences is a type of divergence in trading developed by Rob Booker. Divergence in tradin
A useful scanner/dashboard that shows the RSI values for multiple symbols and Time-frames. It can be easily hidden/displayed with a simple click on the scanner man top left of the dashboard. You can input upper and lower RSI values and the colours can be set to show when above/below these values. The default values are 70 and 30. There are also input colours for when the RSI is above or below 50 (but not exceeding the upper/lower levels Symbols and time-frames are input separated by commas.
Ticks RSI
Andrej Nikitin
The Relative Strength Index indicator drawn using a tick chart. After launching it, wait for enough ticks to come. Parameters: RSI Period - period of averaging. overbuying level - overbought level. overselling level - oversold level. calculated bar - number of bars on the chart for the indicator calculation. The following parameters are intended for adjusting the weight of RSI signals (from 0 to 100). You can find their description in the Signals of the Oscillator Relative Strength Index section
LT Easy Trend
Thiago Duarte
4.2 (5)
Easy Trend , as the name implies, is an indicator that easily shows the prevailing trend by bringing several indicators into one. The strategy is: when all indicators point in the same direction a signal is triggered. When red, is a signal to sell, when blue, signal to buy. It is that simple :) There are a total of 9 indicators: Moving Average, RSI, CCI, Parabolic SAR, William's Range, Stochastic, MACD, ADX and Heiken Ashi. It is possible to configure each of these indicators to suit your way of
Este indicador de marco de tiempo múltiple e indicador de símbolo múltiple busca barras de alfiler, estrellas matutinas / vespertinas, envolventes, pinzas, marcas de tres líneas, barras interiores y banderines y triángulos.   El indicador también se puede utilizar en modo de gráfico único. Lea más sobre esta opción en el producto   blog .   Combinado con sus propias reglas y técnicas, este indicador le permitirá crear (o mejorar) su propio sistema poderoso. Características Puede monitorear todo
RSI Entry Points is the upgrade of the standard RSI indicator to avoid lagging. Indicator draws the clouds and the arrows to have clear picture where price is and what to wait for. Why standard RSI is lagging? because mostly we do not use it correctly and it is with very weak visual flexibility, less informativity. With my current upgrade I tried to Fix both problems same time and I got much better results and more exact entries than standard RSI has. To make yourself sure check out the screens
Difícil de encontrar y escasa en frecuencia, las divergencias son uno de los escenarios comerciales más confiables. Este indicador busca y escanea las divergencias regulares y ocultas automáticamente usando su oscilador favorito. [ Guía de instalación | Guía de actualización | Solución de problemas | FAQ | Todos los productos ] Fácil de comerciar Encuentra divergencias regulares y ocultas Admite muchos osciladores bien conocidos Implementa señales comerciales basadas en rupturas Muestra n
Most RSI
Minh Truong Pham
MOST is applied on this RSI moving average with an extra default option added VAR/VIDYA (Variable Index Dynamic Moving Average) MOST added on RSI has a Moving Average of RSI and a trailing percent stop level of the Moving Average that can be adjusted by changing the length of the MA and %percent of the stop level. BUY SIGNAL when the Moving Average Line crosses above the MOST Line LONG CONDITION when the Moving Average is above the MOST SELL SIGNAL when Moving Average Line crosses belo
Spike Dragon
Niccyril Chirindo
Spike Dragon Indicator is Specially Designed for Boom 300 and Crash 500 Indices. We decided to add the indicator after extensive testing. The strategy is Based on Supply and Demand levels, RSI ,MACD and 1 other custom indicator designed to filter out less probability signals.We accept suggestions in improving our system. Why choosing Spike Dragon : Easy Installation and compatible with MT5 Platform Onpoint Signals on M1 Timeframe making the system fast in generating Spikes Good risk Managemen
Индикатор RSI magic kjuta5 . Пользовательский   Индикатор ( RSI magic kjuta ) на основе стандартного Индикатора Силы ( Relative Strength Index, RSI ) с дополнительными настройками и функциями. К стандартной линии RSI добавлены линии максимального и минимального значения RSI на графике. Теперь можно визуально наблюдать прошедшие максимумы и минимумы RSI , а не только значения по закрытию баров, что позволяет избежать путаницы   при анализе торгов. Например, советник открыл или закрыл ордер, но
Introduction to X3 Chart Pattern Scanner X3 Cherart Pattern Scanner is the non-repainting and non-lagging indicator detecting X3 chart patterns including Harmonic pattern, Elliott Wave pattern, X3 patterns, and Japanese Candlestick patterns. Historical patterns match with signal patterns. Hence, you can readily develop the solid trading strategy in your chart. More importantly, this superb pattern scanner can detect the optimal pattern of its kind. In addition, you can switch on and off individu
This indicator combines double bottom and double top reversal chart patterns together with RSI divergence detection. Features Easily detect strong reversal signals. Allows to use double top/bottom and RSI divergence signals combined or independently. Get email and/or push notification alerts when a signal is detected. Custom colors can be used. The indicator is not repainting. Can easily be used in an EA. (see below) Inputs ENABLE Double Top - Bottom: Enable the double top - bottom indicator
Divergence Sync MT5
Pavel Verveyko
5 (1)
Divergence and Convergence are important harbingers of reversals in stock markets. The Divergence Sync indicator is designed to automatically search for divergences on a large number of indicators with different parameters. The search for divergences is carried out on these indicators: (CCI, CHO, DeMarker, MACD, MFI, Momentum, OBV, OsMA, RSI, Stochastic, WPR,   Awesome Oscillator ). To search for divergences, you can use one technical indicator or search simultaneously on any number of ind
KT XMaster Formula MT5
KEENBASE SOFTWARE SOLUTIONS
4 (2)
KT XMaster Formula is a buy & sell signal indicator that works magically on most of the timeframes and currency pairs when used correctly. The indicator uses calculations based on moving averages, RSI, and MACD. It is usually appropriate for scalping and trend trading - whether you are a novice or an experienced trader, the signals generated by this indicator are simple to understand and implement. Overview The indicator comprises green and red dots arranged in wavy lines. These dots corre
FXC iRSI-DivergencE MT5 Indicator This is an advanced RSI indicator that finds trend-turn divergences on the current symbol. The indicator detects divergence between the RSI and the price movements as a strong trend-turn pattern. Main features: Advanced divergence settings Price based on Close, Open or High/Low prices Give Buy/Sell open signals PUSH notifications E-mail sending Pop-up alert Customizeable Information panel Input parameters: RSI Period: The Period size of the RSI indicator. R
New to Binary Options Trading? You are not able to win while trading binary options? Need help with your trading? You have come to the right place! This indicator provides Put (SELL) and Call (BUY) signals for binary options on the M1-M15 timeframes. Advantages Ability to easily recognize impulsive moves. Effective and flexible combination to different trading strategies. Advanced statistics calculation following the entry point. Signals strictly on the close of a bar. Works in all symbols and
Este indicador de marco de tiempo múltiple y símbolo múltiple identifica formaciones superiores / inferiores dobles o triples o una ruptura del escote siguiente (superior / inferior confirmada). Ofrece filtros RSI, pin bar, envolvente, pinzas, estrella matutina / vespertina, así como opciones de filtro de divergencia que permiten filtrar solo las configuraciones más fuertes.  El indicador también se puede utilizar en modo de gráfico único. Lea más sobre esta opción en el producto   blog .   Comb
RSImaxmin
Carlos Andrés Moya Erazo
4.5 (10)
El indicador muestra cuando hay sobreprecios y divergencias sobre el RSI. Además, tiene alertas configurables, niveles de sobreprecios dinámicos y una función especial “limpiador RSI”. ¡El indicador que calcula automáticamente los rangos de sobreprecio! RSImaxmin es un indicador basado en el oscilador RSI (Relative Strength Index) que identifica de manera efectiva cambios de tendencias en el precio, ya que refleja la fuerza relativa de los movimientos alcistas, en comparación con los movimiento
Este indicador de tendencia de múltiples marcos de tiempo y múltiples símbolos envía una alerta cuando se ha identificado una tendencia fuerte o un cambio de tendencia. Puede hacerlo seleccionando construir el tablero usando Promedio móvil (simple o doble (cruce MA)), RSI, bandas de Bollinger, ADX, índice compuesto (Constance M. Brown), Awesome (Bill Williams), MACD (línea de señal ), Heiken Ashi suavizado, media móvil de Hull, cruces estocásticos, Gann HiLo Activator y Traders Dynamic Index. Se
¿Estás listo para llevar tus operaciones al siguiente nivel? Presentamos   WH   Divergence Pro MT5   , un indicador de divergencia avanzado que le permite elegir entre una variedad de indicadores técnicos populares. Ahora puede adaptar sus señales de divergencia para que coincidan con su estrategia comercial única. Contáctame después de la compra para guiarte a través de los procesos. Características clave   : Selección de indicador   : elija su indicador preferido entre las siguientes opci
Currency Strength Meter is the easiest way to identify strong and weak currencies. This indicator shows the relative strength of 8 major currencies + Gold: AUD, CAD, CHF, EUR, GBP, JPY, NZD, USD, XAU. Gold symbol can be changed to other symbols like XAG, XAU etc. By default the strength value is normalised to the range from 0 to 100 for RSI algorithm: The value above 60 means strong currency; The value below 40 means weak currency; This indicator needs the history data of all 28 major curre
Trade Assistant MetaTrader System  — a multi-timeframe system that is based on three standard indicators:   Stochastic oscillator ,   RSI   (Relative Strength Index), and   CCI   (Commodity Channel Index). It displays current trend directions for M1, M5, M15, M30, H1, H4, D1, W1, and MN1 timeframes. When you follow such an indicator you have a clear picture of the trends across all important timeframes. It doesn't matter which timeframe you attach this indicator to. Input parameters CheckCandl
Modificación multidivisa y multitemporal del indicador Índice de Fuerza Relativa (RSI). Puede especificar las monedas y plazos que desee en los parámetros. Además, el panel puede enviar notificaciones cuando se cruzan niveles de sobrecompra y sobreventa. Al hacer clic en una celda con un punto, se abrirá este símbolo y punto. Este es el escáner MTF. La clave para ocultar el panel del gráfico es "D" de forma predeterminada. De manera similar al medidor de fortaleza de la moneda, el Panel pue
Este indicador de panel de zona de oferta y demanda de múltiples períodos de tiempo y múltiples símbolos envía alertas cuando el precio ha alcanzado una zona de oferta / demanda. También es posible usarlo para recibir alertas sobre dobles techos / fondos regulares en lugar de zonas. Se puede utilizar con todos los marcos de tiempo de M1 a MN.       Se pueden mostrar un máximo de 9 períodos de tiempo en el tablero al mismo tiempo.   Es posible utilizar filtros de RSI, divergencia (MACD, OsMA, RSI
Real xRSI
Amir Mohammadreza Mikaniki
5 (1)
¿Está buscando un indicador poderoso para llevar su comercio al siguiente nivel? No busque más allá de nuestro exclusivo indicador basado en RSI, que combina lo mejor del índice de fuerza relativa (RSI), la media móvil y los indicadores Heiken-Ashi en MQL5. Nuestro indicador ofrece datos en tiempo real sin retrasos, lo que le permite tomar decisiones comerciales informadas con confianza. Es perfecto para comerciantes de todos los niveles, desde principiantes hasta expertos. Con configuracio
This indicator accurately identifies and informs market reversals and continuation patterns by analyzing and signaling the Three White Soldiers / Three Black Crows pattern. It also offers a  "real-time backtesting"  panel in the indicator itself in a way that every change made on the indicator parameters will immediately show the user how many signals are occurred, how many take profits and stop losses were hit and, by having these informations, the Win Rate and the Profit Factor of the setup b
A must-have tool for any strategy based on divergence detection. 10 different oscillators can be used to detect divergences and can be combined with Double Top/Bottom patterns to confirm reversal signals. SCANNER is included . Now with Scanner you can find trading opportunities and setups easily and faster. Features Easily detect strong reversal signals. 10 different oscillators are available for divergence detection. Divergence & Top/Bottom detection can operate independently or combined. Get
Displays multiple indicators, across multiple timeframes and symbols to give a comprehensive overview of the market. Uniquely, the indicators are configurable and can include custom indicators, even those where you just have the ex4 file or those purchased from Market. Standard indicators can also be selected, the default being ADX, CCI, market price above/below Moving Average (MA), Moving Average Cross (MAX), MACD, Momentum (MOM), OsMA, RSI, Parabolic SAR, William's Percentage Range (WPR). Use
Este indicador de zona de oferta y demanda dibuja las zonas en el gráfico y envía alertas cuando el precio ha alcanzado o roto una zona. También es posible utilizarlo para recibir alertas sobre dobles techos/fondos regulares en lugar de zonas. Es posible usar filtros RSI, de volumen y de divergencia para filtrar solo las configuraciones más fuertes. Combinado con sus propias reglas y técnicas, este indicador le permitirá crear (o mejorar) su propio sistema poderoso. Este indicador es para el com
Awesome RSI
Flavio Javier Jarabeck
5 (1)
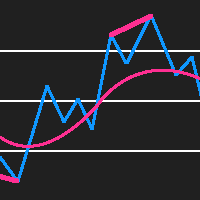
The Relative Strenght Index presented to the world in 1978 by J. Welles Wilder Jr. in his book " New Concepts in Technical Trading Systems " is widely used around the world in several ways, not only with the traditional approach of Overbought and Oversold states, which in several cases and depending on the assets and timeframes it just simply doesn't work anymore . BUT, this indicator has its value when used, for instance, looking for divergences between its measuring system and the Prices appea
PipFinite Cluster Helix MT5
Karlo Wilson Vendiola
5 (2)
A combination of trend, pullback, range breakouts and statistics in one indicator Mainly functions as an Entry indicator. Works in any pair and timeframe. Suggested Combination Cluster Helix with Strength Meter Strategy: Confirm signals with ideal strength levels Watch Video: (Click Here) Features Detects range breakouts on pullback zones in the direction of the trend Analyzes statistics of maximum profits and calculates possible targets for the next signal Flexible tool, can be used in many
RSI Alarm Osw
William Oswaldo Mayorga Urduy
RSI ALARM  (Para Metatrader 5) Este indicador funciona como un RSI normal con todas sus configuraciones (Periodicidad, colores, niveles, etc), pero adicional se puede establecer alarmas en el nivel superior e inferior (Ejemplo 70 y 30), con la posibilidad de ajustar estos niveles moviendo las líneas azul y roja para establecer los niveles superior e inferior. También se puede activar y desactivar una función adicional que crea una flecha en el grafico cuando se cumpla el RSI esperado superior o
Indicador Introducción El indicador está diseñado de acuerdo con fórmulas de promedio móvil, que es más estable y tiene menos retraso que RSI o CCI. El indicador tiene tres valores de indicador, el período de promedio móvil y los colores de la línea se pueden cambiar manualmente. ¿Qué puede aportarte este indicador? Señales de entrada precisas: el indicador dibuja señales de flecha hacia arriba y hacia abajo. Análisis de tendencia multiperíodo: al cargar este indicador en un gráfico de marco de
Este indicador de múltiples períodos de tiempo y múltiples símbolos busca barras de pines. Combinado con sus propias reglas y técnicas, este indicador le permitirá crear (o mejorar) su propio sistema poderoso. Características Puede monitorear todos los símbolos visibles en su ventana Market Watch al mismo tiempo. Aplique el indicador a un solo gráfico y monitoree instantáneamente todo el mercado. Puede monitorear cada marco de tiempo, desde M1 hasta MN, y le envía una alerta en tiempo real cuand
The indicator displays a matrix of indicators across multiple timeframes with a sum total and optional alert. Custom indicators can also be added to the matrix, in a highly configurable way. The alert threshold can be set to say what percentage of indicators need to be in agreement for an alert to happen. The alerts can turned on/off via on chart tick boxes and can be set to notify to mobile or sent to email, in addition to pop-up. The product offers a great way to create an alert when multiple
Visual Bollinger Bands Divergence
Luiz Felipe De Oliveira Caldas
Estilo visual de bandas VWAP 1.0 Los indicadores del mercado financiero son herramientas esenciales utilizadas por los comerciantes e inversores para analizar y tomar decisiones en los mercados financieros. VWAP y las Bandas de Bollinger son dos herramientas populares de análisis técnico utilizadas por los comerciantes para medir las tendencias del mercado y la volatilidad de los precios. En este producto, proponemos combinar los dos indicadores para crear un producto único que proporcione un a
El indicador identifica cuando ocurre una divergencia entre el precio y un oscilador / indicador. Identifica divergencias tanto regulares como ocultas. Tiene una opción de filtro RSI que permite filtrar solo las configuraciones más fuertes. El indicador también ofrece opciones para esperar una ruptura del canal de Donchian o que el precio cruce una media móvil   (ver captura de pantalla n. 3)       para confirmar la divergencia antes de señalar la oportunidad comercial. Combinado con sus propi
¡Presentamos RSIScalperPro - un revolucionario indicador basado en RSI para MetaTrader 5, diseñado específicamente para el scalping en gráficos de un minuto! Con RSIScalperPro, tendrás una herramienta poderosa para señales precisas de entrada y salida, lo que mejorará tu eficiencia de trading. RSIScalperPro utiliza dos diferentes indicadores de RSI que proporcionan señales claras para los niveles de sobrecompra y sobreventa. Puedes ajustar los periodos de tiempo y los valores límite de los dos
RSI Crossover Alert   es un poderoso sistema de notificación diseñado específicamente para operadores que utilizan el   índice de fuerza relativa (RSI)   en sus estrategias comerciales. Este indicador se enfoca en identificar cruces de RSI, que ocurren cuando la línea RSI rápida cruza por encima o por debajo de la línea RSI lenta. Al combinar estos cruces, el indicador filtra efectivamente las señales falsas, lo que permite a los operadores tomar decisiones comerciales más precisas. El RSI Cros
Traders Dynamic Index (TDI) MetaTrader indicator  — a comprehensive but helpful indicator that uses   RSI   (Relative Strength Index), its   moving averages, and volatility bands (based on   Bollinger Bands) to offer traders a full picture of the current Forex market situation. Here is single timeframe product. Once puscharse this indicator, you free to use MTF scanner (free at here ) The Traders Dynamic index TDI indicator is the next generation of the popular Trader Dynamic index indicator dev
Super Breakouts Monitor
Flavio Javier Jarabeck
Breakouts with strong momentum are challenging to catch. The purpose of the Super Breakouts Monitor is to identify such market conditions. This indicator is inspired by a concept from renowned Technical Analyst Tushar Chande, who combines two highly adaptive indicators, VIDYA and the Dynamic Momentum Index (both his creations), to capture the early stages of a successful breakout. At Minions Labs, we've added our unique enhancements to adapt these great ideas for modern markets like stocks, cryp
RSI Divergence Detector
Pierce Vallieres
5 (1)
RSI Divergence Detector is an RSI indicator which also detects divergences and plots arrows and trend lines on the chart where you should buy and sell. Please note that this indicator provides 5 buffers and doesn't repaint making it an exceptional indicator for Expert Advisors. The indicator also provides alerts. Buffer 0 = RSI Buffer 1 = Buy Buffer 2 = Sell Buffer 3 = RSIGradient Buffer 4 = PriceGradient NON REPAINTING DIVERGENCE DETECTION
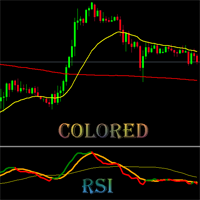
This is  Colored RSI Scalper Free MT5  -is a professional indicator based on the popular Relative Strength Index (RSI) indicator with Moving Average and you can use it in Forex, Crypto, Traditional, Indices, Commodities. Colors are made to make trend, and changing trend more easily. Back test it, and find what works best for you. This product is an oscillator with dynamic overbought and oversold levels, while in the standard RSI, these levels are static and do not change. This allows Colored RS
KT RSI Alerts MT5
KEENBASE SOFTWARE SOLUTIONS
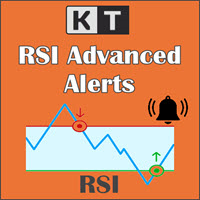
KT RSI Alerts is a personal implementation of the Relative Strength Index (RSI) oscillator that provide signals and alerts on four custom events: When RSI enter in an overbought zone. When RSI exit from an overbought zone. When RSI enter in an oversold zone. When RSI exit from an oversold zone. Features A perfect choice for traders who speculate the RSI movements within an overbought/oversold zone. It's a lightly coded indicator without using extensive memory and resources. It implements all
KT Absolute Strength MT5
KEENBASE SOFTWARE SOLUTIONS
KT Absolute Strength measures and plots the absolute strength of the instrument's price action in a histogram form. It combines the moving average and histogram for a meaningful illustration. It supports two modes for the histogram calculation, i.e., it can be calculated using RSI and Stochastic both. However, for more dynamic analysis, RSI mode is always preferred. Buy Entry When the Absolute Strength histogram turns green and also it's higher than the previous red column. Sell Entry W
RMI Indicator
Matthias Effler
3 (1)
The underlying strategy of this indicator is based on identifying momentum in the market and attempting to capture the direction of the trend through transitions between bullish and bearish moments. Utilizing bands around the RWMA allows for identifying potential overbought and oversold situations in the market. 1. Calculation of the Range Momentum Index (RMI): The RMI is based on a combination of the Relative Strength Index (RSI) and the Money Flow Index (MFI), both of which are momentum ind
FFx Universal Strength Meter PRO is more than a basic strength meter. Instead of limiting the calculation to price, it can be based on any of the 19 integrated strength modes + 9 timeframes. With the FFx USM, you are able to define any period for any combination of timeframes. For example, you can set the dashboard for the last 10 candles for M15-H1-H4… Full flexibility! Very easy to interpret... It gives a great idea about which currency is weak and which is strong, so you can find the best pai
FFx Watcher Pro MT5
Eric Venturi-Bloxs
3.67 (3)
The FFx Watcher PRO is a dashboard displaying on a single chart the current direction of up to 15 standard indicators and up to 21 timeframes. It has 2 different modes: Watcher mode: Multi Indicators User is able to select up to 15 indicators to be displayed User is able to select up to 21 timeframes to be displayed Watcher mode: Multi Pairs User is able to select any number of pairs/symbols User is able to select up to 21 timeframes to be displayed This mode uses one of the standard indicators
Expert Market Edge is scalping, trending, reversal indicator, with alerts . You can use it all and fit with your strategy whatever it fits you. My recommendation is to combine with my Colored RSI , and when 2 signals are matched, and pointing same direction (for example buy on this indicator, and green on RSI, you can take a long position, stop loss should be last local low, if you want to be more conservative, add ATR. ) you can take position. If you using moving averages, that's even better i
RSI Traffic Lights Dashboard Trend is you friend, one of the classical Trend following is the Relativ Streng Index (RSI). With RSI Traffic Light Dashboard you get an Overview how the current trend is moving for several Pairs. How many pairs you monitor, can be configured in Indicator settings. The order of symbols is equivalent to your Market Watchlist. The RSI Traffic Light Indicator alerts you if the trend is changing for your pair. Alert can be switched on/off Important: Get informed about
Fibonacci and RSI MQL5
Carlos Daniel Vazquez Rosas
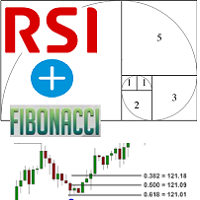
Fibonacci and RSI. The indicator is a combination of the Fibonacci and RSI indicators. Every time the price touches one of the fibonacci levels and the rsi condition is met, an audible alert and a text alert are generated. Parameters number_of_candles : It is the number of candles that will be calculated. If you put 100, the indicator will give you the maximum and minimum of the last 100 candles. sound_signal:   If you want the indicator to notify you that the conditions are met using
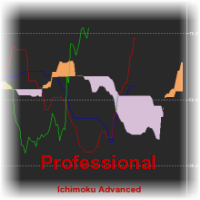
El indicador Ichimoku Kinko Hyo sirve para el trading tendencial y se utiliza prácticamente en todos los mercados. Este indicador es único en muchos sentidos. Sin embargo, su ventaja principal consiste en ofrecer a los traders muchos puntos de referencia que permiten formar un concepto más comprensivo y completo sobre el movimiento del precio. Esta profundidad del análisis y una exclusiva claridad del indicador permite a los traders distinguir rápidamente las posibilidades comerciales y seleccio
Any financial instrument that is traded on the market is a position of some active towards some currency. Forex differs from other markets only in the fact, that another currency is used as an active. As a result in the Forex market we always deal with the correlation of two currencies, called currency pairs. The project that started more than a year ago, helped to develop a group of indicators under a joint name cluster indicators. Their task was to divide currency pairs into separate currenci
Ichimoku Kinko Hyo is a purpose-built trend trading charting system that has been successfully used in nearly every tradable market. It is unique in many ways, but its primary strength is its use of multiple data points to give the trader a deeper, more comprehensive view into price action. This deeper view, and the fact that Ichimoku is a very visual system, enables the trader to quickly discern and filter "at a glance" the low-probability trading setups from those of higher probability. This i
Knowledge of the strength and weakness of each currency is vital for every forex trader. Our   Currency Strength Meter indicator   measures the strength of eight major currencies (USD, EUR, GBP, CHF, JPY, CAD, AUD, NZD) by using the Relative Strength Index indicator, also known as RSI. The Currency Strength Meter indicator shows you, simply and quickly, when a currency is oversold, overbought, or in "normal area". This way, you can identify which currency is the strongest and the weakest. Our
This indicator is based on the classical indicator RSI (Relative Strangth Index) and will be helpful for those who love and know how to use not a visual but digital representation of the indicator. All TimeFrames RSI MT5 indicator shows values from each timeframe. You will be able to change the main input parameters for each RSI for every TF. Example for M1: sTF1_____ - label (string) of M1 TF. Period1 - number of bars used for the indicator calculations. Price1 - price used. Can be any of the p
This indicator is based on the classical indicators: RSI (Relative Strangth Index) and CCI (Commodity Channel Index) and will be helpful for those who love and know how to use not a visual but digital representation of the indicators. The indicator shows values from each timeframe. You will be able to change the main input parameters for each RSI and CCI for every TF. Parameters OverboughtLevel_R = 70; OversoldLevel_R = 30; OverboughtLevel_C = 100; OversoldLevel_C = -100; Example for M1: sTF1 =
This indicator shows data from 9 currency pairs by your choice for all 9 Time Frames. If a digital value of the RSI is less or equal to DnLevel = 30 (or whatever number you decided to put) then a Green square will appear. This is potentially an oversold condition and maybe a good time to go Long. If a digital value of the RSI is greater or equal to UpLevel = 70 (or whatever number you decided to put) then a Red square will appear. This is potentially an overbought condition and maybe a good time

MetaTrader Market permite adquirir los programas para la plataforma MetaTrader máximamente seguro. Usted puede descargar las versiones demo de robots e indicadores que le ha gustado directamente desde el terminal y probarlos en el Probador de Estrategias.

Pruebe el programa en diferentes regímenes de funcionamiento antes de comprarlo para tener la mejor idea sobre el producto, y pague por el producto que le ha gustado a través del sistema de pago MQL5.community.

El sistema de pago MQL5.community garantiza el pago a los vendedores, y la posibilidad de probar el programa en diferentes regímenes de funcionamiento permite a los compradores conocer el producto al máximo posible.