Nuevos indicadores técnicos para MetaTrader 5 - 13

To get access to MT4 version please click here . This is the exact conversion from TradingView: "RedK_Supply/Demand Volume Viewer v3.0" by "RedKTrader" This is a light-load processing and non-repaint indicator. All input options are available. Buffers are available for processing in EAs. You can message in private chat for further changes you need. Thanks for downloading
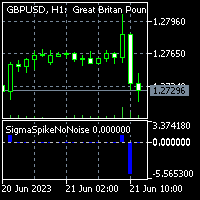
To get access to MT4 version please click here . This is the exact conversion from TradingView: "Sigma Spikes No Noise" by "irdoj75" This is a light-load processing and non-repaint indicator. All input options are available. Buffers are available for processing in EAs. You can message in private chat for further changes you need. Thanks for downloading...

Creating an Index: Importance, Customization, and Weighting Options for MT5 Trading Indicator Designing your index is crucial for efficient symbol tracking in the world of trading. With a powerful MT5 trading indicator, you gain the flexibility to construct an index that suits your preferences, whether it's an equal weighted or custom weighted one. Unlike widely-known indexes like the S&P 500, which heavily favor certain winners, this indicator empowers you to curate a basket of symbols and assi
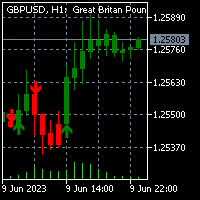
To get access to MT4 version please click here . This is the exact conversion from TradingView: "UT Bot Alerts" by "QuantNomad". This is a light-load processing and non-repaint indicator. Buffers are available for processing in EAs. You can message in private chat for further changes you need. Here is the source code of a simple Expert Advisor operating based on signals from UT Bot Alerts . #include <Trade\Trade.mqh> CTrade trade; int handle_utbot= 0 ; input group "EA Setting" input int magic_

¿Está cansado de perderse las tendencias rentables del mercado? ¿Le gustaría tener una herramienta confiable que pudiera identificar las continuaciones de tendencias con precisión y exactitud?
¡No busque más! Nuestro indicador de continuación de tendencia está aquí para potenciar su estrategia comercial y ayudarlo a mantenerse a la vanguardia del juego.
El indicador de continuación de tendencia es una herramienta poderosa, creada específicamente para ayudar a los operadores a identificar y

Bienvenido al Indicador Provlepsis
"Provlepsis" es un indicador altamente avanzado diseñado para el Mercado MQL. Analizando barras anteriores con la misma hora del día, calcula con precisión el rango potencial del movimiento del mercado, brindando información valiosa sobre futuras fluctuaciones de precios. A diferencia del indicador ATR tradicional, "Provlepsis" tiene en cuenta el factor tiempo, lo que resulta en una herramienta más poderosa que se adapta a diferentes condiciones de mercado. Du
FREE

This indicator builds upon the previously posted Nadaraya-Watson Estimator. Here we have created an envelope indicator based on kernel smoothing with integrated alerts from crosses between the price and envelope extremities. Unlike the Nadaraya-Watson Estimator, this indicator follows a contrarian methodology. Please note that the indicator is subject to repainting. The triangle labels are designed so that the indicator remains useful in real-time applications.
Settings
Window Size: Dete

This indicator uses the Zigzag indicator to identify swing highs and swing lows in the price chart. Once it has identified the swing highs and swing lows, it can use them to determine potential support and resistance levels. A support level is formed when the price drops and bounces back up from a swing low, indicating that there is buying pressure at that level. A resistance level is formed when the price rises and reverses downward from a swing high, suggesting selling pressure at that level.
FREE
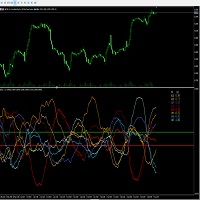
The qualitative indicator calculates the difference between USD, EUR, GBP, AUD, JPY, CHF, NZD, CAD currency pairs. The calculation is carried out online; it calculates supply and demand among themselves in various bundles. The display can be observed in two modes: general for all eight pairs and also specifically for the selected pair. An important indicator of the indicator is the zero axis, which indicates the general trend of currencies and their advantage relative to each other. The indicato

The indicator detects the beginning of a new trend not directly, but by comparing two forecast values based on the available history. Its action is based on the assumption that the predicted (historically normal) price and the real price differ due to the appearance of "new" force (unbalanced impact on the market), which usually leads to a significant market correction in an unstable market. The indicator does not track market stability, so it is recommended to use other methods to control vol

To get access to MT4 version please click here . This is the exact conversion from TradingView: "Candle body size" by "Syamay". This is a light-load processing indicator. This is a non-repaint indicator. Buffers are available for processing in EAs. All input fields are available. You can message in private chat for further changes you need. Thanks for downloading
FREE

The MultiTimeframe Volume Zones Indicator is a powerful tool designed to provide traders with comprehensive insights into market dynamics. It combines several essential features, including volume analysis, Dow Zones, buy and sell arrows, candle timer, and market movement across different time frames. This all-in-one indicator equips traders with valuable information to make informed trading decisions. Key Features: Volume Analysis: Gain a deep understanding of market sentiment and strength by an
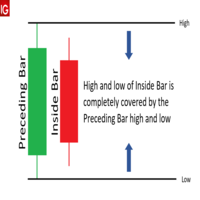
The Inside bar indicator can detect where inside bars occur in the charts and will change the color of the candle based on user inputs. Please note that the color can differ based on the current color of the candle due to supposition of the colors. Here are the characteristics of an inside bar pattern: High: The high of the bearish candle is lower than the high of the previous bullish candle. Low: The low of the bearish candle is higher than the low of the previous bullish candle. Body: The bo

To get access to MT4 version please click here . This is the exact conversion from TradingView: "[SHK] Schaff Trend Cycle (STC)" by "shayankm". This is a light-load processing indicator. This is a non-repaint indicator. Buffers are available for processing in EAs. All input fields are available. You can message in private chat for further changes you need. Thanks for downloading
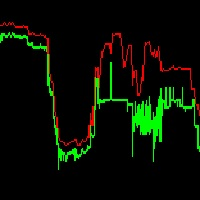
It is super imporant to know what the spread is on your charts!
This indicator displays the Ask High of the past bars, similar to that of the backtester. This allows you to see the spread of bars in real time.
The spread of the bar is the ask-bid price. The spread of a bar is the minimum spread of any ticks found within that bar. I hope this makes sense.
If you have any questions or feedback, let me know - thank you.

This is one of my preferred indicators where it plots on the chart Railroad Track candles, i.e. candles that have similar size. It is a very good indicator for trend direction. In the settings there is an option for Max candle size and Min candle size and also for the percentage for the tolerance between the Min and Max candle size. The candles values are calculated for High and Low. Have fun and enjoy trading! P.S. Please send me a message or leave a comment with any suggestions or improvements

XP Speed Meter the best indicator that measures the price/tick’s currency speed for you. It will give you the ability to know when the pair moving fast or slow . So, you can trade or not trade. It’s very important tool for scalper traders – news traders. Even for trend traders it will be useful to know if the market is trending fast or slow . XP Speed Meter is better than the volume type indicators of course. Because it shows the currency speed on the run-time without any lacking like what the v

This will find a possible reverse area and show entry signal and this strategy is using every candle and calculate them
buyer should us e with other indicators to get the best trade entry like Macd , RSI , or EMA . SMA.
Make sure try demo first it will supprise you all because how good it is
i hope you guy enjoy it but my coding is not good, so i cant code any EA for this , my own strategy

To get access to MT4 version please click here . This is the exact conversion from TradingView: "ZLSMA - Zero Lag LSMA" by "veryfid". This is a light-load processing indicator. This is a non-repaint indicator. Buffers are available for processing in EAs. All input fields are available. You can message in private chat for further changes you need. Thanks for downloading

5/10 copias a 30$ ---> siguiente 50$ // Versión MT4
Forex Vigor es un indicador técnico que evalúa la fuerza del impulso de las 8 divisas principales (EUR, GBP, AUD, NZD, USD, CAD, CHF, JPY). El indicador se basa en cálculos matemáticos que miden la falta de correlación entre 28 pares de divisas. Para calcular sus valores, analiza la diferencia porcentual entre los precios de cierre utilizando el método de media ponderada lineal (LWMA) más un sistema estadístico que elimina los valores qu
Presentamos el Indicador de Dibujo en Gráficos: ¡Desata tu Creatividad en los Gráficos!
¿Estás cansado de luchar para hacer anotaciones en tus gráficos de trading, tratando de dar sentido a tu análisis o comunicar tus ideas de manera efectiva? ¡No busques más! Estamos emocionados de presentarte el Indicador de Dibujo en Gráficos, una herramienta innovadora que te permite dibujar y hacer anotaciones en tus gráficos de manera sencilla con solo unos clics o trazos de tu pluma.
Nuestro innovado
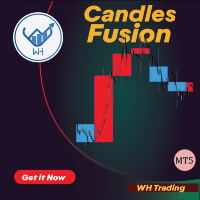
Candles Fusion es un poderoso indicador MT5 que mejora su análisis comercial al mostrar velas de marco de tiempo más alto en el marco de tiempo actual.
Esta característica única brinda a los operadores una visión integral de la acción del precio en diferentes períodos de tiempo, lo que les permite tomar decisiones comerciales más informadas.
Características:
Superposición de marcos de tiempo múltiples. Selección de marco de tiempo personalizable. Visualización clara. Actualizaciones

This Engulfing Candle Indicator as the name implies can detect engulfing candlestick patterns on the chart. The indicator alerts the user of the presence of an engulfing candle (Bearish engulfing candle and Bullish engulfing candle) by using visual representation of arrows on the chart. - Blue arrow for Bullish engulfing - Red arrow for Bearish engulfing Extra modifications can be added based on request.
FREE

El indicador MAtrio muestra tres promedios móviles en cualquier marco de tiempo a la vez con un período de 50 días, 100 días, 200 días. Después de adjuntarlo al gráfico, muestra inmediatamente tres promedios móviles con los parámetros de promedio móvil simple (SMA) MAmethod50 , promedio móvil simple (SMA) MAmethod100 , promedio móvil simple (SMA) MAmethod200 . En consecuencia, con el tipo de precio MAPrice50 , MAPrice100 , MAPrice200 , por defecto, el precio es Precio de cierre en todas
FREE
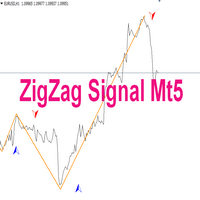
Indicator description: Indicator - ZigZag Signal is created on the basis of a well-known and popular indicator - ZigZag. The indicator can be used for manual or automatic trading by Expert Advisors. 1. The ZigZag Signal indicator has alerts of different notifications for manual trading. 2. If used in Expert Advisors, the indicator has signal buffers for buying and selling. You can also prescribe and call the indicator as an external resource and other settings and applications: (email me in a

The indicator is built on a principle similar to neural networks, and it calculates a multidimensional polynomial. When you install it on a chart or make changes to the indicator's parameters, or when you switch the chart period, the indicator is initially initialized. During initialization, not only the entire period of the chart is recalculated, but also the indicator is self-trained. The indicator's parameters include Sensitivity, Forecast, and degree of harmonization. The indicator theoretic
FREE
Volumen Scalper es un indicador donde capta la fuerza del volumen comprador y vendedor . donde es muy sencillo de usar , mostrandote la fuerza alcista y la fuerza bajista . en este grafico esta el claro ejemplo de como se usa , en el par VOLATILITY 75 donde esta el cendero verde junto con la flecha que te indica la compra , y esta el cendero rojo con la flecha marcandote la venta del par , los parametros a usar son Volumen : 5 Time : 1000 para que capte toda la tendencia y notar mejor cuand
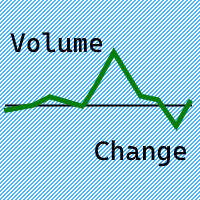
The Volume Change indicator displays in a separate window the change in volume and the direction of price movement in the form of a line.
Indicator parameters: VolumeTimeframe - timeframe on which the indicator takes data. VolumeApplied - volume type: Tick volume/Real volume. VolumePeriod - period of the moving average on the VolumeTimeframe, against which the volume change is calculated.
This indicator can be used to build a trading system based on tracking price movements w

The index makes it easy for traders to know the opening and closing times of global markets :
- Sidney - Tokyo - London - New York
Where it misleads each time zone and enables us to know the times of overlapping the markets when the liquidity is high.
To get more indicators and signals, follow us on the Telegram channel link
https://t.me/tuq98
Or our YouTube channel, which has explanations in Arabic and a technical analysis course
https://www.youtube.com/@SSFX1
FREE

Moving Average Band es una herramienta diseñada para proporcionar a los traders una perspectiva más completa y realista al utilizar medias móviles en su análisis técnico. A diferencia de las medias móviles convencionales trazadas como líneas, Moving Average Band introduce un enfoque distinto al representar la media móvil como una banda que se ajusta dinámicamente en función de la volatilidad del mercado.
La volatilidad es una característica intrínseca de los mercados financieros, y entender c
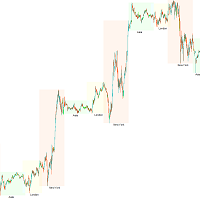
Los traders deben prestar atención al impacto de las zonas horarias de negociación, ya que los diferentes horarios de actividad del mercado y los volúmenes de negociación pueden afectar directamente la volatilidad y las oportunidades de negociación de los pares de divisas. Con el fin de ayudar a los traders a tener una comprensión integral de la situación del mercado y formular mejores estrategias de negociación, hemos desarrollado un indicador de sesión de negociación.
Este indicador muestra
FREE

Was: $69 Now: $34 Blahtech VWAP - Volume Weighted Average Price (VWAP) is the ratio of price to total volume. It provides an average price over a specified time interval. Links [ Install | Update | Documentation ] Feature Highlights
Configurable VWAP Line Sessions, intervals, anchored or continuous Previous day settlement line Standard Deviation bands Alerts at bar close or real time Automatic Broker or Tick volumes Significantly reduced CPU usage
Input Parameters
Expert Advisor
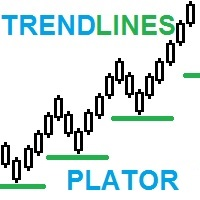
TrendPlator: Un Potente Indicador de Proyección de Tendencias para Estrategias de Trading Optimizadas ¡Descubre el poder de nuestro nuevo indicador! Con la capacidad de calcular líneas de tendencia de marcos temporales más amplios y proyectarlas directamente en tu marco temporal actual, proporciona un soporte estratégico que llama la atención de todos los traders. Estos puntos se convierten en poderosos niveles de soporte o resistencia para tus operaciones, impulsando tu estrategia de trading. I

El indicador de precio promedio ponderado por volumen es un indicador de estudio de línea que se muestra en la ventana principal del gráfico de MT5. El indicador monitorea el precio típico y luego el volumen de negociación utilizado para empujar automáticamente la línea del indicador hacia los precios fuertemente negociados. Estos precios son donde se han negociado la mayoría de los contratos (o lotes). Luego, esos precios ponderados se promedian durante un período retrospectivo, y el indicador
El indicador de media móvil logarítmica es una media móvil que invierte la fórmula de una media móvil exponencial.
Se sabe que muchos operadores utilizan gráficos logarítmicos para analizar la duración de las oscilaciones de precios. El indicador en esta publicación se puede usar para analizar el valor logarítmico del precio en un gráfico escalado de tiempo estándar.
El comerciante puede establecer los siguientes parámetros de entrada:
MAPeriod [predeterminado en: 9]: establezca un

El indicador Trading Hours dibuja los marcos que representan las horas de apertura y cierre de un intercambio concreto en un gráfico. Entradas: El parámetro de entrada `UTC time zone shift` establece el cambio de zona horaria del usuario desde UTC, Los otros parámetros se utilizan para mostrar u ocultar los marcos o configurar el color. Características: Dibuja los marcos que representan las horas de apertura y cierre de un intercambio concreto en un gráfico, Muestra/oculta marcos para el interc

This is a derivative of John Carter's "TTM Squeeze" volatility indicator, as discussed in his book "Mastering the Trade" (chapter 11).
Gray dot on the midline show that the market just entered a squeeze (Bollinger Bands are with in Keltner Channel). This signifies low volatility, market preparing itself for an explosive move (up or down). Blue dot signify "Squeeze release".
Mr.Carter suggests waiting till the first blue after a gray dot, and taking a position in the direction of the mo
FREE

JCAutoFibonacci 简繁自动绘制斐波那契 1.Zigzag3浪,大中小三浪分别代表市场潮流、趋势、涟漪,以不同参数实现。 使用自定义函数获取三浪高低点,以最近高低点作为绘制价格与时间。 2.Fibonacci,黄金分割线,水平线比例0、0.236、0.318、0.50、0.618、1.0、1.236、1.382、1.50、1.618、2.0等。 斐波那契返驰理论包括:反弹/回调现象、反转现象。合理绘制Fibonacci获取市场有效SR。分别绘制三浪。 3.自定义Fibo颜色,自定义水平线比例(0为不显示),自定义水平线颜色,自定义可选择,自定义右射。 备注:如遇使用问题,请联系邮箱:16692618587@163.com
FREE

Description: Strategy based around Open-Close Crossovers. Setup: I have generally found that setting the strategy resolution to 3-4x that of the chart you are viewing tends to yield the best results, regardless of which MA option you may choose (if any) BUT can cause a lot of false positives - be aware of this. Don't aim for perfection. Just aim to get a reasonably snug fit with the O-C band, with good runs of green && red. Option to either use basic open && close series data or pick your pois
FREE

This is a multi-timeframe indicator that detects and displays support and resistance (S&R) lines using the ZigZag indicator.
Features
The support and resistance lines are not redrawing. The indicator is capable of adding new support and resistance levels as they appear. Each S&R line has a tooltip that displays the price level and start time. Save time for multi-timeframe analysis on trades. All types of alerts (sound, pop-up, email, mobile push notification) are available. Working with al

El saldo inicial (IB) es un rango en el que el precio pasó sus dos primeros periodos OPT tras la apertura. En otras palabras, el saldo inicial es un rango de la primera hora tras la apertura del mercado. El saldo inicial surgió de la negociación en sala, ya que los operadores de sala observaban los distintos rangos tras la apertura del mercado.
Este indicador le permite introducir las horas y minutos iniciales y finales de un rango horario específico tiempo para que el trader pueda configurar
FREE

Boom Scalper Gold es un indicador, programado para hacer scalping en temporalidad de 1/5 y 15 Minutos , perfecto para cazar spikes y velas trend , donde en los parametros de (70) te manda un alerta de venta/sell y en el parametro de nivel (8) te manda señal de compra/buy sirve para los indices (BOOM) de indices sinteticos (Deriv) es facil y simple de usar , hace todo el trabajo mandandote las alertas! el indicador durante este periodo se va a mantener en OFERTA ! sin mas a disfrutar ! Good P

If you have been anywhere near Forex forums or social media lately, you have no doubt been hearing people talk about Smart Money Concepts (SMC) trading. You may be wondering what SMC is, and whether it deserves all the hype. In this post, we will introduce Smart Money Concepts trading to you so you can make an informed decision about whether or not to give this strategy a try in your own trading. What is SMC Forex trading? Smart Money Concepts (SMC) is one of many forex trading methods. SMC
Crash Scalper Gold es un indicador , donde te marca puntos de compra y puntos de venta como bien dice el nombre , se usa para hacer scalping en los pares de (Crash) 1000/500/300 donde te manda señales de venta/Sell y compra/Buy en los puntos de nivel (90) te manda la señal de venta , (Spike) en el punto de nivel (27) te manda la señal de compra, (Velas Trend) es muy sensillo y facil de usar , para hacer la mejores entradas posibles ! por este periodo se va a mantener en oferta ! sin mas a di
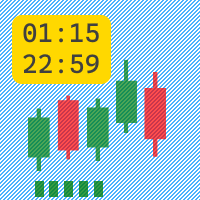
The Active Session indicator displays an active trading session in the form of green candles in a separate window.
Indicator parameters:
Monday = true/false - trade on Monday if the parameter is true.
Tuesday = true/false - trade on Tuesday if the parameter is true.
Wednesday = true/false - trade on Wednesday if the parameter is true.
Thursday = true/false - trade on Thursday if the parameter is true.
Friday = true/false - trade on Friday if the parameter is true.
StartHou
Xau/Usd Scalper es un indicador unico donde cuenta los low/high para hacer entradas en compra y venta ! donde te marca las entradas con flechas junto a los lows y high se usa en m15/H1 para hacer entradas mas valiosas y largas es muy sencillo y facil de usar , tambien sirve para los pares de forex y indices sinteticos ! sin mas a disfrutar ! buen profit World Inversor !
Step Scalper , es un indicador con alertas , donde te envia alertas de compra y venta acompañado por una moving average de 21 periodos es muy facil y sencillo de usar , donde en el sendero de periodo verde marca la compra del activo , y el sendero del periodo rojo marca la venta del activo , se usa para hacer scalping en M5/M15 pero tambien es recomendado usarlo en periodos de 1 Hora ya que capta la tendencia de compra o venta , para agarrar mayor profit ! sin mas a disfrutar Buen profit

The seven currencies mentioned are: GBP (British Pound): This is the currency of the United Kingdom. AUD (Australian Dollar): This is the currency of Australia. NZD (New Zealand Dollar): This is the currency of New Zealand. USD (United States Dollar): This is the currency of the United States. CAD (Canadian Dollar): This is the currency of Canada. CHF (Swiss Franc): This is the currency of Switzerland. JPY (Japanese Yen): This is the currency of Japan. Currency strength indexes provide a way to
FREE

A visual Order Book is a powerful tool used in the financial market to provide a detailed view of buy and sell orders in a given financial instrument in real time.
This visual representation allows traders to observe the liquidity available in the market, identify the supply and demand levels at different prices and follow the evolution of orders as they are placed, modified or withdrawn.
By analyzing the visual Order Book, traders can identify trading patterns, detect possible reversal poi

JCStatistics 简繁数据统计 1.显示账户信息:内容显示 交易员、账号、本金、杠杆、保证金、保证金比例、余额、净值; 日周月开盘余额、持仓收益、日收益、周收益、月收益; 收益为正时显示红色字体,收益为负时显示绿色字体; 日收益低于-5%时显示CircuitBreak; 总收益低于-10%时显示MarginCall; 2.显示统计数据: 收益(收益率)(交易量)(胜率) 5日数据;4周数据;12月数据; 3.当前标的统计:Symbol()收益(交易量)(胜率) 4.主流标的统计:收益(交易量)(胜率) 可以选择性显示账户信息、数据信息,调整显示颜色,调整字体,调整字体大小。 指标删除后自动删除桌面文字及背景。 备注:如遇使用问题,请联系邮箱:16692618587@qq.com.
FREE

Canal King of Dragon, indicador King of Dragon, sistema King of Dragon, King of Dragon MT5, indicador clásico King of Dragon, sistema de deslizamiento King of Dragon, Rey del dragón todo en uno
El sistema de comercio de canales King of Dragon, que es un sistema de comercio de canales clásico, muchos usuarios solicitan encarecidamente la versión MT5. Este programa ha sido optimizado para el rendimiento en múltiples versiones, y ya es un sistema relativamente fluido. 49$ → 59$ Zona roja, tenden

This all-in-one indicator displays real-time market structure (internal & swing BOS / CHoCH), order blocks, premium & discount zones, equal highs & lows, and much more...allowing traders to automatically mark up their charts with widely used price action methodologies. Following the release of our Fair Value Gap script, we received numerous requests from our community to release more features in the same category. "Smart Money Concepts" (SMC) is a fairly new yet widely used term amongst price a

Si tu estrategia requiere operar en un período específico de actividad del mercado, ya sea tranquilo o turbulento, este indicador te ayudará a encontrar esos intervalos de tiempo dentro de la semana para cada par de divisas mediante estadísticas.
El principio de funcionamiento del indicador es bastante simple. La semana de trading, desde las 00:00 del lunes hasta las 23:59 del viernes, se divide en intervalos de tiempo, cuya duración corresponde al marco temporal actual. Para cada intervalo d
FREE

Pinbar Outside Pattern indicator shows in a table symbol, time frame and direction of the last price candle if it matches outside pinbar input parameters. Outside pinbar means that the candle is extreme in the chosen time frame. By clicking ' Open chart ' button you can view drawn pattern. You can choose to scan through all the symbols in Market Watch or enter your favorite symbols, and also you can enter time frames you need to scan. ---------Main settings-------- Select all symbols from Market
Pack profesional Crash 300 Indicadores , en esta ocacion presento el indicador tendence que es para el indice crash 300 (Deriv Broker) el indicador consta de una estrategia donde se agarran tendencia en periodos de 15 Minutos , bien claro el indicador muestra la compra marcandote la punta de rojo asta que se desarrolle la tendencia, y luego marque el punto verde de compra , es muy simple de usar , es recomendado usar en esa temporalidad ya que sirve para agarrar tendencias mas largas y aume
Channel Stochastic Boom 1000 tengo el agrado de presentar el pack (Tendence Boom 1000) donde en esta ocacion presento el indicador Channel Stochastic Boom 1000 para (Deriv Broker) donde es 1 de los 4 indicadores que trae el pack ! el indicador consta con la estrategia de sthochastic , donde llega al punto de (0 Nivel) se da la compra aprobechando a cazar spike , donde llega al punto de (90 Nivel) se da la venta aprobechando las velas trend ! se usa en 1 minuto y en 15 minutos , para aprobech

"Advanced Daily VWAP with Standard Deviation and Trading Bands" Description: "The 'Advanced Daily VWAP with Standard Deviation and Trading Bands' indicator offers a comprehensive view for traders who wish to make the Volume Weighted Average Price (VWAP) the crux of their trading strategy. It not only calculates the VWAP on a daily basis but also incorporates standard deviation to give an accurate representation of market volatility. The trading bands are calculated using a 1.5% multiplier for th

The Fisher Transform is a technical indicator created by John F. Ehlers that converts prices into a Gaussian normal distribution. The indicator highlights when prices have moved to an extreme, based on recent prices. This may help in spotting turning points in the price of an asset. It also helps show the trend and isolate the price waves within a trend. The Fisher Transform is a technical indicator that normalizes asset prices, thus making turning points in price clearer. Takeaways Turning poi
FREE

The big figure is a crucial aspect of forex trading, serving as a reference point for trade execution, risk management, and technical analysis. By understanding the importance of the big figure and incorporating it into their trading strategies, forex traders can improve their decision-making process and increase the likelihood of successful trades. Why is the Big Figure Important? The big figure is important for several reasons: Simplification: Traders often refer to the big figure when discu
FREE

*This is trading view indicator converted in mql5*
The HA Market Bias Indicator is a popular tool used in trading and technical analysis, designed to help traders identify market bias and potential trend reversals. It is commonly used in conjunction with candlestick charts and provides valuable insights into market sentiment. The indicator is based on the Heiken Ashi (HA) candlestick charting technique, which aims to filter out market noise and provide a smoother representation of price actio
FREE

Logarithmic chart in new window You can use both chart as half or full window All features are active in both arithmetic and logarithmic charts Magnet in arithmetic chart is standard metatrader magnet in logarithmic chart magnet have two modes: first mode only select high or low, if this mode is enabled, you can set how many candles will be search before and after to find the highest or lowest points second mode select the closest point of the candle to click, its choose between 4 points (High,
FREE

candlestick time it a useful indicator ,it help to keep you alert with the candlestick time ,how far to be completed at the chosen period , it help to keep you patience which is a biggest thing that holds trades down ,try it to improve you way of trading. it work on any broker any time frame and any symbol. you can customize the color on input. it can work on multiple timeframe. Thank you !
FREE

The Fisher Transform is a technical indicator created by John F. Ehlers that converts prices into a Gaussian normal distribution. The indicator highlights when prices have moved to an extreme, based on recent prices. This may help in spotting turning points in the price of an asset. It also helps show the trend and isolate the price waves within a trend. The Fisher Transform is a technical indicator that normalizes asset prices, thus making turning points in price clearer. Takeaways Turning poi

This MT5 indicator is my newest trading indicator which gives traders an accurate entry to buy or to sell. This can be used to scalp or swing-trade on longer time-frames but you will need to set your own stop loss and profit targets as the markets are unpredictable. This indicator can always provide the trader with at least a few pips of profit from scalping. Buy when you see a green arrow and sell when you see a red arrow. It's as easy as that.
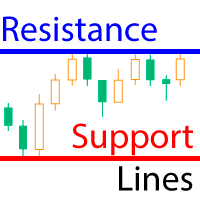
El indicador calcula líneas fractales que son líneas de soporte/resistencia técnicamente psicológicas. De hecho, son los máximos y mínimos del precio durante un periodo de tiempo. El indicador funciona en todos los gráficos y plazos. Esta versión gratuita del indicador Resistance Support Lines Pro ¡viene tal cual! Opciones: Estos ajustes no pueden modificarse en esta versión Fractal Candels = 5 - el número de candeleros en base a los cuales se construye un fractal. Calcula el máximo/mínimo al qu
FREE

ICT Silver Bullet
If you are searching for a reliable indicator to trade the ICT Silver Bullet concept, or ICT concepts, Smart Money Concepts, or SMC, this indicator will respond to your need! Before version 2.2, this indicator was focused only on ICT Silver Bullet, but moving forward, we will include the different elements for smart money concept trading. This indicator will help you identify the following: FVG - fair value gaps Market structure: BOS and CHOCH. It is based on ZIGZAG as it is
Bienvenido al Indicador Provlepsis
"Provlepsis" es un indicador altamente avanzado diseñado para el Mercado MQL. Analizando barras anteriores con la misma hora del día, calcula con precisión el rango potencial del movimiento del mercado, brindando información valiosa sobre futuras fluctuaciones de precios. A diferencia del indicador ATR tradicional, "Provlepsis" tiene en cuenta el factor tiempo, lo que resulta en una herramienta más poderosa que se adapta a diferentes condiciones de mercado. Du
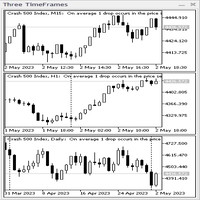
Panel indicador de tres TimeFrames. El indicador está hecho en forma de panel basado en la clase CAppDialog. El panel se puede minimizar o mover alrededor del gráfico actual usando el mouse. El indicador muestra tres períodos de tiempo del símbolo actual en el panel. En la versión actual, el indicador tiene un número mínimo de configuraciones: estos son los parámetros de tres períodos de tiempo: "Período de tiempo más joven", " Período de tiempo medio " y " Periodo de tiempo más antigu
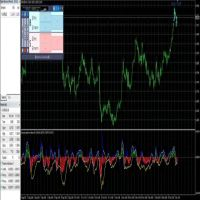
This is a predictive indicator ( leading indicator ) that uses Bayes' formula to calculate the conditional probability of price increases given the angular coefficient. The indicator calculates the angular coefficient and its regression and uses it to predict prices.
Bayes' theorem is a fundamental result of probability theory and is used to calculate the probability of a cause causing the verified event. In other words, for our indicator, Bayes' theorem is used to calculate the conditional pr

Jackson Support and Resistance V it a powerful advance support and resistance indicator which provide signal base on price action, it Design to make things easy for everyone to draw support and resistance. we believe most strategies are built with support and resistance as a foundation .Having support and resistance perfect can be a game change to you way of trading. It flexible to all instrument .don't forget to watch our video on how to us this indicator prefect and progressive.
FREE
El Mercado MetaTrader es una plataforma única y sin análogos en la venta de robots e indicadores técnicos para traders.
Las instrucciones de usuario MQL5.community le darán información sobre otras posibilidades que están al alcance de los traders sólo en nuestro caso: como la copia de señales comerciales, el encargo de programas para freelance, cuentas y cálculos automáticos a través del sistema de pago, el alquiler de la potencia de cálculo de la MQL5 Cloud Network.
Está perdiendo oportunidades comerciales:
- Aplicaciones de trading gratuitas
- 8 000+ señales para copiar
- Noticias económicas para analizar los mercados financieros
Registro
Entrada
Si no tiene cuenta de usuario, regístrese
Para iniciar sesión y usar el sitio web MQL5.com es necesario permitir el uso de Сookies.
Por favor, active este ajuste en su navegador, de lo contrario, no podrá iniciar sesión.