MetaTrader 5용 새 기술 지표 - 13
The Volatility Proper Index indicator displays the volatility index of a trading symbol in a separate window.
To calculate volatility, the calculation of price deviations from the moving average is used.
Indicator parameters:
Period - the number of recent bars for which the volatility index is calculated.
MinThreshold - the minimum price deviation from the moving average, at which this deviation is taken into account in the calculations.
AveragePeriod - moving average period,
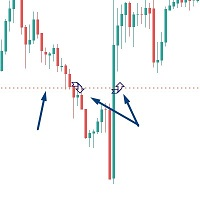
Introductory Offer! *** Only $47 - normal price $97 !! *** Ends soon - don't miis it!! The Close Above or Below Price Indicator is part of my suite of Price and Trendline Alerts Indicators. I'm excited to introduce the Close Above or Below Price Indicator – part of my new suite of Price and Trendline Alert Indicators – fantastic tools designed to alert you when candles close above or below significant prices in the markets you trade. With this indicator, you can set up to 4 price alerts on a

XP Speed Meter the best indicator that measures the price/tick’s currency speed for you. It will give you the ability to know when the pair moving fast or slow . So, you can trade or not trade. It’s very important tool for scalper traders – news traders. Even for trend traders it will be useful to know if the market is trending fast or slow . XP Speed Meter is better than the volume type indicators of course. Because it shows the currency speed on the run-time without any lacking like what the v

To get access to MT4 version please click here . This is the exact conversion from TradingView: "RedK_Supply/Demand Volume Viewer v3.0" by "RedKTrader" This is a light-load processing and non-repaint indicator. All input options are available. Buffers are available for processing in EAs. You can message in private chat for further changes you need. Thanks for downloading
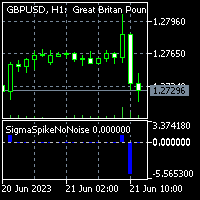
To get access to MT4 version please click here . This is the exact conversion from TradingView: "Sigma Spikes No Noise" by "irdoj75" This is a light-load processing and non-repaint indicator. All input options are available. Buffers are available for processing in EAs. You can message in private chat for further changes you need. Thanks for downloading...

This will find a possible reverse area and show entry signal and this strategy is using every candle and calculate them
buyer should us e with other indicators to get the best trade entry like Macd , RSI , or EMA . SMA.
Make sure try demo first it will supprise you all because how good it is
i hope you guy enjoy it but my coding is not good, so i cant code any EA for this , my own strategy
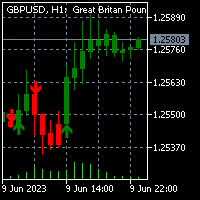
To get access to MT4 version please click here . This is the exact conversion from TradingView: "UT Bot Alerts" by "QuantNomad". This is a light-load processing and non-repaint indicator. Buffers are available for processing in EAs. You can message in private chat for further changes you need. Here is the source code of a simple Expert Advisor operating based on signals from UT Bot Alerts . #include <Trade\Trade.mqh> CTrade trade; int handle_utbot= 0 ; input group "EA Setting" input int magic_

수익성 있는 시장 동향을 놓치는 데 지쳤습니까? 정확하고 정확하게 추세 지속을 식별할 수 있는 신뢰할 수 있는 도구를 원하십니까?
더 이상 보지 마세요! 당사의 Trend Continuation Indicator는 귀하의 거래 전략을 강화하고 게임에서 앞서 나갈 수 있도록 도와드립니다.
추세 지속 지표는 트레이더가 다양한 금융 시장에서 추세 지속 패턴을 식별하고 확인하는 데 도움을 주기 위해 특별히 제작된 강력한 도구입니다.
주식, 통화, 원자재 또는 지수를 거래할 때 이 지표는 거래 결정을 향상시키는 최고의 동반자입니다. MT4 버전 : WH Trend Continuation MT4
특징:
정확한 추세 확인. 사용자 정의 가능한 매개변수. 사용하기 쉬운 인터페이스. 실시간 알림. 포괄적인 지원. MT5용 Trend Continuation Indicator를 사용하여 거래 전략을 새로운 차원으로 끌어올리십시오. 추세 분석의 힘을 받아들이고

To get access to MT4 version please click here . This is the exact conversion from TradingView: "ZLSMA - Zero Lag LSMA" by "veryfid". This is a light-load processing indicator. This is a non-repaint indicator. Buffers are available for processing in EAs. All input fields are available. You can message in private chat for further changes you need. Thanks for downloading

Provlepsis 지표에 오신 것을 환영합니다.
"Provlepsis"는 MQL 마켓을 위해 개발된 고급 지표입니다. 같은 시간대의 이전 바를 분석하여 시장 움직임의 잠재적 범위를 정확하게 계산하여 향후 가격 변동에 대한 소중한 통찰력을 제공합니다. 전통적인 ATR 지표와 달리 "Provlepsis"는 시간 요소를 고려하여 다양한 시장 조건에 적응하는 더 강력한 도구입니다. 밤에는 좁은 범위를 예측하고 활발한 거래 시간대에는 더 넓은 범위를 예측합니다. "Provlepsis"가 제공하는 포괄적인 범위 분석으로 거래 전략에서 경쟁 우위를 확보하세요. 여기에서 Provlepsis 지표의 길이와 시프트를 변경할 수 있는 전체 버전을 확인할 수 있습니다!
https://www.mql5.com/ko/market/product/98802
프로블렙시스 사용의 이유
범위 기반 트레이딩: 이 지표는 시장 움직임의 잠재적 범위를 식별하는 능력으로 범위 기반 트레이딩 전략에 가치를 제공할
FREE

This Engulfing Candle Indicator as the name implies can detect engulfing candlestick patterns on the chart. The indicator alerts the user of the presence of an engulfing candle (Bearish engulfing candle and Bullish engulfing candle) by using visual representation of arrows on the chart. - Blue arrow for Bullish engulfing - Red arrow for Bearish engulfing Extra modifications can be added based on request.
FREE
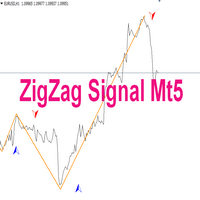
Indicator description: Indicator - ZigZag Signal is created on the basis of a well-known and popular indicator - ZigZag. The indicator can be used for manual or automatic trading by Expert Advisors. 1. The ZigZag Signal indicator has alerts of different notifications for manual trading. 2. If used in Expert Advisors, the indicator has signal buffers for buying and selling. You can also prescribe and call the indicator as an external resource and other settings and applications: (email me in a
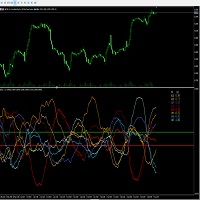
The qualitative indicator calculates the difference between USD, EUR, GBP, AUD, JPY, CHF, NZD, CAD currency pairs. The calculation is carried out online; it calculates supply and demand among themselves in various bundles. The display can be observed in two modes: general for all eight pairs and also specifically for the selected pair. An important indicator of the indicator is the zero axis, which indicates the general trend of currencies and their advantage relative to each other. The indicato

The indicator detects the beginning of a new trend not directly, but by comparing two forecast values based on the available history. Its action is based on the assumption that the predicted (historically normal) price and the real price differ due to the appearance of "new" force (unbalanced impact on the market), which usually leads to a significant market correction in an unstable market. The indicator does not track market stability, so it is recommended to use other methods to control vol

This indicator builds upon the previously posted Nadaraya-Watson Estimator. Here we have created an envelope indicator based on kernel smoothing with integrated alerts from crosses between the price and envelope extremities. Unlike the Nadaraya-Watson Estimator, this indicator follows a contrarian methodology. Please note that the indicator is subject to repainting. The triangle labels are designed so that the indicator remains useful in real-time applications.
Settings
Window Size: Dete

Moving Average Band is a tool designed to provide traders with a more comprehensive and realistic perspective when using moving averages in their technical analysis. Unlike conventional moving averages plotted as lines, Moving Average Band introduces a unique approach by representing the moving average as a dynamically adjusting band based on market volatility.
Volatility is an intrinsic characteristic of financial markets, and understanding how it impacts trends and price movements is essent

To get access to MT4 version please click here . This is the exact conversion from TradingView: "Candle body size" by "Syamay". This is a light-load processing indicator. This is a non-repaint indicator. Buffers are available for processing in EAs. All input fields are available. You can message in private chat for further changes you need. Thanks for downloading
FREE

The MultiTimeframe Volume Zones Indicator is a powerful tool designed to provide traders with comprehensive insights into market dynamics. It combines several essential features, including volume analysis, Dow Zones, buy and sell arrows, candle timer, and market movement across different time frames. This all-in-one indicator equips traders with valuable information to make informed trading decisions. Key Features: Volume Analysis: Gain a deep understanding of market sentiment and strength by an
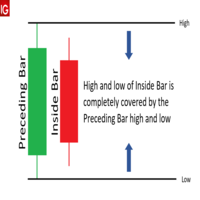
The Inside bar indicator can detect where inside bars occur in the charts and will change the color of the candle based on user inputs. Please note that the color can differ based on the current color of the candle due to supposition of the colors. Here are the characteristics of an inside bar pattern: High: The high of the bearish candle is lower than the high of the previous bullish candle. Low: The low of the bearish candle is higher than the low of the previous bullish candle. Body: The bo

To get access to MT4 version please click here . This is the exact conversion from TradingView: "[SHK] Schaff Trend Cycle (STC)" by "shayankm". This is a light-load processing indicator. This is a non-repaint indicator. Buffers are available for processing in EAs. All input fields are available. You can message in private chat for further changes you need. Thanks for downloading
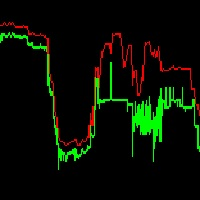
It is super imporant to know what the spread is on your charts!
This indicator displays the Ask High of the past bars, similar to that of the backtester. This allows you to see the spread of bars in real time.
The spread of the bar is the ask-bid price. The spread of a bar is the minimum spread of any ticks found within that bar. I hope this makes sense.
If you have any questions or feedback, let me know - thank you.

This is one of my preferred indicators where it plots on the chart Railroad Track candles, i.e. candles that have similar size. It is a very good indicator for trend direction. In the settings there is an option for Max candle size and Min candle size and also for the percentage for the tolerance between the Min and Max candle size. The candles values are calculated for High and Low. Have fun and enjoy trading! P.S. Please send me a message or leave a comment with any suggestions or improvements

30$에서 5/10 복사 ---> 다음 50$ // MT4 버전
외환 활력은 8가지 주요 통화(EUR, GBP, AUD, NZD, USD, CAD, CHF, JPY)의 모멘텀 강도를 평가하는 기술 지표입니다. 이 지표는 28개 통화쌍 간의 상관관계 부족을 측정하는 수학적 계산에 의존합니다. 값을 계산하기 위해 선형 가중 평균법(LWMA)과 모델에서 유의성이 없는 값을 제거하는 통계 시스템을 사용하여 종가 간의 백분율 차이를 분석합니다. 이 방법은 최근 가격 변동에 더 큰 의미를 부여하는 가중 평균을 제공합니다. 이 백분율 차이를 고려하면 이 지표는 통화 모멘텀의 강도와 방향을 측정할 수 있습니다.
주요 통화의 모멘텀 강도를 평가하고 시장 역학에 대한 귀중한 통찰력을 제공하는 이 지표는 트레이더가 잠재적 거래 기회를 파악하고 정보에 입각한 거래 결정을 내리고 리스크를 효과적으로 관리하는 데 도움이 될 수 있습니다. 특징 다시 칠하지 않음 이 표시기는 새 데이터가 도착해도
차트에 그리기 기능을 제공하는 "Draw On Chart Indicator"를 소개합니다: 차트에서 창의력을 발휘하세요!
분석을 주석으로 추가하거나 아이디어를 효과적으로 전달하기 위해 트레이딩 차트에 주석을 달기 위해 애를 쓰는 데 지쳤나요? 더 이상 찾아볼 필요가 없습니다! 저희는 자랑스럽게 "Draw On Chart Indicator"를 선보입니다. 이 혁신적인 도구를 사용하면 몇 번의 클릭 또는 펜 스트로크로 차트에 직접 그리고 주석을 추가할 수 있습니다.
저희 혁신적인 "Draw On Chart Indicator"는 차트 분석 경험을 향상시키고 창의력을 발휘할 수 있도록 설계되었습니다. 이 강력한 도구를 사용하면 손쉽게 생각을 표현하고 핵심 레벨을 표시하며 패턴을 강조하고 트레이딩 전략을 시각적으로 표현할 수 있습니다. 숙련된 트레이더, 기술적 분석가 또는 트레이딩의 매혹적인 세계를 탐험하는 초보자라 할지라도, "Draw On Chart Indicator"는 차트와
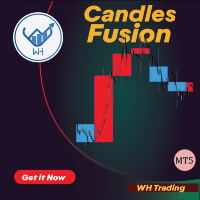
캔들 퓨전은 현재 시간대에 더 높은 시간대의 양초를 표시하여 거래 분석을 향상시키는 강력한 MT5 표시기입니다.
이 고유한 기능은 트레이더에게 다양한 시간대에 걸쳐 가격 움직임에 대한 포괄적인 보기를 제공하여 정보에 입각한 거래 결정을 내릴 수 있도록 합니다. 특징:
다중 시간대 오버레이. 사용자 지정 가능한 기간 선택. 명확한 시각화. 실시간 업데이트. 사용자 친화적 인 인터페이스.
캔들 퓨전은 시장 역학에 대한 포괄적인 이해와 현재 차트에 더 높은 시간대의 캔들을 병합하여 거래 정밀도를 높이려는 트레이더를 위한 필수 도구입니다. 이를 통해 트레이더는 주요 지원 및 저항 수준을
식별하고 추세 반전을 발견하고 숨겨진 거래를 발견할 수 있습니다. 더 정확하게 기회를 제공합니다.
질문이 있으시면 언제든지 저에게 연락하십시오

The MAtrio indicator displays three moving averages on any timeframe at once with a period of 50-day, 100-day, 200-day. After attaching to the chart, it immediately displays three moving averages with the parameters of simple (SMA) moving average MAmethod50 , simple (SMA) moving average MAmethod100 , simple (SMA) moving average MAmethod200 . Accordingly, with the price type MAPrice50 , MAPrice100 , MAPrice200 , by default, the price is Close price everywhere. All parameters (MA calc
FREE

JCAutoFibonacci 简繁自动绘制斐波那契 1.Zigzag3浪,大中小三浪分别代表市场潮流、趋势、涟漪,以不同参数实现。 使用自定义函数获取三浪高低点,以最近高低点作为绘制价格与时间。 2.Fibonacci,黄金分割线,水平线比例0、0.236、0.318、0.50、0.618、1.0、1.236、1.382、1.50、1.618、2.0等。 斐波那契返驰理论包括:反弹/回调现象、反转现象。合理绘制Fibonacci获取市场有效SR。分别绘制三浪。 3.自定义Fibo颜色,自定义水平线比例(0为不显示),自定义水平线颜色,自定义可选择,自定义右射。 备注:如遇使用问题,请联系邮箱:16692618587@163.com
FREE

The indicator is built on a principle similar to neural networks, and it calculates a multidimensional polynomial. When you install it on a chart or make changes to the indicator's parameters, or when you switch the chart period, the indicator is initially initialized. During initialization, not only the entire period of the chart is recalculated, but also the indicator is self-trained. The indicator's parameters include Sensitivity, Forecast, and degree of harmonization. The indicator theoretic
FREE

If you have been anywhere near Forex forums or social media lately, you have no doubt been hearing people talk about Smart Money Concepts (SMC) trading. You may be wondering what SMC is, and whether it deserves all the hype. In this post, we will introduce Smart Money Concepts trading to you so you can make an informed decision about whether or not to give this strategy a try in your own trading. What is SMC Forex trading? Smart Money Concepts (SMC) is one of many forex trading methods. SMC
Volumen del especulador Es un indicador que captura la fuerza del volumen de compra y venta. donde es muy fácil de usar, mostrándote la fuerza alcista y la fuerza bajista. En este gráfico está el claro ejemplo de cómo se utiliza, en el par VOLATILITY 75 donde esta la tea verde junto con la flecha que indica la compra, y ahí está la vela roja con la flecha marcando la venta del par, los parámetros a utilizar son Volumen : 5 Tiempo : 1000 para que capte toda la tendencia y se note mejor cuando co
The Volume Change indicator displays in a separate window the change in volume and the direction of price movement in the form of a line.
Indicator parameters: VolumeTimeframe - timeframe on which the indicator takes data. VolumeApplied - volume type: Tick volume/Real volume. VolumePeriod - period of the moving average on the VolumeTimeframe, against which the volume change is calculated.
This indicator can be used to build a trading system based on tracking price movements w

The index makes it easy for traders to know the opening and closing times of global markets :
- Sidney - Tokyo - London - New York
Where it misleads each time zone and enables us to know the times of overlapping the markets when the liquidity is high.
To get more indicators and signals, follow us on the Telegram channel link
https://t.me/tuq98
Or our YouTube channel, which has explanations in Arabic and a technical analysis course
https://www.youtube.com/@SSFX1
FREE

JCStatistics 简繁数据统计 1.显示账户信息:内容显示 交易员、账号、本金、杠杆、保证金、保证金比例、余额、净值; 日周月开盘余额、持仓收益、日收益、周收益、月收益; 收益为正时显示红色字体,收益为负时显示绿色字体; 日收益低于-5%时显示CircuitBreak; 总收益低于-10%时显示MarginCall; 2.显示统计数据: 收益(收益率)(交易量)(胜率) 5日数据;4周数据;12月数据; 3.当前标的统计:Symbol()收益(交易量)(胜率) 4.主流标的统计:收益(交易量)(胜率) 可以选择性显示账户信息、数据信息,调整显示颜色,调整字体,调整字体大小。 指标删除后自动删除桌面文字及背景。 备注:如遇使用问题,请联系邮箱:16692618587@qq.com.
FREE
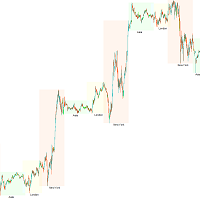
거래 세션, 시장 시간, 세션 시간, 외환 시간, 거래 일정, 시장 개/폐장 시간, 거래 시간대, 세션 지표, 시장 시계, ICT, 아시아 킬존, 런던 킬존, 뉴욕 킬존
트레이더들은 거래 시간대의 영향을 주목해야 합니다. 다른 시장 활동 시간과 거래량은 통화 쌍의 변동성과 거래 기회에 직접적인 영향을 미칠 수 있습니다. 트레이더들이 시장 상황을 종합적으로 이해하고 더 나은 거래 전략을 수립할 수 있도록 도와주기 위해 거래 세션 지표를 개발했습니다.
이 지표는 아시아, 런던, 뉴욕 시장의 거래 시간을 표시합니다. 사용자는 더 편리한 사용을 위해 다른 거래 시간대를 표시하거나 숨길 수 있습니다. 또한 설정에 따라 거래 세션의 이름을 표시하거나 숨길 수 있으며, 최대 표시 수를 제한할 수 있습니다.
실제 사용 프로세스는 매우 간단합니다. 지표를 구매한 후, 지표 파일을 메타트레이더 5 플랫폼의 지표 폴더에 복사하고, 메타트레이더 5 플랫폼에서 지표를 적용할 차트를 엽니다. 지
FREE

King of Dragon 채널, King of Dragon 표시기, King of Dragon 시스템, King of Dragon MT5, King of Dragon 클래식 표시기, King of Dragon 스와이프 시스템, 킹 오브 드래곤 올인원
클래식 채널 거래 시스템인 King of Dragon 채널 거래 시스템은 많은 사용자가 MT5 버전을 강력하게 요청합니다. 이 프로그램은 여러 버전에서 성능을 위해 최적화되었으며 이미 비교적 원활한 시스템입니다. 49$ → 59$ 빨간색 영역, 긴 추세, 짧지 않고 길기만 함 녹색 영역, 짧은 추세, 짧고 길지 않음 회색 영역, 통합 추세, 충격 지표의 길고 짧은 작동 참조 https://www.mql5.com/ko/market/product/96760
매개변수 "===== 메인 =====" int CalcalueBars = 1000;//계산된 막대 수 color BeltColor = clrGray;//트렌드 벨트의 색상 bo
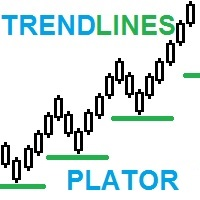
트렌드플레이터: 최적화된 거래 전략을 위한 강력한 추세 예측 지표 우리의 새로운 지표의 힘을 발견하세요! 더 큰 시간 프레임의 추세선을 계산하고 현재 시간 프레임에 직접 예측하여 모든 트레이더의 주목을 끄는 전략적인 지원을 제공합니다. 이러한 포인트는 거래에 강력한 지지나 저항 수준이 되어 거래 전략을 촉진합니다. Price action 지표 컬렉션에 완벽하게 부가되는 지표에 대한 액세스를 상상해보세요. 우리의 새로운 지표가 바로 그것입니다! 테스트해 보고 그 정확성에 놀라워하십시오. 이는 당신의 전략에 부족한 조각이 될 수 있으며 결과를 향상시킬 수 있습니다. 시간을 낭비하지 마세요! 이 멋진 도구를 거래 아카이브에 추가하는 기회를 활용하십시오. 그 가치와 잠재력을 인정한다면 지금 구매하는 것을 망설이지 마십시오. 강력한 지표와 함께 성공의 새로운 수준에 도달하여 정확도를 높이세요! 새로운 소식을 놓치지 마세요 독점적인 출시 소식을 받으려면 지금 가입하세요. 프란시스코 고메스 다

Was: $69 Now: $34 Blahtech VWAP - Volume Weighted Average Price (VWAP) is the ratio of price to total volume. It provides an average price over a specified time interval. Links [ Install | Update | Documentation ] Feature Highlights
Configurable VWAP Line Sessions, intervals, anchored or continuous Previous day settlement line Standard Deviation bands Alerts at bar close or real time Automatic Broker or Tick volumes Significantly reduced CPU usage
Input Parameters
Expert Advisor

볼륨 가중 평균 가격 지표는 MT5의 메인 차트 창에 표시되는 라인 스터디 지표입니다. 이 표시기는 일반적인 가격을 모니터링한 다음 표시기 라인을 거래량이 많은 가격으로 자동 푸시하는 데 사용되는 거래량을 모니터링합니다. 이 가격은 가장 많은 계약(또는 랏)이 거래된 곳입니다. 그런 다음 이러한 가중 가격은 되돌아보는 기간 동안 평균화되고 지표는 푸시된 가격에서 라인 연구를 보여줍니다.
이 게시물의 지표를 통해 트레이더는 해당 룩백 기간의 일일 시작 시간을 설정할 수 있습니다. 이 표시기는 자동으로 5개의 일일 룩백 기간(현재 형성 기간 및 동일한 시작 시간을 기준으로 이전 4일)을 표시합니다. 이러한 이유로 이 지표는 일중 거래에만 사용됩니다. 표시기는 해당 날짜의 수직 일일 시작 시간 구분선도 자동으로 표시합니다. 일반적인 가격과 거래량은 하루 종일 누적되며 하루 종일 처리됩니다.
중요 업데이트: 이 지표의 v102를 사용하면 VWAP 및 밴드의 시작을 가장 최근의 주요
대수 이동 평균 지표는 지수 이동 평균의 공식을 반전시키는 이동 평균입니다.
많은 거래자들은 로그 차트를 사용하여 가격 변동의 길이를 분석하는 것으로 알려져 있습니다. 이 게시물의 표시기는 표준 시간 척도 차트에서 가격의 대수 값을 분석하는 데 사용할 수 있습니다.
거래자는 다음 입력 매개변수를 설정할 수 있습니다.
MAPeriod [기본값: 9] - 가격을 더 부드럽게 하려면 더 높은 숫자로 설정하고 대수 이동 평균 선 연구의 더 빠른 반전을 위해 더 낮은 숫자로 설정합니다.
MAShift [기본값: 3] - 가격 교차의 양을 줄이려면 더 높은 숫자로 설정하고, 가격 교차가 더 자주 발생하려면 더 낮은 숫자로 설정하십시오.
표시기 라인(표시기 버퍼)은 Expert Advisor 빌더 소프트웨어 또는 사용자 정의 코딩된 Expert Advisors에서 생성된 Expert Advisors에서 iCustom으로 호출할 수 있습니다.

Trading Hours 표시기는 콘크리트 거래소의 시작 및 종료 시간을 나타내는 프레임을 차트로 그립니다. 입력: 입력 매개변수 `UTC 시간대 이동`은 UTC에서 사용자의 시간대 이동을 설정합니다. 다른 매개변수는 프레임을 표시하거나 숨기거나 색상을 설정하는 데 사용됩니다. 특징: 콘크리트 교환의 시작 및 종료 시간을 나타내는 프레임을 차트로 그립니다. 선택한 교환에 대한 프레임 표시/숨기기, 선택한 교환의 색상을 설정합니다. 17개 대형 거래소 지원, 1일보다 작은 기간만 지원합니다. Market-Instruments 에서 개발
Trading Hours 표시기는 콘크리트 거래소의 시작 및 종료 시간을 나타내는 프레임을 차트로 그립니다. 입력: 입력 매개변수 `UTC 시간대 이동`은 UTC에서 사용자의 시간대 이동을 설정합니다. 다른 매개변수는 프레임을 표시하거나 숨기거나 색상을 설정하는 데 사용됩니다. 특징: 콘크리트 교환의 시작 및 종료 시간을 나타내는 프레임을 차

This is a derivative of John Carter's "TTM Squeeze" volatility indicator, as discussed in his book "Mastering the Trade" (chapter 11).
Gray dot on the midline show that the market just entered a squeeze (Bollinger Bands are with in Keltner Channel). This signifies low volatility, market preparing itself for an explosive move (up or down). Blue dot signify "Squeeze release".
Mr.Carter suggests waiting till the first blue after a gray dot, and taking a position in the direction of the mo
FREE

The initial balance (IB) is a range in which the price spent its first two OPT periods after the opening. In other words, the opening balance is a range of the first hour after the market opened. The opening balance arose from room trading, as room traders observed the various ranges after the market opened.
This indicator allows you to enter the starting and ending hours and minutes of a specific hourly time range so that the trader can set up different IBs according to the market.
Autom
FREE

Description: Strategy based around Open-Close Crossovers. Setup: I have generally found that setting the strategy resolution to 3-4x that of the chart you are viewing tends to yield the best results, regardless of which MA option you may choose (if any) BUT can cause a lot of false positives - be aware of this. Don't aim for perfection. Just aim to get a reasonably snug fit with the O-C band, with good runs of green && red. Option to either use basic open && close series data or pick your pois
FREE

Boom Scalper Gold It is an indicator, programmed to scalp in a timeframe of 1/5 and 15 Minutes, perfect for hunting spikes and trend sails, where in the parameters of (70) it sends you a sale/sell alert and in the level parameter (8) it sends you a buy signal It is used for indices (BOOM) of synthetic indices (Deriv) It's easy and simple to use, it does all the work by sending you the alerts! the indicator during this period will remain on SALE! Without further ado, enjoy! Good profit. World Inv

The seven currencies mentioned are: GBP (British Pound): This is the currency of the United Kingdom. AUD (Australian Dollar): This is the currency of Australia. NZD (New Zealand Dollar): This is the currency of New Zealand. USD (United States Dollar): This is the currency of the United States. CAD (Canadian Dollar): This is the currency of Canada. CHF (Swiss Franc): This is the currency of Switzerland. JPY (Japanese Yen): This is the currency of Japan. Currency strength indexes provide a way to
FREE
Crash Scalper Gold It is an indicator, where it marks points of purchase and points of sale As the name says, it is used to scalp in the pairs of (Crash) 1000/500/300 where it sends you signals of sale/Sell and purchase/Buy at level points (90) he sends you the sell signal, (Spike) at the level point (27) it sends you the buy signal, (Trend Candles) It is very simple and easy to use. to make the best tickets possible! For this period it will remain on sale! Without further ado, enjoy! Good profi
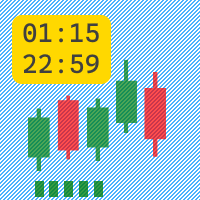
The Active Session indicator displays an active trading session in the form of green candles in a separate window.
Indicator parameters:
Monday = true/false - trade on Monday if the parameter is true.
Tuesday = true/false - trade on Tuesday if the parameter is true.
Wednesday = true/false - trade on Wednesday if the parameter is true.
Thursday = true/false - trade on Thursday if the parameter is true.
Friday = true/false - trade on Friday if the parameter is true.
StartHou
Xau/Usd Scalper It is a unique indicator where it counts the low/high to make buy and sell entries! where you mark the entries with arrows next to the lows and highs used in m15/H1 to make longer and more valuable entries It is very simple and easy to use It also works for forex pairs and synthetic indices! Without further ado, enjoy! good profit World Investor!!
Step Scalper , It is an indicator with alerts, where it sends you buy and sell alerts accompanied by a moving average of 21 periods It is very easy and simple to use. where on the path of the green period marks the purchase of the asset , and the path of the red period marks the sale of the asset, It is used for scalping on M5/M15 but it is also recommended use it in periods of 1 hour since it captures the buying or selling trend, to get more profit! no more to enjoy good profit World Investor!

*This is trading view indicator converted in mql5*
The HA Market Bias Indicator is a popular tool used in trading and technical analysis, designed to help traders identify market bias and potential trend reversals. It is commonly used in conjunction with candlestick charts and provides valuable insights into market sentiment. The indicator is based on the Heiken Ashi (HA) candlestick charting technique, which aims to filter out market noise and provide a smoother representation of price actio
FREE

This is a multi-timeframe indicator that detects and displays support and resistance (S&R) lines using the ZigZag indicator.
Features
The support and resistance lines are not redrawing. The indicator is capable of adding new support and resistance levels as they appear. Each S&R line has a tooltip that displays the price level and start time. Save time for multi-timeframe analysis on trades. All types of alerts (sound, pop-up, email, mobile push notification) are available. Working with al

A visual Order Book is a powerful tool used in the financial market to provide a detailed view of buy and sell orders in a given financial instrument in real time.
This visual representation allows traders to observe the liquidity available in the market, identify the supply and demand levels at different prices and follow the evolution of orders as they are placed, modified or withdrawn.
By analyzing the visual Order Book, traders can identify trading patterns, detect possible reversal poi

candlestick time it a useful indicator ,it help to keep you alert with the candlestick time ,how far to be completed at the chosen period , it help to keep you patience which is a biggest thing that holds trades down ,try it to improve you way of trading. it work on any broker any time frame and any symbol. you can customize the color on input. it can work on multiple timeframe. Thank you !
FREE

Logarithmic chart in new window You can use both chart as half or full window All features are active in both arithmetic and logarithmic charts Magnet in arithmetic chart is standard metatrader magnet in logarithmic chart magnet have two modes: first mode only select high or low, if this mode is enabled, you can set how many candles will be search before and after to find the highest or lowest points second mode select the closest point of the candle to click, its choose between 4 points (High,
FREE
Provlepsis 지표에 오신 것을 환영합니다.
"Provlepsis"는 MQL 마켓을 위해 개발된 고급 지표입니다. 같은 시간대의 이전 바를 분석하여 시장 움직임의 잠재적 범위를 정확하게 계산하여 향후 가격 변동에 대한 소중한 통찰력을 제공합니다. 전통적인 ATR 지표와 달리 "Provlepsis"는 시간 요소를 고려하여 다양한 시장 조건에 적응하는 더 강력한 도구입니다. 밤에는 좁은 범위를 예측하고 활발한 거래 시간대에는 더 넓은 범위를 예측합니다. "Provlepsis"가 제공하는 포괄적인 범위 분석으로 거래 전략에서 경쟁 우위를 확보하세요. 최초 20개 다운로드 가격: 35.00달러
다음 가격: 60.00달러
프로블렙시스 사용의 이유
범위 기반 트레이딩: 이 지표는 시장 움직임의 잠재적 범위를 식별하는 능력으로 범위 기반 트레이딩 전략에 가치를 제공할 수 있습니다. 트레이더는 이 지표를 사용하여 예상 범위 내에서 주요 지지선과 저항선을 식별하고 그에 맞게 거래를

If your strategy requires trading during a certain period of market activity - calm or turbulent, this indicator will help you find such periods of time within a week for each currency pair using statistics.
The principle of the indicator is quite simple.
The entire trading week, from Monday 00:00 to Friday 23:59, is divided into timeslots, the duration of which corresponds to the current timeframe.
For each timeslot, activity is calculated - the average value of the difference between the
FREE

This all-in-one indicator displays real-time market structure (internal & swing BOS / CHoCH), order blocks, premium & discount zones, equal highs & lows, and much more...allowing traders to automatically mark up their charts with widely used price action methodologies. Following the release of our Fair Value Gap script, we received numerous requests from our community to release more features in the same category. "Smart Money Concepts" (SMC) is a fairly new yet widely used term amongst price a

Jackson Support and Resistance V it a powerful advance support and resistance indicator which provide signal base on price action, it Design to make things easy for everyone to draw support and resistance. we believe most strategies are built with support and resistance as a foundation .Having support and resistance perfect can be a game change to you way of trading. It flexible to all instrument .don't forget to watch our video on how to us this indicator prefect and progressive.
FREE

Pinbar Outside Pattern indicator shows in a table symbol, time frame and direction of the last price candle if it matches outside pinbar input parameters. Outside pinbar means that the candle is extreme in the chosen time frame. By clicking ' Open chart ' button you can view drawn pattern. You can choose to scan through all the symbols in Market Watch or enter your favorite symbols, and also you can enter time frames you need to scan. ---------Main settings-------- Select all symbols from Market

Pack Volatility 75 1/3 In this indicator stage 1 I am pleased to present you the volatility 75 Buy/Sell Professional indicator. where in each temporary structure it will mark a sale and a safe purchase to operate manually, where the strategy is based on the lines EMA of 7 exponential periods and the EMA of 50 exponential periods. where purchasing a product comes 2 as a gift (it's the pack) purchasing any of the 3 products will be sent the remaining indicators, to be able to apply the strategy we
On this occasion I am pleased to present the (Boom 300 Professional Pack) where it consists of 4 indicators for the Boom 300 index of synthetic indices (Deriv Broker) Acquiring this indicator enables you the pack of the 4 boom 300 indicators where the rest of the indicators will be sent, This indicator is 1 of the 4 that includes the Buy/Sell strategy, sending you clear alerts where there buy or sell the pair It is recommended to use in a period of 15 minutes, to have a greater profit since the
Professional Pack Crash 300 Indicators, On this occasion I present the trend indicator that is for the crash index 300 (Deriv Broker) The indicator consists of a strategy where trends are caught in periods of 15 minutes, very clearly the indicator shows the purchase marking the tip of red until the trend develops, and then mark the green point of purchase, it is very simple to use, It is recommended to use in that temporality since it serves to catch longer trends and increase profit, the indica
Channel Stochastic Boom 1000 I am pleased to present the pack (Tendence Boom 1000) where on this occasion I present the Channel Stochastic Boom 1000 indicator for (Deriv Broker) where is 1 of the 4 indicators that the pack brings! The indicator consists of the sthochastic strategy, where it reaches the point of (0 Level) the purchase is made, taking advantage of hunting spike, where it reaches the point of (90 Level) the sale is made taking advantage of the trend candles! It is used in 1 minute

"Advanced Daily VWAP with Standard Deviation and Trading Bands" Description: "The 'Advanced Daily VWAP with Standard Deviation and Trading Bands' indicator offers a comprehensive view for traders who wish to make the Volume Weighted Average Price (VWAP) the crux of their trading strategy. It not only calculates the VWAP on a daily basis but also incorporates standard deviation to give an accurate representation of market volatility. The trading bands are calculated using a 1.5% multiplier for th

The big figure is a crucial aspect of forex trading, serving as a reference point for trade execution, risk management, and technical analysis. By understanding the importance of the big figure and incorporating it into their trading strategies, forex traders can improve their decision-making process and increase the likelihood of successful trades. Why is the Big Figure Important? The big figure is important for several reasons: Simplification: Traders often refer to the big figure when discu
FREE

The Fisher Transform is a technical indicator created by John F. Ehlers that converts prices into a Gaussian normal distribution. The indicator highlights when prices have moved to an extreme, based on recent prices. This may help in spotting turning points in the price of an asset. It also helps show the trend and isolate the price waves within a trend. The Fisher Transform is a technical indicator that normalizes asset prices, thus making turning points in price clearer. Takeaways Turning poi
FREE

The Fisher Transform is a technical indicator created by John F. Ehlers that converts prices into a Gaussian normal distribution. The indicator highlights when prices have moved to an extreme, based on recent prices. This may help in spotting turning points in the price of an asset. It also helps show the trend and isolate the price waves within a trend. The Fisher Transform is a technical indicator that normalizes asset prices, thus making turning points in price clearer. Takeaways Turning poi

This MT5 indicator is my newest trading indicator which gives traders an accurate entry to buy or to sell. This can be used to scalp or swing-trade on longer time-frames but you will need to set your own stop loss and profit targets as the markets are unpredictable. This indicator can always provide the trader with at least a few pips of profit from scalping. Buy when you see a green arrow and sell when you see a red arrow. It's as easy as that.
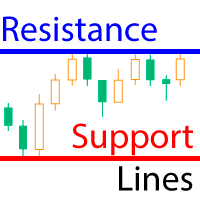
The indicator calculates fractal lines, which are technically psychological support/resistance lines. In fact, these are the highs and lows of the price over a period of time. The indicator works on all charts and timeframes. This free version of the Resistance Support Lines Pro indicator comes as is! Settings: These settings cannot be changed in this version Fractal Candels = 5 - number of candles from which a fractal is built. Calculates the maximum/minimum at which a psychological price can b
FREE

ICT Silver Bullet
If you are searching for a reliable indicator to trade the ICT Silver Bullet concept, or ICT concepts, Smart Money Concepts, or SMC, this indicator will respond to your need! Before version 2.2, this indicator was focused only on ICT Silver Bullet, but moving forward, we will include the different elements for smart money concept trading. This indicator will help you identify the following: FVG - fair value gaps Market structure: BOS and CHOCH. It is based on ZIGZAG as it is
MetaTrader 마켓은 거래로봇과 기술지표를 판매하기에 최적의 장소입니다.
오직 어플리케이션만 개발하면 됩니다. 수백만 명의 MetaTrader 사용자에게 제품을 제공하기 위해 마켓에 제품을 게시하는 방법에 대해 설명해 드리겠습니다.
트레이딩 기회를 놓치고 있어요:
- 무료 트레이딩 앱
- 복사용 8,000 이상의 시그널
- 금융 시장 개척을 위한 경제 뉴스
등록
로그인
계정이 없으시면, 가입하십시오
MQL5.com 웹사이트에 로그인을 하기 위해 쿠키를 허용하십시오.
브라우저에서 필요한 설정을 활성화하시지 않으면, 로그인할 수 없습니다.