Nuevos robots comerciales e indicadores para MetaTrader 4 - 288
The Expert Advisor trades in the direction of the current trend, the algorithm is based on calculating the width of the trading range for a given interval and assessing price movements on short time intervals. If the impulse value exceeds a specified percentage of the trading range, a position is opened in the direction of the trend. The impulses are also additionally filtered using a special technique. When evaluating impulses, the tick history inside the bar is not used . The algorithm uses

The indicator draws trend lines based on Thomas Demark algorithm. It draws lines from different timeframes on one chart. The timeframes can be higher than or equal to the timeframe of the chart, on which the indicator is used. The indicator considers breakthrough qualifiers (if the conditions are met, an additional symbol appears in the place of the breakthrough) and draws approximate targets (target line above/below the current prices) according to Demark algorithm. Recommended timeframes for t
This indicator is based on the classical Envelopes indicator. The proposed indicator has the ability to increase a smooth-effect in the Envelopes Indicator. This indicator could play an important role in determining support and resistance. nPeriod input parameter determines the number of Bars for Moving Above Envelopes calculation.
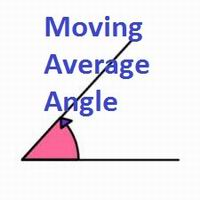
This indicator shows you the angle of the moving average according to your settings in a separate window. It also shows the angle written on the chart, which can also be adjusted. The main features and input variables provided include: MAPeriod: This is the period for your moving average. The default MAPeriod is 5. LookBack: This is a very important variable. It allows you to set the look back bar, from which the angle will be measured. For example, if your LookBack is 5, then indicator will cal

Smart Trend Line Alert es un indicador profesional de las líneas de tendencia, así como de las líneas de soporte/resistencia con la función de la alerta.
Características: El modo Auto y Click para convertir la nueva línea dibujada en la línea de alerta («Línea de tendencia» o «Línea horizontal»); La división entre las líneas de diferentes períodos de tiempo mediante la ocultación de las líneas de los períodos menores en los períodos mayores para no confundirse en la gran cantidad de líneas de
FREE

The indicator calculates critical price levels. If the level is red, the price has passed it downwards; if the level is blue, the price has passed it upwards. If the price is approaching the blue level from below, that level will most probably be broken through. If the price is approaching it from above, there will most probably be a rollback. Similarly, if the price is approaching the red level from above, the level will most probably be broken through. If the price is approaching it from below

The EA performs trade operations of closing position groups. Positions are grouped by type. It is possible to select orders by the profit (loss) value. It is possible to form the closure groups manually. You can set a value for automatic closure of a positions group after reaching a certain profit/loss level or price level. The additional functions of the EA are called using the hot keys: SHIFT+A - show/hide Auto exit options. SHIFT+S - show/hide Settings panel. SHIFT+V - sound ON/OFF. SHIFT+I -

Accelerator indicator with overbought and oversold zones. A series of OBS indicators (overbought and oversold) - these are indicators enhanced with overbought and oversold zones. This is the standard indicator, but it provides additional possibilities for the analysis of any market. Thanks to a special algorithm, this indicator has overbought zones =70 and =100, as well as oversold zones -70 and -100, which allows you to use it to determine the possible reversal or pullback of the price, as well
This product is used to check the foreign exchange market history datas. Good quality historical datas is important for traders to perform market analysis or back testing. But the quality of historical datas provided by various foreign exchange brokers is uneven. Sometimes we notice missing k-line sequences, but sometimes it is not easy to detect them. This product helps users locate these missing locations.If there are many gaps in a given period of time on a chart, you need to be careful about
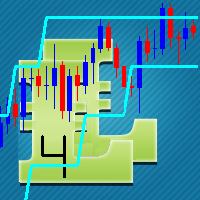
The concept of bands, or two lines that surround price, is that you will see overbought and oversold conditions. The proposed indicator has the ability to increase a smooth-effect in the bands Indicator. This indicator could play an important role in determining support and resistance. nPeriod input parameter determines number of Bars for Moving Above Bands calculation.
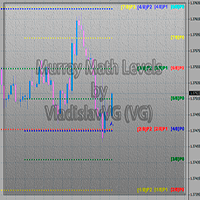
This indicator calculates and displays Murrey Math Lines on the chart. The differences from the free version: It allows you to plot up to 4 octaves, inclusive (this restriction has to do with the limit imposed on the number of indicator buffers in МТ4), using data from different time frames, which enables you to assess the correlation between trends and investment horizons of different lengths. It produces the results on historical data. A publicly available free version with modifications intr

This indicator is suitable for seeing trends and determining the time to open a position. It is equipped with a Stop Loss position. Easy to use. Just watch the arrows provided.
Indicator parameters Shift - the number of bars used for the indicator shift to Right." Step Point per Period - the number of pips for down or Up trend lines" Time Frame - Calculate @ this Time Frame." Max_Bar - the number of bars used for calcuulate indicators (if '0' then All bars to calcuulate)." Alert_On - On or Off

Features Supports the creation of Monthly, Weekly, Daily, 4 Hours, 1 Hours and 30 Minutes Market Profile. Daily Profile can have custom start time. Merge and Split of Market Profile Market Profile References Point can be exported to CSV format for any further analysis.
Indicator Parameters Indicator Update Interval - Choose indicator calculation period from 250 milliseconds to 2.5 seconds Indicator Setting ID - An ID for this particular indicator setting. Profile Number - The Number of Market
Summary of the Expert Advisor This EA will trade using standard MT4 indicators such as Moving Averages, MACD, RSI, Bollinger Bands, and so on. The EA was made so that these indicators can be mixed or matched so a number of possibilities can be traded with. Each indicator can be enabled or disabled and many settings are adjustable for each indicator. There are also other features included like multiple time frame capability and money management. As a result, many different trading strategies can
FREE

El nuevo indicador AccountInfo de IceFX es capaz de abrir para usted las posibilidades más avanzadas de MetaTrader 4 (del build 600 en adelante). Este indicador puede representar de manera gráfica los datos básicos de la cuenta actual (saldo, equidad, recursos libres, beneficios/pérdidas actuales, beneficios/pérdidas en total, cantidad y tamaño de las posiciones abiertas, etc) de una manera elegante. El indicador AccountInfo representa gráficamente el saldo de la cuenta de los últimos días en el
FREE
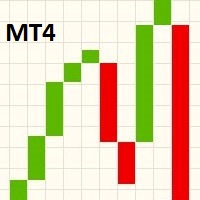
Este indicador muestra el gráfico de ruptura de línea en la ventana principal del gráfico. Para ver el gráfico de ruptura de línea separadamente, cambie la vista del gráfico principal para la muestra en forma de la línea, luego cambie el color de la línea por «None» (no hay) en las propiedades del gráfico que se abren con el botón F8. Al usar el scrolling, escalamiento o al cambiar el símbolo/período del gráfico, el indicador cambiará el tamaño de los bloques en el siguiente tick para que quepan
FREE
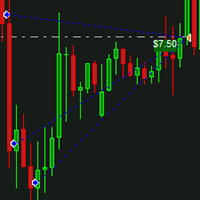
El indicador IceFX DrawProfit puede ayudar con eficacia a los traders que quieren ver en el gráfico el resultado para todas las posiciones cerradas: beneficios y pérdidas. Si coloca DrawProfit en el gráfico con un Asesor Experto activo, podrá avaluar fácilmente su trabajo en cuanto a los beneficios y las pérdidas. Particularidades principales: Dibuja las líneas de órdenes cerradas Dibuja beneficio/pérdida para las órdenes cerradas en una divisa determinada Suma las órdenes por las velas Filtro p
FREE

The script creates account summary report in a separate window. The report can be created for all deals and for deals on selected financial instruments.
It is possible to specify a time interval of calculation and save report to an htm file.
Script inputs
report starting date - initial report generation date. symbols selection for report - select a method of choosing tools for a report generation. allSymbol - report is generated for deals performed on all symbols. onlyCurrentSymbol - report
Smart Trend Line Alert is a unique professional Trend Line, Support Line and Resistance Line Touch and Break out Alert with awesome Alert History feature, designed to help traders easily manage many charts and symbols without staring at the monitor.
Features Candle Break Out Alert, Price Touch Alert and Time Line Alert; 1 click for converting any drawn line into an alert line (Trend line and Horizontal line or Trend Line By Angle); Alerts History able to re-open closed charts or re-draw delete
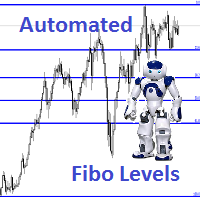
Description Fibo Levels is an indicator that automatically plots Fibonacci levels. The levels are calculated and plotted over a certain interval using the number of bars specified by the user . When the price achieve one of the target levels (23.6%, 38.2%, 50% or 61.8%) the indicator at the request of the user gives a sound signal and/or sends the message by e-mail. Example of the e-mail notification: Subject: Fibo Up Signal Message: Signal,H1 - Correction of EURUSD reached 23.6% - 2014

The Bears indicator with overbought and oversold zones. Two display options - as a line and as a histogram. A series of OBS indicators (overbought and oversold) - these are indicators enhanced with overbought and oversold zones. This is the standard indicator, but it provides additional possibilities for the analysis of any market. Thanks to a special algorithm, this indicator has overbought zones =70 and =100, as well as oversold zones -70 and -100, which allows you to use it to determine the

Cycles Predictor Indicator This indicator uses past market cycles to predict future price movements. The predictions are drawn as vertical lines on the right side of the chart where the market has not advanced to yet. A prediction will many times result in the type of candle (ex. bull or bear) and/or a reversal point (ex. bottom or top) forming at this exact time. The lines are drawn well in advance which makes this a unique indicator.
Benefits The indicator does not repaint, move, or delete

This indicator evaluates the market sentiment using raw price action measurements, and it is an amazing trading confirmation. It can be used to take a trend-trade approach or a contrarian approach using reversal patterns. [ Installation Guide | Update Guide | Troubleshooting | FAQ | All Products ] Find early reversals Confirm short-term trades Detect indecision on the market Take contrarian trades near support and resistance levels Trade inside bars confirmed by overall direction of the market T
FREE

The indicator identifies the direction and strength of the trend. Bearish trend areas are marked with red color, bullish areas are marked with blue color. A thin blue line indicates that a bearish trend is about to end, and it is necessary to prepare for a bullish one. The strongest signals are at the points when the filled areas start expanding. The indicator has only two parameters: period - period; offset - offset. The greater the period, the more accurate the trend identification, but with a

A moving average is commonly used with time series data to smooth out short-term fluctuations and determine longer-term trends. The proposed indicator has an ability to increasing a smooth-effect. This indicator could play an important role in determining support and resistance. An input parameter nPeriod determines number of Bars for Moving AboveAverage calculation.
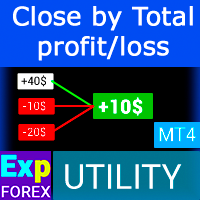
Cerrar posiciones en MetaTrader 4 al alcanzar la ganancia / pérdida total con la función de seguimiento de ganancias. Puede habilitar las paradas virtuales (orden separada) , Cálculo y cierre para posiciones de COMPRA y VENTA por separado (COMPRA VENTA separada) , Cerrar y calcular todos los símbolos o solo el símbolo actual (Todos los símbolos) , Habilitar trailing con fines de lucro ( Trailing Profit) Cierre sobre las pérdidas y ganancias totales en la moneda de depósito, punt

El EA modifica el nivel de Stop Loss de la posición abierta (en el instrumento actual). El SAR Parabólico , NRTR (Nick Rypock arrastre reversa) , se utilizan indicadores de MA o la regresión lineal del canal . Modos conmutables: Trailing stop sólo cuando se obtienen ganancias; Trailing stop solamente al precio; Trabajar en cada tick o en barras (formadas) completadas; Trailing para cada orden o la posición acumulativa.

El indicador representa dos medias móviles sencillas según los precios High y Low. La línea MA_High se representa cuando la media móvil está dirigida hacia abajo. Puede ser usada para establecer una orden stop para una posición de venta. La línea MA_Low se representa cuando la media móvil está dirigida hacia arriba. Puede ser usada para establecer una orden stop para una posición de compra. El indicador se usa en el experto TrailingStop . Parámetros Period - periodo de cálculo de la media móvil
FREE

Alex Profis is a fully automated Expert Advisor for Forex trading. The EA uses the strategy based on price levels' breakout. The main rule of the EA is to preserve and increase the account balance without large risks. Therefore, the EA is in the market for mere minutes, sometimes seconds per day. The best results are achieved on GBP/USD, EUR/USD, USD/JPY. The EA works on H1. The product requires a low-spread broker with accurate order execution. Real account monitoring: https://www.mql5.com/en/u

Fibonacci SR Indicator Este indicador dibuja las líneas de soporte y resistencia. El producto se basa en los niveles de retroceso y expansión de Fibonacci (Fibonacci Retracement and Extension levels). El indicador toma en consideración múltiples combinaciones de los niveles de Fibonacci y dibuja las líneas de soporte/resistencia. En sus cálculos el indicador utiliza los valores de las crestas y los valles construidos por el indicador ZigZag. Si hace falta, también se puede mostrar el ZigZag en e
FREE

It predicts the most likely short-term price movement based on advanced mathematical calculations.
Features Estimation of immediate price movement; Calculation of the real market trend; Calculation of the most important support and resistance levels; Algorithms optimized for making complex mathematical calculations with a minimal drain of system resources; Self-adjusting for better performance, so it’s able to work properly at any symbol (no matter how exotic it is) and any timeframe; Compatib
FREE

The indicator gives signals on trend reversal or the possible direction of price movement when leaving the flat movement.
Features and settings: Sensitivity = 3 - sensitivity from 1 to 5; the higher the value, the more signals (example displayed in the screenshot below). DeepBars = 3000 - indicator display depth.
ZeroBarCalc = false - use a zero bar in the calculations; if yes, the signal will appear earlier, but it may disappear before the current candlestick is closed.
UseAlert = false - e

Este indicador implementa una forma del análisis técnico basada sobre la idea de que el mercado tiene una naturaleza cíclica. El Abanico de Gann (Gann Fan) se compone de los grupos de las líneas diagonales (llamados ángulos de Gann) que son nueve. Estos ángulos se colocan sobre el gráfico de precios formando las líneas de soporte y resistencia. La imagen obtenida permite predecir la futura dirección del movimiento del precio. Si antes el abanico de Gann se dibujaba a mano, ahora se puede refleja

Description Indicator for MT5 is here. It displays alternative (mathematically calculated) support and resistance levels, as well as the levels the price is most likely to achieve in the near future. The calculation is based on history data, and the quality of quotes is critical when generating lines. The lines built by Magneto Pro and Magneto Weekly Pro do not change on the entire calculation period.
Application Magneto Pro can be used both in conjunction with an existing strategy and as a se
The Synchronized Charts script allows comparing bars of different symbols or different periods of the same symbol. Attach the script to a chart and move bars or change the scale, all opened chart will move synchronously with the current one. The bars on different charts aligned to the border according to their open time. Please be sure the relevant history datas have been downloaded before synchronize charts. 。。。。。。。。。。。。。。。。。。。。。。。。。。。。。。。。。。。。。。。。。。。。。。。。。。

Индикатор Magneto Weekly Pro отображает: Недельные важные линии поддержки и сопротивления (выделены желтым, красным и синим цветами). Основные недельные цели (выделены белым цветом). Недельные паттерны возврата цены (обозначаются красными флажками). Применение индикатора Magneto Pro можно использовать и как дополнение к существующей стратегии, и как самодостаточную торговую стратегию. Данный продукт состоит из двух индикаторов, работающих на разных временных промежутках, и предназначен для скаль

Panel de comercio para operar en 1 clic. ¡Trabajando con posiciones y pedidos! Operar desde el gráfico o desde el teclado.
Con nuestro panel de operaciones, puede operar con un clic del gráfico y realizar operaciones comerciales 30 veces más rápido que el control estándar de MetaTrader. Cálculos automáticos de parámetros y funciones que facilitan la vida de un comerciante y lo ayudan a realizar sus actividades comerciales de manera mucho más rápida y conveniente. Consejos gráficos e informaci

EA puede cerrar posiciones no rentables buscando y cerrando posiciones rentables .
Este asistente busca , entre todas las posiciones, la posición menos rentable del terminal. Además, al buscar las posiciones rentables restantes, calcula una serie de posiciones que pueden cubrir la pérdida cuando la ganancia de una o más posiciones es mayor que la pérdida de otra posición. Si se encuentra un conjunto de dichas posiciones, el asesor las cierra. Una serie de puestos puede consistir
FREE

¡La versión gratuita de la estrategia «cuadrícula»! Es totalmente idéntica a la versión completa a excepto de que tiene una cantidad limitada de posiciones. Su objetivo consiste en sacar de la tendencia el máximo del beneficio (en modo automático) aprovechando de las correcciones tendenciales. Además, este Asesor Experto (EA) puede ser utilizado por los traders experimentados que operan manualmente. Está estrategia la utilizan muchos traders sociales de éxito que tienen más de 500 suscriptores d
FREE
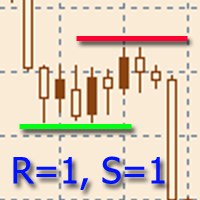
The indicator is designed to build horizontal support and resistance levels. The level search algorithm is based on the grouping of extremes. It is possible to display statistical information for each level, filter the display of levels by a number of properties, adjust the color scheme depending on the type of level (support or resistance). Features:
The indicator is ready to work and in most cases does not require special settings Manual or automatic selection of the range of extrema grouping

MTF Moving Averages indicator with overbought and oversold zones. Two display options - as a line and as a histogram. A series of OBS (overbought and oversold) indicators - these are indicators that have been enhanced with overbought and oversold zones. Another feature of this indicator is that the lines of the indicator s (when analyzing several indicator s in a single window) are not redrawn relative to each other when scrolling the chart. Settings
OBS Period - period of overbought/oversol

Bulls indicator with overbought and oversold zones. Two display options - as a line and as a histogram. OBS (overbought and oversold) indicator series - are indicators that have been provided with overbought and oversold zones. This is the standard indicator, but it provides additional possibilities for the analysis of any market. Thanks to a special algorithm, this indicator has overbought zones =70 and =100, as well as oversold zones -70 and -100, which allows you to use it to determine the p

The Force Index indicator with overbought and oversold zones. Two display options - as a line and as a histogram. A series of OBS indicators (overbought and oversold) - these are indicators enhanced with overbought and oversold zones.
Settings OBS Period - overbought/oversold calculation period Force Period - period of Force Price MA - prices for MA calculation Method MA - MA calculation method Line or Histo - display by line or histogram

TimeFilter indicator allows you to visually select bit masks (GoodHourOfDay, BadHoursOfDay, GoodDayOfWeek, BadDaysOfWeek) for the Intraday Time Filter module of trading signals of the Standard Library. The use of time filters allows you to take into account the particulars of each trading session in performing trading operations.

The indicator is an inter-week hourly filter. When executing trading operations, the indicator allows considering time features of each trading session. Permissive and restrictive filter intervals are set in string form. The used format is [first day]-[last day]:[first hour]-[last hour]. See the screenshots for examples. Parameters: Good Time for trade - intervals when trading is allowed. Bad Time for trade - intervals when trading is forbidden.
time filter shift (hours) - hourly shift. percent

Logarithmic Network - cm-hourglass Expert Advisor The Expert Advisor places orders with a decreasing lot and step in the direction of the trend and with an increasing lot and step in the counter-trend direction. It sets Take Profit for every direction to avoid breakeven of the entire series. The farthest order in the direction of the trend is closed with a farthest counter-order so as to get the positive total, thus pulling the entire network to the price without letting it expand. Parameters Lo

The indicator allows determining the strength and direction of the trend precisely. The histogram displayed in a separate window shows changes of the slope of the regression line. A signal for entering a deal is crossing the zero line and/or a divergence. The indicator is also useful for wave analysis. Input Parameters: Period - period of calculation, 10 on default; Angle threshold - slope at which a flat is displayed, 6.0 on default (within the range from -6.0 to 6.0); Filter by volume - volume

Features Simultaneous Multi-Signals, Multi-Symbols and Multi-Timeframes. Please message me for ALL settings. I am constantly seeking new signals and improving old ones to maintain and improve the edges in my updates to this EA Extraordinarily robust (wide range of settings produces positive results over long testing periods during optimizations and across different broker feeds and timeframes) Built-in anti-curve fitting features for extremely robust optimizations (Time Dilation testing, Monte C

The Accumulation indicator with overbought and oversold zones. Two display options - as a line and as a histogram. A series of OBS indicators (overbought and oversold) - these are indicators enhanced with overbought and oversold zones. Simple and straightforward settings that are easy to match to the right tool
In the indicator, you can adjust: Display depth of the indicator Color of indicator levels
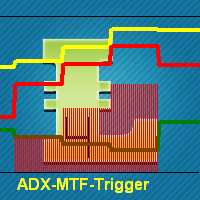
This indicator is using classical indicators: Average Directional Movement Index from the higher TF (which you can set up using input parameter TimeFrame). Yellow line represents the Main Average Directional Index from the senior TF. Green line represents the Plus Directional Indicator (+DI) from the senior TF. Red line represents the Minus Directional Indicator (-DI) from the senior TF. Green histogram represents Up trend. Red histogram represents Down trend.

El programa ChartWall sirve para visualizar y cambiar automáticamente las imágenes del fondo en el gráfico de trabajo. Se soportan los formatos gráficos JPG y BMP. Hay dos modos para seleccionar el archivo de la imagen y el estilo de visualización: sea al iniciar ChartWall a través del panel estándar de los parámetros, sea a través del panel incorporado. El panel incorporado se abre si hace clic en el icono del programa que aparece en la esquina inferior izquierda del gráfico al situar el cursor
FREE
Este indicador le mostrará de una forma rápida y cómoda sus ganancias actuales. IceFX’s ProfitInfo - es una utility encargada de mostrar el beneficio calculado según las transacciónes reales en el gráfico (gráficos). El indicador se representa en periodos de días, semanas y meses. Muestra el beneficio en pips, divisas y tanto por ciento. Características principales: Puede configurar con facilidad IceFX’s ProfitInfo, para mostrar el beneficio de una pareja de divisas del gráfico actual, de una tr
FREE

IceFX SpreadMonitor - indicador especial que registra el valor del spread. Muestra el spread actual, el mínimo/máximo y el medio. Estos valores quedan visibles incluso después del reinicio. Además, SpreadMonitor puede guardar los valores necesarios de spread en un archivo CSV para su posterior análisis.
FREE

Multicurrency indicator Any chart obs is a price chart with a percentage scale. Can be displayed as a line and as a histogram. There is also a reverse function available, it mirrors the chart. The name of an instrument to be displayed is specified in the input parameters, the current symbol is used on default. The indicator doesn't have lags as it is not smoothed with any formulas, but bound to a percentage scale, what allows detecting the price equilibrium, the overbought and oversold state. Th

Este indicador predice el movimiento más probable de los precios a corto plazo basándose en unos complejos cálculos matemáticos.
Particularidades Estimación del movimiento actual del precio; Cálculo de la tendencia actual; Cálculo de las líneas más importantes de soporte y resistencia; Algoritmos optimizados para realizar los cálculos matemáticos complejos con el mínimo desgaste de recursos de sistema; Autoadaptación para conseguir el mejor resultado y, por consecuencia, la posibilidad de trab

Este indicador evalúa la volatilidad y la direccionalidad de los precios simultáneamente, y encuentra los siguientes eventos. [ Guía de instalación | Guía de actualización | Solución de problemas | FAQ | Todos los productos ] Movimientos de precios decisivos y repentinos Grandes patrones de martillos / estrellas fugaces Fuertes brotes respaldados por la mayoría de los participantes del mercado Situaciones de mercado indecisas pero volátiles Es un indicador extremadamente fácil de usar ... El hi
TradeInfo de IceFX es la utilidad que muestra la información más importante sobre la cuenta corriente y sus posiciones. Información mostrada: Información sobre la cuenta corriente (balance, equidad, margen libre). Spread actual, reducción actual (Drawdown), beneficio planeado, pérdidas esperadas, etc. Número de posiciones abiertas, volumen (LOT), beneficio. Rango del día de hoy y de ayer. Tiempo que queda hasta la vela siguiente. Información sobre el beneficio del último día (usando el indicador
FREE

This highly informative indicator applies overbought/oversold levels for more accurate representation of the market situation. It is also possible to change the appearance of the indicator - line or histogram. Additional parameters enable more fine-tuning, while trading can be inside the channel and along a trend.
Distinctive features Oversold/overbought levels; Does not redraw. Displayed as a line or a histogram; Works on all timeframes and symbols. Suitable for manual trading and developmen

MACD indicator with overbought and oversold zones. Two display options - classic lines and a histogram. Can be used to detect a possible reversal or pullback in price, as well as for channel strategies All settings are simple and straightforward - all like a standard indicator, but with additional support and resistance levels Can be used both separately and together with other indicators

This indicator is a combination of 2 classical indicators: MA and Force Index. The input parameter counted_bars determines on how many bars the indicator lines will be visible. The input parameter MaForcePeriod is used for MA and Force calculation. You may go Long if the current price crossed Up the Ribbon (HISTOGRAM) and you may go Short if the current price crossed Down the Ribbon (HISTOGRAM)

This indicator is a combination of 2 classical indicators: MA and CCI. Two moving averages form Upper and Lower bands. The input parameter counted_bars determines on how many bars the indicator's lines will be visible. The input parameter barsNum is used for MA and CCI calculation.

This indicator is using 2 classical indicators: Commodity Channel Index from the higher TF (which you may change using input parameter TimeFrame ) and Average True Range from the current TF. The Green ribbon indicates the upper trend and the Red ribbon indicates the down trend. Buy when the Yellow line crosses the Upper bound (Aqua line). Sell when the Yellow line crossover the Lower bound (Aqua line).
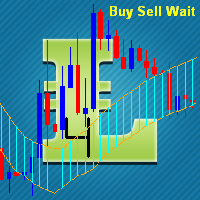
The input parameter counted_bars determines on how many bars the indicator lines will be visible. The input parameter barsNum is the period for bands calculation. When PriceClose for previous bar is above upper band a Long position may be opened. When PriceClose for previous bar is under lower band a Short position may be opened. If the current Price is between bands it is time to wait.

Fibonacci sequence is defined by integer sequence: 0, 1, 1, 2, 3, 5, 8, 13, 21, 34, 55, 89, 144, ... By definition, it starts from 0 and 1, the next number is calculated as a sum of two previous numbers. Instead of the standard moving average, the indicator uses the following calculation of average price: Bar0 + Bar1 + Bar2 + Bar3 + Bar5 + Bar8 + Bar13 + Bar21 + ...
Input parameters FiboNumPeriod_1 - numbers in the following integer sequence for Fibo Moving Average 1. nAppliedPrice_1 - Close p

Our 5 Star Best Seller Beginner or Professional our best selling multi-timeframe Pivot Prof will enhance your trading and bring you great trade opportunities with the Support and Resistance levels that professionals use. Pivot trading is a simple effective method for entering and exiting the market at key levels and has been used by professionals for decades and works on all symbols: Forex, Crypto, Stocks, Indicies etc. Pivot Prof brings premium levels to the trader where the market is most like

Este asesor experto implementa el sistema de comercio original de Dennis y Eckhardt, comúnmente conocido como The Turtle Trader. Se comercializa exactamente como lo hicieron las tortugas originales, y puede ser utilizado por comerciantes experimentados para capturar tendencias en los mercados hacia arriba o hacia abajo. [ Guía de instalación | Guía de actualización | Solución de problemas | FAQ | Todos los productos ] Fácil de usar y supervisar. Configuraciones de estrategia totalmente configur

Descripción: Abigail es un sistema comercial a medio plazo que saca beneficios de los movimientos retrocesivos de los precios. Este Asesor Experto (EA) está optimizado para trabajar con EURUSD pero puede trabajar sin problemas con otros pares de divisas. Puede estudiar las estadísticas de trabajo del EA con diferentes brokers, diferentes instrumentos financieros en la sección Señales de Trading para MetaTrader 4 y MetaTrader 5 . Parámetros: Control de riesgos: enter volume - volumen de la entrad

Zigzag muy rápido, sin redibujado, con conmutación de segmentos según la ruptura de precio del nivel rezagado del extremo actual en la cantidad establecida de puntos (parámetro H). El parámetro MinBars establece la profundidad de la historia para el dibujado del indicador, el valor 0 comprende el dibujado según toda la historia. El parámetro SaveData permite anotar en un archivo las coordenadas de los extremos (la hora en el formato datatime y el precio). A modo de comentario, se muestran alguna
FREE
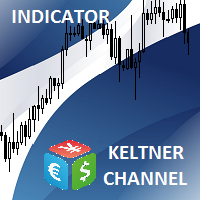
Description Keltner's colored multicurrency/multisymbol channel indicator, also called STARC band, drawn in a separate window below the chart of the main financial symbol. The indicator uses the calculation technique of the three drawing options: basic, improved and modified . The first two were proposed by Keltner, the third one - by a successful trader L. Rakshe. You can also search for your own best parameters of the indicator. The upper, middle and lower bands can be colored. The indicator

This is an implementation of an idea described in Larry Williams' "Long-Term Secrets to Short-Term Trading". The first figure displaying the basic principle has been taken from that book.
Operation Principles The indicator applies optimized calculation algorithms with the maximum possible speed for non-redrawable indicator. In other words, the zigzag's last shoulder is formed right after the appropriate conditions occur on the market. The shoulder does not change its direction afterwards (can
MetaTrader Market ofrece a todos los desarrollador de programas de trading una sencilla y cómoda plataforma para ponerlos a la venta.
Le ayudaremos con la presentación y explicaremos cómo preparar la descripción de su producto para el Market. Todos los programas que se venden a través del Market están protegidos por una codificación adicional y pueden ser iniciados sólo en el ordenador del comprador. La copia ilegal es imposible.
Está perdiendo oportunidades comerciales:
- Aplicaciones de trading gratuitas
- 8 000+ señales para copiar
- Noticias económicas para analizar los mercados financieros
Registro
Entrada
Si no tiene cuenta de usuario, regístrese
Para iniciar sesión y usar el sitio web MQL5.com es necesario permitir el uso de Сookies.
Por favor, active este ajuste en su navegador, de lo contrario, no podrá iniciar sesión.