适用于MetaTrader 4的新EA交易和指标 - 288

CMI - Profit from trending and ranging markets. The CMI indicator is a two-part system used to trigger both trend and counter-trend trades, that has been introduced by Daniel Fernandez in an article published in Currency Trading Magazine (August 2011 issue). It is a simple, yet effective indicator, which gauges whether the market has behaved in a choppy (non-directional) manner or trending (directional) manner. CMI calculates the difference between the most recent bar's close and the close n bar
The Expert Advisor trades in the direction of the current trend, the algorithm is based on calculating the width of the trading range for a given interval and assessing price movements on short time intervals. If the impulse value exceeds a specified percentage of the trading range, a position is opened in the direction of the trend. The impulses are also additionally filtered using a special technique. When evaluating impulses, the tick history inside the bar is not used . The algorithm uses

The indicator draws trend lines based on Thomas Demark algorithm. It draws lines from different timeframes on one chart. The timeframes can be higher than or equal to the timeframe of the chart, on which the indicator is used. The indicator considers breakthrough qualifiers (if the conditions are met, an additional symbol appears in the place of the breakthrough) and draws approximate targets (target line above/below the current prices) according to Demark algorithm. Recommended timeframes for t
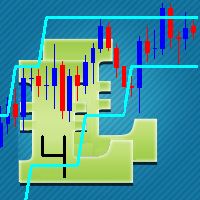
This indicator is based on the classical Envelopes indicator. The proposed indicator has the ability to increase a smooth-effect in the Envelopes Indicator. This indicator could play an important role in determining support and resistance. nPeriod input parameter determines the number of Bars for Moving Above Envelopes calculation.

This indicator shows you the angle of the moving average according to your settings in a separate window. It also shows the angle written on the chart, which can also be adjusted. The main features and input variables provided include: MAPeriod: This is the period for your moving average. The default MAPeriod is 5. LookBack: This is a very important variable. It allows you to set the look back bar, from which the angle will be measured. For example, if your LookBack is 5, then indicator will cal

智能趋势线提示, 专业趋势线, 支撑线和阻力线提示
特点: 自动与点击模式,可将任意新绘制的线转换为提示线 (趋势线或水平线); 在较高时间帧内隐藏来自低时间帧的线,避免在图表上显示过多不同时间帧的线,从而造成混乱; 自动切换时间帧,当在较低时间帧里点击较高时间帧的线时; 自动展平水平线,如果用户使用趋势线来绘制支撑或阻力线; 自动支撑至阻力反转,反之亦然; 自动线颜色, 描述, 线形和宽度设置; 当价格触及某条线,则该线闪烁 (直到用户在图表上点击关闭); 当触及某线,该图表自动置上; 连声提示,夜间和日间模式声音类型 (直到用户在图表上点击关闭); 单声提示并弹出消息框; 移动通知; 邮件通知; 图表上的控制台; 自动隐藏控制板; 图表剪裁.
如何使用: 加载指标至图表; 控制台将出现在图表上; 使用 MetaTrader 趋势线或水平线工具,在您希望的价位绘制一条线; 如果自动模式启用, 新的线将被自动转换为提示线, 如果点击模式启用, 新线在点击后转换为提示线。
当价格触及支撑或阻力线,将会发生什么: 指标将图表带到其它图表的上面; 指标将切换到该线所属的时间帧;
FREE

显著指标计算的价格水平,如果红的水平,那么价格将其分解,如果蓝到了。如果价格接近蓝色级别低于他的罢工toskoree总价,如果顶部更容易从水平反弹。同样,如果价格移动到红色顶层,它很可能是故障的水平,如果低于,则有可能反弹。 因为酒吧的水平已失去意义从计划中删除后得出水平等于CalculationBars 。 非常适合用于交易市场上挂单:停止改正的趋势和限制, SL和TP水平下一个最低/最高价格设定。与此交易建议的比例SL / TP为不小于1/2。 设置及说明: CalculationBars - 酒吧来计算的水平; LineLength -个长度的线棒; Filtr- 滤噪平滑的价格,价值较低的级别越高( 1 〜100 ) ; UpColor -色水平,该价格打破了; DnColor - 色水平,该价格打破了; LineWidth- 线宽,线的粗细;

The EA performs trade operations of closing position groups. Positions are grouped by type. It is possible to select orders by the profit (loss) value. It is possible to form the closure groups manually. You can set a value for automatic closure of a positions group after reaching a certain profit/loss level or price level. The additional functions of the EA are called using the hot keys: SHIFT+A - show/hide Auto exit options. SHIFT+S - show/hide Settings panel. SHIFT+V - sound ON/OFF. SHIFT+I -

Accelerator indicator with overbought and oversold zones. A series of OBS indicators (overbought and oversold) - these are indicators enhanced with overbought and oversold zones. This is the standard indicator, but it provides additional possibilities for the analysis of any market. Thanks to a special algorithm, this indicator has overbought zones =70 and =100, as well as oversold zones -70 and -100, which allows you to use it to determine the possible reversal or pullback of the price, as well

。。。。。。。。。。。。。。。。。。。。。。。。。。。。。。。。。。。。。。。。。。。。。。。。。。。。。 本产品用于检测外汇行情历史数据。
质量好的历史数据对于交易者作行情分析或回测非常重要。但是各家外汇券商提供的历史数据的质量参差不齐,有时我们会留意到K线序列有缺失,但有时不易察觉。本产品帮助用户定位这些缺失位置。如果某图表上某个时段出现许多缺口,你就要小心历史数据是否可靠,也许要考虑换一个更好的行情服务器。
这个产品用编号标记K线上出现的缺口,并计算出缺口大小,以及其他相关参数。 。。。。。。。。。。。。。。。。。。。。。。。。。。。。。。。。。。。。。。。。。。。。。。。。。。。。。。。。。。。。。。。。
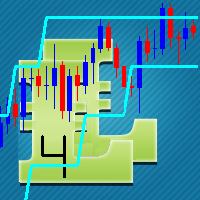
The concept of bands, or two lines that surround price, is that you will see overbought and oversold conditions. The proposed indicator has the ability to increase a smooth-effect in the bands Indicator. This indicator could play an important role in determining support and resistance. nPeriod input parameter determines number of Bars for Moving Above Bands calculation.
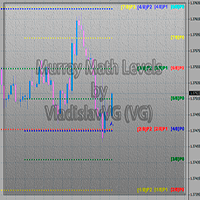
This indicator calculates and displays Murrey Math Lines on the chart. The differences from the free version: It allows you to plot up to 4 octaves, inclusive (this restriction has to do with the limit imposed on the number of indicator buffers in МТ4), using data from different time frames, which enables you to assess the correlation between trends and investment horizons of different lengths. It produces the results on historical data. A publicly available free version with modifications intr

This indicator is suitable for seeing trends and determining the time to open a position. It is equipped with a Stop Loss position. Easy to use. Just watch the arrows provided.
Indicator parameters Shift - the number of bars used for the indicator shift to Right." Step Point per Period - the number of pips for down or Up trend lines" Time Frame - Calculate @ this Time Frame." Max_Bar - the number of bars used for calcuulate indicators (if '0' then All bars to calcuulate)." Alert_On - On or Off

Features Supports the creation of Monthly, Weekly, Daily, 4 Hours, 1 Hours and 30 Minutes Market Profile. Daily Profile can have custom start time. Merge and Split of Market Profile Market Profile References Point can be exported to CSV format for any further analysis.
Indicator Parameters Indicator Update Interval - Choose indicator calculation period from 250 milliseconds to 2.5 seconds Indicator Setting ID - An ID for this particular indicator setting. Profile Number - The Number of Market
Summary of the Expert Advisor This EA will trade using standard MT4 indicators such as Moving Averages, MACD, RSI, Bollinger Bands, and so on. The EA was made so that these indicators can be mixed or matched so a number of possibilities can be traded with. Each indicator can be enabled or disabled and many settings are adjustable for each indicator. There are also other features included like multiple time frame capability and money management. As a result, many different trading strategies can
FREE

IceFX 的最新账户信息指标解锁所有 MetaTrader 4 的高级功能 (编译版本 600 以上)。 本指标以优雅的方式,用图形化表示当前账户的主要数据 (余额, 净值, 可用保证金, 当前盈利/亏损, 总盈利/亏损, 持仓数量和手数, 等等)。在图表上 AccountInfo 图形化显示近期账户余额。 所有数据也可以用 MagicNumber , 订单注释, 和品名过滤,以便对指定 EA/手工策略的性能进行专业评估。
FREE
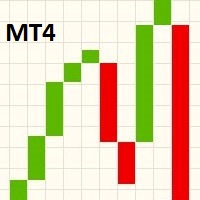
这款指标在主图表窗口里显示一个线突破图表。 为了在主图表窗口里查看线突破图表自己,在主图表窗口里显示一个线突破图表,之后按 F8 在属性对话框里改变 "线图表" 颜色为 "无"。当滚动, 缩放或改变图表的时间帧, 指标将在下一个报价来临时调整积木大小以适合主图表视野。 线突破图表发明于日本,类似于点数图表和 Renko 图表。一位日本交易员描述三线突破图表为 "点数图的更微妙的形式,由市场决定反转而非随意的规则"。线突破图表忽略时间,并仅在收盘价格移动了一定数量后改变。这些图表显示一序列大小变化的垂直线 (或 "积木") (Renko 使用固定积木大小)。绿色积木 (传统的白色) 代表价格上升, 红色积木 (传统黑色) 代表价格下跌。积木在同一方向上连续,直到必要的反转。 当收盘价超过了前期 "X" 根线的最高或最低时,会发生逆转。传统上,"X" 为 3;这个指标允许让您设置不同数量,令您在分析价格走势时更灵活。在网络上有大量资源描述如何构造并使用线突破图表。 还 (选项) 显示了一个 "序列频率" 直方图。直方图显示一系列高低点的分布频率,这些点是过去生成的 "X" 方向的变化。直方
FREE
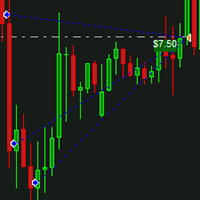
IceFX DrawProfit 指标可以有效地帮助那些交易员,在图表上看到所有已平仓位信息:利润或亏损。如果您在图表上设置的 DrawProfit 是通过 EA,您将清楚地看到它的盈利和亏损情况。 主要特征: 绘制平仓线 绘制已平仓货币的盈利/亏损 按照蜡烛图进行订单汇总 以魔幻数字过滤 EA 注释过滤器
FREE

The script creates account summary report in a separate window. The report can be created for all deals and for deals on selected financial instruments.
It is possible to specify a time interval of calculation and save report to an htm file.
Script inputs
report starting date - initial report generation date. symbols selection for report - select a method of choosing tools for a report generation. allSymbol - report is generated for deals performed on all symbols. onlyCurrentSymbol - report

Smart Trend Line Alert is a unique professional Trend Line, Support Line and Resistance Line Touch and Break out Alert with awesome Alert History feature, designed to help traders easily manage many charts and symbols without staring at the monitor.
Features Candle Break Out Alert, Price Touch Alert and Time Line Alert; 1 click for converting any drawn line into an alert line (Trend line and Horizontal line or Trend Line By Angle); Alerts History able to re-open closed charts or re-draw delete
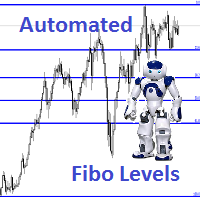
Description Fibo Levels is an indicator that automatically plots Fibonacci levels. The levels are calculated and plotted over a certain interval using the number of bars specified by the user . When the price achieve one of the target levels (23.6%, 38.2%, 50% or 61.8%) the indicator at the request of the user gives a sound signal and/or sends the message by e-mail. Example of the e-mail notification: Subject: Fibo Up Signal Message: Signal,H1 - Correction of EURUSD reached 23.6% - 2014

The Bears indicator with overbought and oversold zones. Two display options - as a line and as a histogram. A series of OBS indicators (overbought and oversold) - these are indicators enhanced with overbought and oversold zones. This is the standard indicator, but it provides additional possibilities for the analysis of any market. Thanks to a special algorithm, this indicator has overbought zones =70 and =100, as well as oversold zones -70 and -100, which allows you to use it to determine the

Cycles Predictor Indicator This indicator uses past market cycles to predict future price movements. The predictions are drawn as vertical lines on the right side of the chart where the market has not advanced to yet. A prediction will many times result in the type of candle (ex. bull or bear) and/or a reversal point (ex. bottom or top) forming at this exact time. The lines are drawn well in advance which makes this a unique indicator.
Benefits The indicator does not repaint, move, or delete

This indicator evaluates the market sentiment using raw price action measurements, and it is an amazing trading confirmation. It can be used to take a trend-trade approach or a contrarian approach using reversal patterns. [ Installation Guide | Update Guide | Troubleshooting | FAQ | All Products ] Find early reversals Confirm short-term trades Detect indecision on the market Take contrarian trades near support and resistance levels Trade inside bars confirmed by overall direction of the market T
FREE

The indicator identifies the direction and strength of the trend. Bearish trend areas are marked with red color, bullish areas are marked with blue color. A thin blue line indicates that a bearish trend is about to end, and it is necessary to prepare for a bullish one. The strongest signals are at the points when the filled areas start expanding. The indicator has only two parameters: period - period; offset - offset. The greater the period, the more accurate the trend identification, but with a

A moving average is commonly used with time series data to smooth out short-term fluctuations and determine longer-term trends. The proposed indicator has an ability to increasing a smooth-effect. This indicator could play an important role in determining support and resistance. An input parameter nPeriod determines number of Bars for Moving AboveAverage calculation.
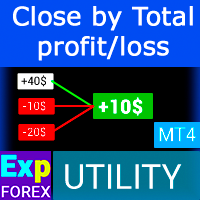
在 MetaTrader 4 中使用利润跟踪功能在达到总利润/亏损时平仓。 您可以启用 虚拟停止(单独订单) , 分别计算和平仓 买入和卖出头寸 (Separate BUY SELL) , 关闭和计算 所有交易品种或仅当前交易品种(所有交易品种) , 启用追踪获利( 追踪 利润) 关闭存款货币、点数、余额百分比的总损益。 该应用程序旨在与任何其他 EA 一起用于任何账户或与手动交易结合使用。 MT5 版本
详细描述 +DEMO +PDF 如何购买
如何安装
如何获取日志文件 如何测试和优化 Expforex 的所有产品 一旦某些货币对或所有货币对的交易总余额大于或等于设置中指定的值,所有头寸将被关闭并删除订单。 此版本不仅能够在指定的利润水平平仓,而且还可以追踪利润以获得更好的结果。 我们实用程序的主要功能
按所有交易品种的总利润平仓; 按单独交易的总利润结算。 (虚拟模式); 按总利润结算并追踪利润; 按总利润以点数、百分比或货币结算; 所有交易或单独交易均以总亏损结束; 关闭交易后关闭图表和终端、风险管理器、包含关闭信息的邮件

本 EA 修改当前交易品种已开单的止损位。 使用以下指标 抛物线停止和反转 , NRTR (Nick Rypock 尾随反转) , 移动均线 。 切换模式: 只在盈利时尾随停止; 只根据价格尾随停止; 在每次报价或柱线完成时 (已形成); 每笔订单或累积持仓尾随。

本指标绘制两条 简单移动均线 ,使用最高价和最低价。 MA_High 线当均线指向下行时显示。它可以用于设置空头订单的止损位。 MA_Low 线当均线指向上行时显示。它可以用于设置多头订单的止损位。 本指标用于 TrailingStop EA。 参数 Period - 移动均线的计算周期。 Deviation - 线间聚合/离散率。 缓存区索引: 0 - MA_High, 1 - MA_Low。
FREE

Alex 盈利 EA 仅通过挂单交易 EURUSD。挂单放置在重要级别的突破位置。 本 EA 工作于 H1。建议账户类型 - ECN, 建议杠杆 - 1:500。 本 EA 不需要很大本金,并可以从 $50 开始。 每笔交易以停止位保护 (止损和止盈)。仓量依据可用基金数量。 当赢得了最小利润,订单转移到盈亏平衡位,让我们将交易的亏损降到最低。 实盘账户监控: https://www.mql5.com/zh/users/sania2010s/seller Alex 盈利是全自动 EA,并不需要任何交易者的行动。 本 EA 不使用马丁格尔。它需要一个低点差的经纪商和一个 VPS。
参数 TP - 挂单的止盈; SL - 挂单的止损; BBUSize - 盈利点数, 此时止损会移动到盈亏平衡位; BBUSizepip - 盈亏平衡点数大小; Magic - 魔幻数字; UseTrailing - 尾随开关; TrailingStart - 盈利点数, 之后尾随开始; TrailingStep - 步长大小, 每多盈利一步,止损将移动到下一阶段; TrailingStop - 步长大小,

菲波纳奇支撑阻力指标 本指标创建支撑和阻力线。此指标基于菲波纳奇回撤和扩展级别。它会考虑菲波纳奇级别的多种组合,并在这些基础上绘制支撑/阻力线。此指标使用的顶部和底部由之字折线指标计算而来。如有必要,之字折线也可以在图表上绘制。 本指标考虑许多过去的反转点和菲波纳奇比率级别的组合,而当它看到多条线在相同的价格汇合,那么这将成为指标绘制的支撑/阻力线。未来的市场反转往往会正好出现在这些线附近。这是一个自动指标。所以,旧线将被删除,新线将随着市场的进步而绘制。
设置 Bars_Back - 向后一定数量的柱线用于所有计算。数量较少则较少反转点将被使用,因此,绘制的支撑和阻力线较少。向后更多柱线则有更多反转点将被使用,因此,绘制的支撑和阻力线较多。 Buffer_Space - 这表示每个已计算的菲波纳奇级别所需的汇合之间的最大点数。该数值越高,则确切的汇合必须越少。数字越低,则精确汇合必须更多,因此有较高的可靠性。例如, 让我们设为 10 点, 且指标运行在非分形的 4-位报价经纪商 (同样是 10 点)。此指标看到 3 个 菲波纳奇 回撤级别,分别在 1.4995, 1.5000,
FREE

它预测最有可能的短线价格走势,基于先进的数学计算。
功能 评估即时价格走势; 计算实时市场趋势; 计算最重要的支撑和阻力位; 算法优化,在进行复杂数学计算时系统资源消耗最小。 最佳性能自调整, 所以它可以工作于任何品种 (无论它有多奇葩) 以及任意时间帧; 与所有 MetaTrader 平台兼容, 不管报价位数或其它参数; 与所有其它工具兼容 (指标, EA 或脚本),不会减缓终端性能和交易操作。 注: 为了获取多个时间帧的数值, 密集区域和附加的功能,您必须适用 专业版 或 大师版 。
介绍 构建一般交易策略的许多经典指标都基于简单的数学,不是因为创建这些指标时,没有优秀的数学家 (事实上,那时的数学家有可能比现在更好),但因为电脑还不存在,或是它们太简单,持续处理复杂数学操作的能力低下。如今,任何智能手机都完胜几十年前最强大的计算机。所以,处理海量信息的能力如今不再是限制,除了极其复杂的模拟处理。 高级价格走势预测者 (APMP) 指标利用当前处理能力的优势,通过一些最先进的数学、统计和概率的概念,来捕获价格波动的本质。 APMP 不能用来预测它自己,由于价格运动是一种非平
FREE

指标提供良好的信号,趋势反转 或离开该单位时,价格变动的可能方向。
功能和设置: Sensitivity = 3 - (下图中为例)的多个信号的灵敏度为1〜 5 ,较高的值; DeepBars = 3000 - 深度计显示; ZeroBarCalc = FALSE; - 用于在零杆的计算,如果是这样的信号将被使用,但目前的蜡烛结束前可能会消失; UseAlert = FALSE; - 包容警告; AlertSound = TRUE; - 声音; AlertMessage = TRUE; - 显示; AlertMail = FALSE; - 发送消息到邮局; FileSound = “ alert2.wav ” ; - 文件磬;

此技术分析的形成,基于市场是呈几何性和周期性的思想。 江恩扇形由一系列称为江恩角度的对角线组成,其中有九条。 这些角度叠加在价格图表上,显示出一组安全的支撑和阻力级别。 结果图像应该能够有助于技术分析师预测价格变动。 虽然曾经以手工绘制,今天江恩扇形可以由软件程序绘制。 此指标绘制的江恩扇形是基于之字折线级别的。江恩有 2 类: 水青色江恩是动态的支撑位; 红色江恩是动态的阻力位。 本指标有助于马丁格尔风格的交易者,寻找良好的支撑/阻力级别。
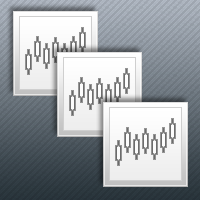
本产品可以方便用户比较不同图表的K线,还可以方便地查看同一商品在不同时间周期中的K线形态。
将脚本附加到一个图表上,移动K线,或者改变显示比例,所有打开的图表上的K线将与当前的图表上的K线按照时间对齐,并且同步移动。
如果不同图表上的K线的周期不同,将会根据K线的起始时间进行对齐。
使用前请确保相关的历史数据已经下载到本地。
欢迎提出宝贵建议或意见,请与我联系。
。。。。。。。。。。。。。。。。。。。。。。。。。。。。。。。。。。。。。。。。。。。。。。。。。。。。。。。。。。。。。。。。。。。。。。 。。。。。。。。。。。。。。。。。。。。。。。。。。。。。。。。。。。。。。。。。。。。。。。。。。。。。。。。。。。

Индикатор Magneto Weekly Pro отображает: Недельные важные линии поддержки и сопротивления (выделены желтым, красным и синим цветами). Основные недельные цели (выделены белым цветом). Недельные паттерны возврата цены (обозначаются красными флажками). Применение индикатора Magneto Pro можно использовать и как дополнение к существующей стратегии, и как самодостаточную торговую стратегию. Данный продукт состоит из двух индикаторов, работающих на разных временных промежутках, и предназначен для скаль

一键交易的交易面板。处理头寸和订单!通过图表或键盘进行交易
交易小组进行人工交易。您可以从图表(图表窗口)或键盘进行交易。打开和关闭,反向和锁定。处理职位和订单! МetaТrader4中主要订单的交易控制面板:买入,卖出,买入,买入,卖出,卖出限制,收盘,删除,修改,追踪止损,止损,止损。 MT5版本
详细描述 +DEMO +PDF 如何购买
如何安装
如何获取日志文件 如何测试和优化 Expforex 的所有产品 从符号窗口交易并从键盘交易! 您正在为MetaTrader 4终端提供一个独特的插件 - 虚拟控制面板VirtualTradePad。 Description on English 注意!如果您想学习如何交易 策略测试器 ,请查看我们的免费 TesterPad 实用程序 VirtualTradePad在“ MQL5语言最佳图形面板 ”竞赛中 获得二等奖 。 工作标签 职位标签 -使用职位:
开/关买入和卖出, 冲销所有头寸, 锁定一个共同的立场, 更改止损/获利, 设定一般的止损/获利的位置, 启用追踪止损, 实现盈亏

EA可以通过搜索并平掉盈利仓位来平掉无利可图的仓位 。
该助手 在所有位置中 寻找 终端中 最 无利可图的位置 。 进一步地,通过搜索剩余的盈利头寸,他计算出当一个或多个头寸的 利润 大于另一个头寸的损失时可以弥补损失的一系列头寸。 如果找到一组此类头寸,顾问就会将其平仓。 一系列位置可以由任何位置组成。 它们的最大数量可以在顾问设置中调整。 您还可以指定搜索的最小损失和平仓的额外利润。 MT5版本
详细描述 如何购买
如何安装
如何获取日志文件 如何测试和优化 Expforex 的所有产品 您可以在策略测试器中测试 Expert Advisor,并在可视化模式下使用我们的 EAPADPRO 工具栏进行交易! 近减加加在图表上的工作原理 认为 您以 1.600 的价格开设买入 #1 仓位; 价格跌至 1.550 ,目前亏损 -50点; 盈亏平衡点(平均价格)= 1.600 ; 如果我们打开 SELL #2、Sell #3 和 Sell #4; EA 交易开始执行主算法。 那么总利润将为+5$; 智能交易系统 (EA) 激活算法,并且
FREE

免费版网格策略!与相同策略的完整版相比,唯一的限制就是仓位数量。 它的目标是在趋势行情中收获最大利润 (自动模式),并在趋势中调整。有经验的交易者也可以在手工交易时使用它。许多拥有 500 多名付费订阅者的成功交易者正在使用这类系统。 结合您的交易经验与自动策略!它包含适用于 GBPJPY 的网格,也可以轻松扩展到其它货币。 您也可以从头开始构建自己的网格! 策略也支持止损选项。您可以使用基于净值的止损,设置净值百分比来保护每笔交易。 针对 GBPJPY 进行测试 06.2012 - 11.2013 任意时间帧 (每次即时报价)。 其它对: CHFJPY, EURJPY, CADJPY, USDJPY。 也可在任意货币对的趋势行情中测试 (例如, GBPUSD 06.2013-11.2013) 或振荡行情。针对 GBPUSD 最好使用紧凑的网格,并且,若非振荡模式,应跟随日线趋势。在振荡模式中,围绕 8-16 均线附近振荡。
该 EA 十分容易配置。给我发送私信,获得更多详情,或观看 MetaTrader 4 版本的视频教学。 所有选项均有很长的描述,并给出某些选项能够完成什么的例子
FREE
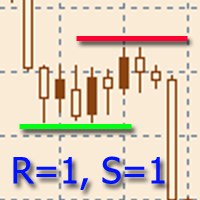
該指標旨在建立水平支撐和阻力水平。
水平搜索算法基於對極值的分組。
可以顯示每個級別的統計信息,通過多個屬性過濾級別的顯示,根據級別的類型(支撐或阻力)調整配色方案。 特點: 指示器已準備好工作,在大多數情況下不需要特殊設置 手動或自動選擇極值範圍以構建關卡 選擇要顯示的最近級別數以防止圖形混亂 靈活的圖形設置(顏色、線條和箭頭樣式) 要微調指標,您可以啟用輔助圖形元素的顯示,例如極值、極值分組區域等。 通過多個參數過濾級別的顯示 能夠在價格超過水平時啟用警報,具有可調節的滯後性 一鍵顯示關卡詳情(會顯示關卡事件) 能夠靈活自定義關卡屬性的顯示 可在一張圖表上運行多個指標(需要額外配置) 热键可用于轻松控制指示器。 可以为可用的那些功能分配大量的键选择。 在購買產品之前,您可以在這裡提出任何問題: https://www.mql5.com/en/messages/01D3CB151D42D801


Bulls indicator with overbought and oversold zones. Two display options - as a line and as a histogram. OBS (overbought and oversold) indicator series - are indicators that have been provided with overbought and oversold zones. This is the standard indicator, but it provides additional possibilities for the analysis of any market. Thanks to a special algorithm, this indicator has overbought zones =70 and =100, as well as oversold zones -70 and -100, which allows you to use it to determine the p

The Force Index indicator with overbought and oversold zones. Two display options - as a line and as a histogram. A series of OBS indicators (overbought and oversold) - these are indicators enhanced with overbought and oversold zones.
Settings OBS Period - overbought/oversold calculation period Force Period - period of Force Price MA - prices for MA calculation Method MA - MA calculation method Line or Histo - display by line or histogram

TimeFilter indicator allows you to visually select bit masks (GoodHourOfDay, BadHoursOfDay, GoodDayOfWeek, BadDaysOfWeek) for the Intraday Time Filter module of trading signals of the Standard Library. The use of time filters allows you to take into account the particulars of each trading session in performing trading operations.

The indicator is an inter-week hourly filter. When executing trading operations, the indicator allows considering time features of each trading session. Permissive and restrictive filter intervals are set in string form. The used format is [first day]-[last day]:[first hour]-[last hour]. See the screenshots for examples. Parameters: Good Time for trade - intervals when trading is allowed. Bad Time for trade - intervals when trading is forbidden.
time filter shift (hours) - hourly shift. percent

Logarithmic Network - cm-hourglass Expert Advisor The Expert Advisor places orders with a decreasing lot and step in the direction of the trend and with an increasing lot and step in the counter-trend direction. It sets Take Profit for every direction to avoid breakeven of the entire series. The farthest order in the direction of the trend is closed with a farthest counter-order so as to get the positive total, thus pulling the entire network to the price without letting it expand. Parameters Lo

The indicator allows determining the strength and direction of the trend precisely. The histogram displayed in a separate window shows changes of the slope of the regression line. A signal for entering a deal is crossing the zero line and/or a divergence. The indicator is also useful for wave analysis. Input Parameters: Period - period of calculation, 10 on default; Angle threshold - slope at which a flat is displayed, 6.0 on default (within the range from -6.0 to 6.0); Filter by volume - volume

Features Simultaneous Multi-Signals, Multi-Symbols and Multi-Timeframes. Please message me for ALL settings. I am constantly seeking new signals and improving old ones to maintain and improve the edges in my updates to this EA Extraordinarily robust (wide range of settings produces positive results over long testing periods during optimizations and across different broker feeds and timeframes) Built-in anti-curve fitting features for extremely robust optimizations (Time Dilation testing, Monte C

The Accumulation indicator with overbought and oversold zones. Two display options - as a line and as a histogram. A series of OBS indicators (overbought and oversold) - these are indicators enhanced with overbought and oversold zones. Simple and straightforward settings that are easy to match to the right tool
In the indicator, you can adjust: Display depth of the indicator Color of indicator levels
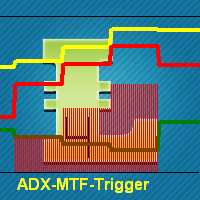
This indicator is using classical indicators: Average Directional Movement Index from the higher TF (which you can set up using input parameter TimeFrame). Yellow line represents the Main Average Directional Index from the senior TF. Green line represents the Plus Directional Indicator (+DI) from the senior TF. Red line represents the Minus Directional Indicator (-DI) from the senior TF. Green histogram represents Up trend. Red histogram represents Down trend.

ChartWall 适用于显示并自动更换图表的壁纸。它支持 JPG 和 BMP 格式。 此处有两种方式选择图像和显示风格: 当启动 ChartWall 时使用标准参数,或使用内置面板。内置面板可以通过点击应用图标来打开,它出现在图表左下角,您可以移动光标到该区域。使用内置面板,您还可以设置图像旋转周期,单位分钟。 图像文件必须位于本地终端的文件夹 "...\MQL4\Files" 或所有终端的公用文件夹。当使用标准参数对话框时,指定相对于本地终端文件夹的文件名 "...\MQL4\Files\"。
FREE

本指标的目标是令您快速、全面的查看当前盈利。IceFX 的 ProfitInfo 是一款工具指标,计算并显示图表上品种的实际交易盈利。指标显示按照日 / 周 / 月和年分离,单位点数,货币和百分比。 主要特征: 您可以很容易的调整 IceFX ProfitInfo 来显示当前打开图表指定交易货币对的盈利,甚或整个账户盈利。 可定制在图表上的全部位置。 定制字号。 显示日和月的平均盈利。 MagicNumber 过滤器。 评论过滤器。
FREE

IceFX 点差监视器 是特别的点差日志指标,显示当前, 最小/最大和平均点差数值。 这些数值可视,即使在重启动之后也如此。同样, 点差监视器可以保存所有期望的点差值至 .csv 文件用于后期分析。
FREE

Multicurrency indicator Any chart obs is a price chart with a percentage scale. Can be displayed as a line and as a histogram. There is also a reverse function available, it mirrors the chart. The name of an instrument to be displayed is specified in the input parameters, the current symbol is used on default. The indicator doesn't have lags as it is not smoothed with any formulas, but bound to a percentage scale, what allows detecting the price equilibrium, the overbought and oversold state. Th

它预测最有可能的短线价格走势,基于先进的数学计算。
功能 评估即时价格走势; 计算实时市场趋势; 计算最重要的支撑和阻力位; 算法优化,在进行复杂数学计算时系统资源消耗最小。 最佳性能自调整, 所以它可以工作于任何品种 (无论它有多奇葩) 以及任意时间帧; 与所有 MetaTrader 平台兼容, 不管报价位数或其它参数; 与所有其它工具兼容 (指标, EA 或脚本),不会减缓终端性能和交易操作。
介绍 构建一般交易策略的许多经典指标都基于简单的数学,不是因为创建这些指标时,没有优秀的数学家 (事实上,那时的数学家有可能比现在更好),但因为电脑还不存在,或是它们太简单,持续处理复杂数学操作的能力低下。如今,任何智能手机都完胜几十年前最强大的计算机。所以,处理海量信息的能力如今不再是限制,除了极其复杂的模拟处理。 高级价格走势预测者 (APMP) 指标利用当前处理能力的优势,通过一些最先进的数学、统计和概率的概念,来捕获价格波动的本质。 APMP 不能用来预测它自己,由于价格运动是一种非平稳随机过程,因此,它是不可预测的。但是,它可以对即时的价格走势进行动态的、高可靠的评估。 基

该指标同时评估波动率和价格方向性,从而发现以下事件。 [ 安装指南 | 更新指南 | 故障排除 | 常见问题 | 所有产品 ] 决定性和突然的价格变动 大锤子/流星图案 大多数市场参与者都支持强劲的突破 犹豫不决但动荡的市场形势 这是一个非常易于使用的指标... 蓝色直方图代表看涨的冲动 红色直方图代表看跌冲动 灰色直方图表示当前的波动率 移动平均线是平均波动率 该指标实施各种警报 指示器不重涂或重涂 ...具有直接的交易含义。 当看涨冲动超过平均波动率时,您可以购买 当看跌冲动超过平均波动率时,您可以卖出 该指标跟踪市场波动以及每个单个柱的看涨和看跌冲动。如果看涨的冲动超过平均波动率,那可能是做多空头的好机会。这些强劲的价格走势是可靠的,因为其他市场参与者可能会补仓。如果使用得当,此指示器功能非常强大。
作者 ArturoLópezPérez,私人投资者和投机者,软件工程师和Point Zero Trading Solutions的创始人。

IceFX 的 TradeInfo 是一款工具指标,显示当前账户和持仓的重要信息。 显示信息: 有关当前账户的信息 (结余, 净值, 可用保证金)。 当前点差, 当前回撤 (DD), 计划利润, 预计亏损, 等等。 开仓数量, 交易量 (手数), 盈利。 今日和昨日的范围。 距下一根柱线的剩余时间。 最后一日的盈利信息 (与 IceFX ProfitInfo 指标集成)。 风险- 基于开新仓的手数信息。 MagicNumber 过滤器。 注释过滤器。
FREE

This highly informative indicator applies overbought/oversold levels for more accurate representation of the market situation. It is also possible to change the appearance of the indicator - line or histogram. Additional parameters enable more fine-tuning, while trading can be inside the channel and along a trend.
Distinctive features Oversold/overbought levels; Does not redraw. Displayed as a line or a histogram; Works on all timeframes and symbols. Suitable for manual trading and developmen

MACD indicator with overbought and oversold zones. Two display options - classic lines and a histogram. Can be used to detect a possible reversal or pullback in price, as well as for channel strategies All settings are simple and straightforward - all like a standard indicator, but with additional support and resistance levels Can be used both separately and together with other indicators

This indicator is a combination of 2 classical indicators: MA and Force Index. The input parameter counted_bars determines on how many bars the indicator lines will be visible. The input parameter MaForcePeriod is used for MA and Force calculation. You may go Long if the current price crossed Up the Ribbon (HISTOGRAM) and you may go Short if the current price crossed Down the Ribbon (HISTOGRAM)

This indicator is a combination of 2 classical indicators: MA and CCI. Two moving averages form Upper and Lower bands. The input parameter counted_bars determines on how many bars the indicator's lines will be visible. The input parameter barsNum is used for MA and CCI calculation.

This indicator is using 2 classical indicators: Commodity Channel Index from the higher TF (which you may change using input parameter TimeFrame ) and Average True Range from the current TF. The Green ribbon indicates the upper trend and the Red ribbon indicates the down trend. Buy when the Yellow line crosses the Upper bound (Aqua line). Sell when the Yellow line crossover the Lower bound (Aqua line).
The input parameter counted_bars determines on how many bars the indicator lines will be visible. The input parameter barsNum is the period for bands calculation. When PriceClose for previous bar is above upper band a Long position may be opened. When PriceClose for previous bar is under lower band a Short position may be opened. If the current Price is between bands it is time to wait.

Fibonacci sequence is defined by integer sequence: 0, 1, 1, 2, 3, 5, 8, 13, 21, 34, 55, 89, 144, ... By definition, it starts from 0 and 1, the next number is calculated as a sum of two previous numbers. Instead of the standard moving average, the indicator uses the following calculation of average price: Bar0 + Bar1 + Bar2 + Bar3 + Bar5 + Bar8 + Bar13 + Bar21 + ...
Input parameters FiboNumPeriod_1 - numbers in the following integer sequence for Fibo Moving Average 1. nAppliedPrice_1 - Close p


该专家顾问实施了最初的丹尼斯和埃克哈特交易系统,通常被称为“乌龟交易者”。它的交易方式与原始海龟完全一样,并且可以由经验丰富的交易者使用以捕获向上或向下市场中的趋势。 [ 安装指南 | 更新指南 | 故障排除 | 常见问题 | 所有产品 ] 易于使用和监督 完全可配置的策略设置 完全可配置的交易设置 适用于ECN /非ECN经纪人和2-3-4-5数字符号 适用于差价合约和外汇工具 该策略交易两个互补系统,一个主系统和一个故障安全系统: 系统一交易20天突破,并在10天突破完成交易 系统2交易55天突破,并在20天突破完成交易 该策略的基本原则如下: 根据最后一个信号的结果过滤交易 交易以ATR(30)/ 2的时间间隔最多可进行4笔交易 跟踪止损适用于所有使用卖/买+/- ATR(30)* 2的交易 每减少20%,每笔交易的风险就会降低10% 该EA实现了原始乌龟交易者的默认设置,但此后在金融市场发生了很大变化。为了获得利润,交易者将必须对交易内容做出最佳判断,并优化策略测试器中的设置。
设置
将EA交易程序加载到任何图表时,将为您提供一组选项作为输入参数。如果您认为它们太多,

描述 Abigail 是中线交易系统,在价格回滚过程中赢利。 本 EA专 已经针对 EURUSD 进行了优化工作。但是,它也可以成功地与其它货币对正常工作。 您可以在 MetaTrader 4 和 MetaTrader 5 交易信号 部分检查本 EA 针对不同经纪商和品种的交易统计。 参数: 风险管理: enter volume - 入场交易量。如果此数值大于 0 - 手数, 如果小于 0 - 可用资金百分比, 如果等于 0 - 暂停入场。 portion of partial closing - 部分平仓 (大于或等于 1.0 - 完整平仓)。 limit of number of addition - 加仓数量限制。 limit step additions - 设置加仓步长。 仓位维护: take_profit - 设置止盈点数 (0 - 禁用) stop_loss - 设置止损点数 (0 - 禁用) trailing_stop - 设置尾随停止点数 (0 - 禁用, <0 - 根据指标设置) 策略设置: 一般周期 一般偏离 定义周期 定义偏离 准确周期 准确偏离 附加指标设置:

Description Keltner's colored multicurrency/multisymbol channel indicator, also called STARC band, drawn in a separate window below the chart of the main financial symbol. The indicator uses the calculation technique of the three drawing options: basic, improved and modified . The first two were proposed by Keltner, the third one - by a successful trader L. Rakshe. You can also search for your own best parameters of the indicator. The upper, middle and lower bands can be colored. The indicator
MetaTrader市场是您可以下载免费模拟自动交易,用历史数据进行测试和优化的唯一商店。
阅读应用程序的概述和其他客户的评论,直接下载程序到您的程序端并且在购买之前测试一个自动交易。只有在MetaTrader市场可以完全免费测试应用程序。
您错过了交易机会:
- 免费交易应用程序
- 8,000+信号可供复制
- 探索金融市场的经济新闻
注册
登录
