The EUR/USD’s recovery from near 1.08 handle gains further traction in mid-Asia, with the bulls jumping-off hourly 20-SMA support near 1.0830 region. EUR/USD bounces on increased safe-haven appeal Currently, the EUR/USD pair trades 0.20% higher at fresh session highs of 1...
The Japanese yen snaps losses and extends gains against its American rival in the mid-Asian session, with USD/JPY breaching key support near 123.10 region. USD/JPY on its way to hourly 200-SMA Currently, the USD/JPY pair trades -0.24% lower at fresh session lows of 123...
The Aussie keeps range below hourly 20-SMA at 0.7278 following the release of the sluggish Chinese trade figures, which once again raised worries over the country’s external demand. China data disappoints again Currently, the AUD/USD pair trades -0.11% lower at 0...
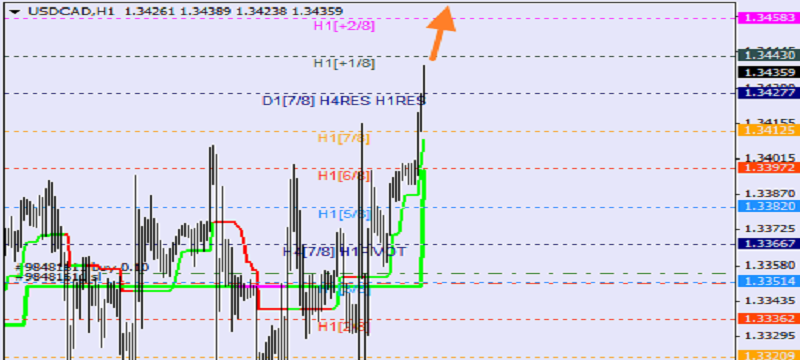
USD CAD, “US Dollar vs Canadian Dollar”At the H1 chart, the price is moving at the top as well. If the pair breaks the +2/8 level during the day, the lines at the chart will be redrawn...
USD CAD, “US Dollar vs Canadian Dollar”At the H1 chart, the price is moving at the top as well. If the pair breaks the +2/8 level during the day, the lines at the chart will be redrawn...
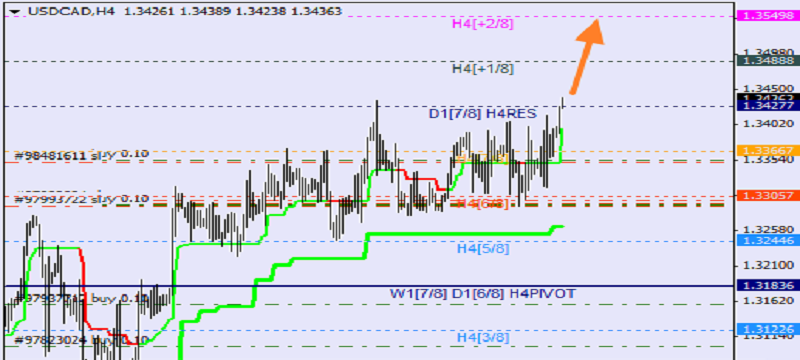
USD CAD, “US Dollar vs Canadian Dollar” Canadian Dollar is trying to stay above the 8/8 level inside “overbought zone”. Earlier, the price was supported by the 6/8 level and rebounded from it several times. In the nearest future, the market may continue moving towards the +2/8 level...
AUD/JPY was licking its wounds after losing the 0.73 handle in a soft commodities sector and the greenback losing ground to the Yen. In recent moments, there has been supply in the Aussie while PBoC said to be injecting CNY 10b via 7 day reversals and sets the ref rate mid point for CNY at 6...
On Tuesday, the Chinese central bank, PBOC, sets USD/CNY reference rate at 6.4078 versus 6.3985 previous close. Meanwhile, China’s CSI300 futures open down 0.6...
As reported by Shanghai Securities News via MNI, Shen Lan, an economist covering China for Standard Chartered noted that China's reserve requirement ratio (RRR) is expected to be cut by 0...
The USD has tended to rally against major currencies heading into the start of a Fed tightening cycle, but weaken following the first rate hike. However, the pattern is a lot more varied against Asian currencies...
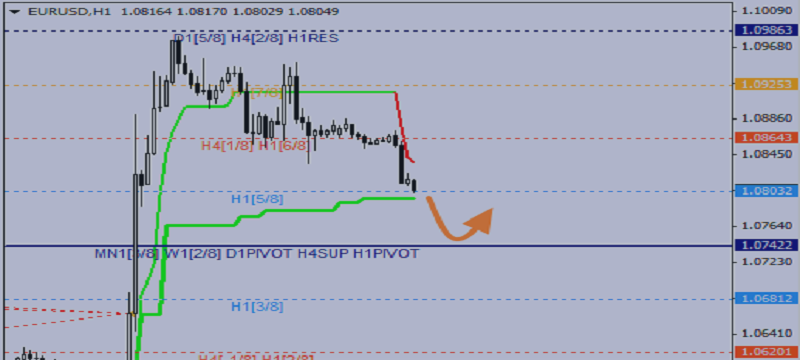
At the H1 chart, the price is getting closer to the 4/8 level. If the pair rebounds from this level, the ascending correction may continue. However, the door swings both ways: if the price breaks the 4/8 level and stays below it, the market may continue falling...
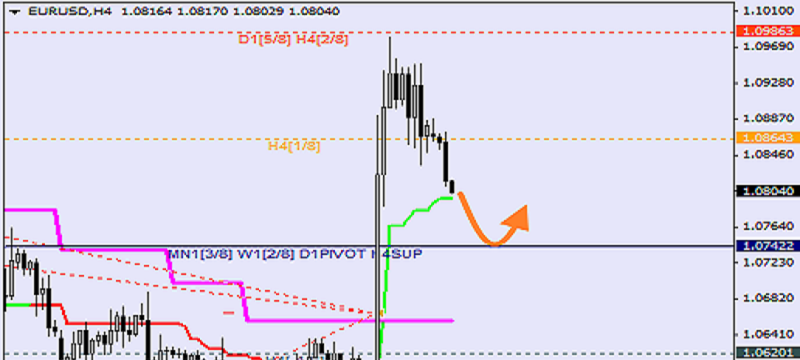
EUR USD, “Euro vs US Dollar” Eurodollar has faced resistance from the 2/8 level and started a descending correction. If later the price is supported by the 0/8 level and rebounds from it, the market may resume its ascending movement...
il prices seeped to their lowest level in over 6 years, breaking swing lows as oversupply was confirmed as not being abated any time soon. OPEC meetings ended with no resolution on production cuts and lacked any reference to output ceilings which was the big kicker in sending Oil to new lows...
we can see at the H1 chart, the price is trying to rebound from the retracement of 38.2%. It’s highly likely that on Monday the pair may complete the local correction...
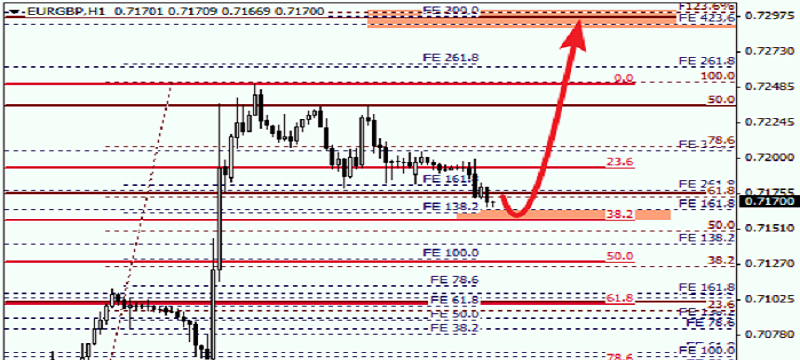
Europound has started an ascending correction as well. The closest is the local group of fibo-levels at 0.7295. Possibly, the market may resume its growth towards upside targets during the day...
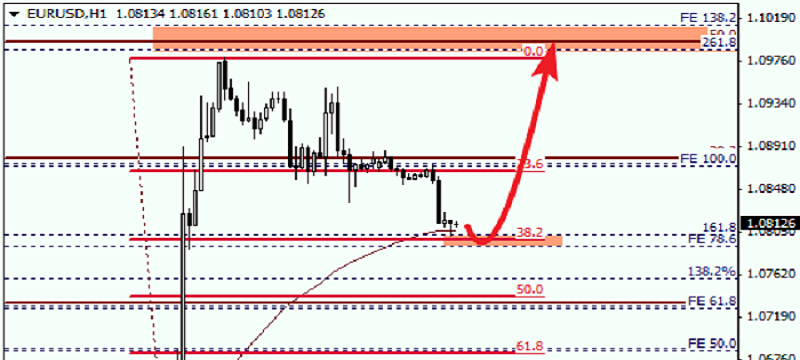
At the H1 chart, the price is moving near the local retracement of 38.2%. If the price rebounds from this retracement upwards, it may resume its ascending movement towards upside targets...
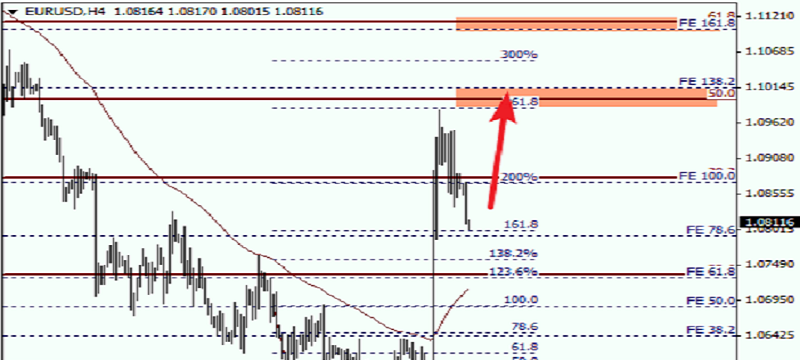
In case of Eurodollar, the ascending correction continues; its closest target is at the group of fibo-levels close to the correctional retracement of 50%. If this level is broken, the market may continue its growth towards the retracement of 61.8...
GBP/USD found support at the 1.5040 zone and settled in a slim range just above where it has spent the last hours, unable to pick up momentum either side of the board in the absence of first-tier data...
Analysts at TD Securities noted that this week sees the release of Chinese November trade (Tuesday) and CPI (Wednesday). Key Quotes: "We and the consensus have pencilled in a similar recovery for exports (-5% Y/Y from a prior -6.9...