Receive Christmas bonuses from RoboForex in December RoboForex is opening a season of holiday surprises for its clients. Only in December up until Christmas and New Year, you can benefit from several unique offers and presents...
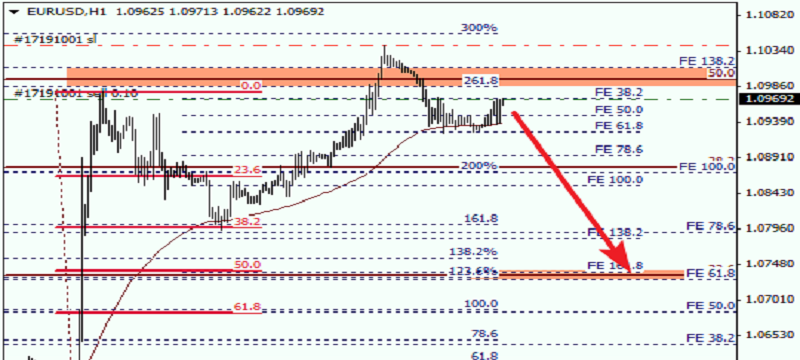
EUR USD, “Euro vs US Dollar” At the H1 chart, the price has broken Moving Average (period 34), which provided support earlier, and it means that the market may resume its descending movement. The closest target is the group of fibo-levels at 1.0735...
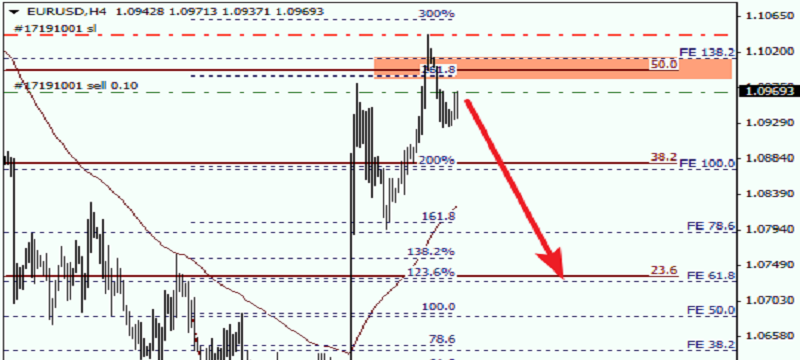
EUR USD, “Euro vs US Dollar” Eurodollar has rebounded from the group of fibo-levels near the retracement of 50%, which means that it may resume falling. It’s highly likely that in the nearest future, the pair may the market may fall towards its local low...
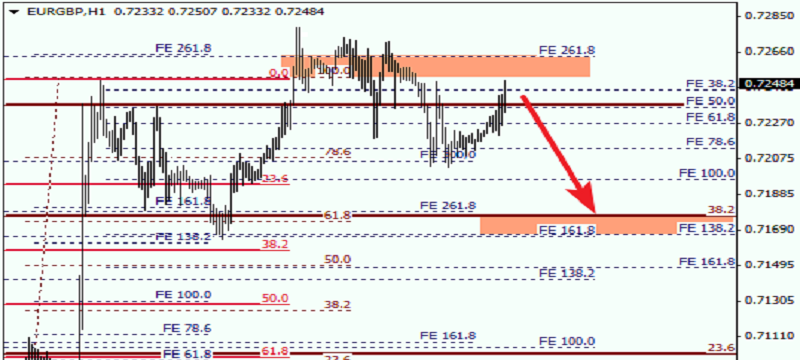
EUR GBP, “Euro vs Great Britain Pound” we can see at the H1 chart, the predicted target of the current correction is confirmed by local retracements. On Friday, the pair may fall to reach the group of lower fibo-levels at 0.7170. If the market breaks them, it may continue falling much deeper...
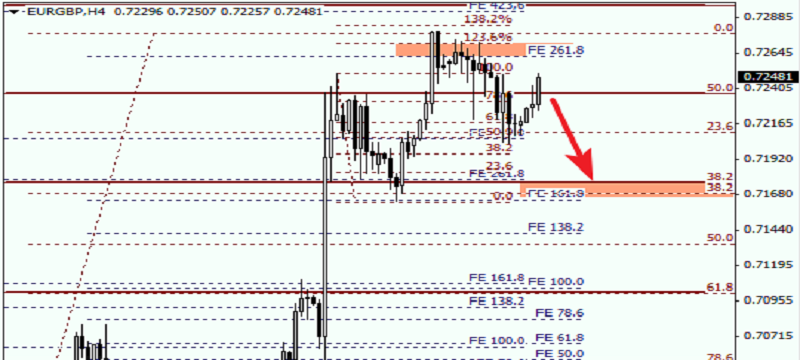
EUR GBP, “Euro vs Great Britain Pound” Europound has rebounded from the group of local fibo-levels and right now is trying to resume its movement inside the current downtrend. On Friday, the pair may fall to reach local retracements at 0.7170...
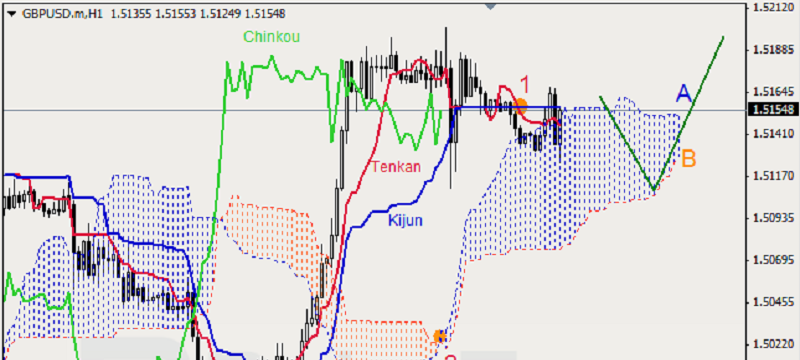
GBP USD, “Great Britain Pound vs US Dollar” GBP USD, Time Frame H1. Indicator signals: Tenkan-Sen and Kijun-Sen intersected above Kumo Cloud and formed “Dead Cross” (1). Ichimoku Cloud is going up (2); Chinkou Lagging Span is below the chart...
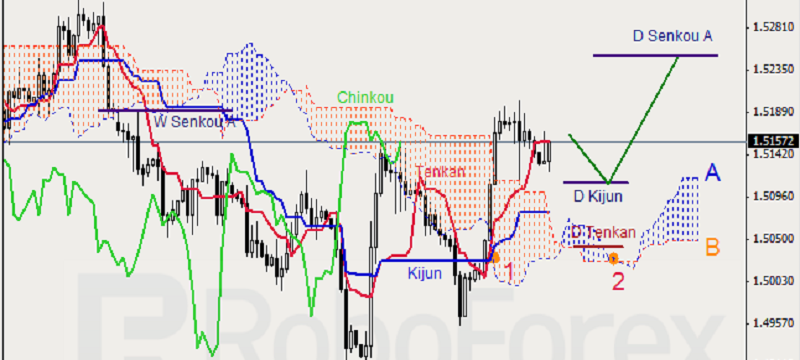
GBP USD, “Great Britain Pound vs US Dollar” GBP USD, Time Frame H4. Indicator signals: Tenkan-Sen and Kijun-Sen are still influenced by “Golden Cross” (1). Ichimoku Cloud is heading up (2); Chinkou Lagging Span is rebounding from the chart to the upside...
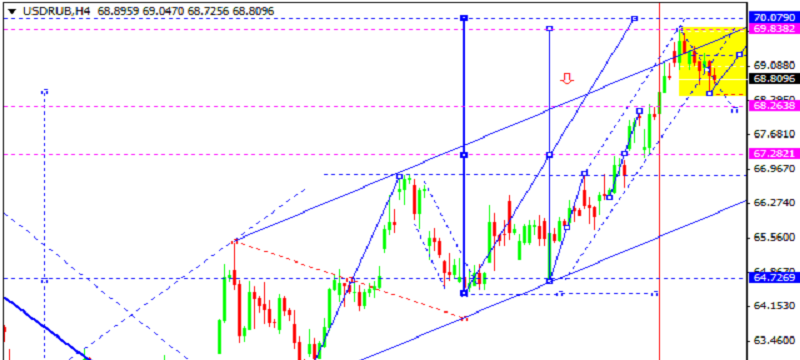
USD RUB, “US Dollar vs Russian RubleThe price may reach 70.08 and fall towards 68.30. The market is forming another consolidation channel with the central structure to expand it upwards. After that, the instrument may expand the channel downwards and form a reversal pattern...
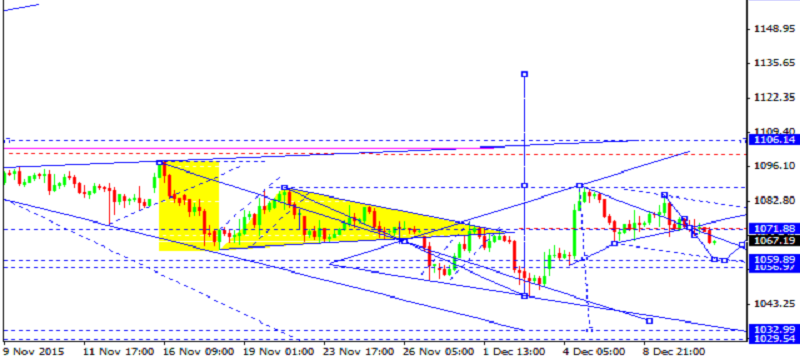
XAU USD, “Gold vs US Dollar” Gold has broken 1071.88 and almost formed a continuation pattern. We think, today, the price may reach 1060.00 and then test 1071.88 from below. After that, the instrument may resume falling towards 1057.00...
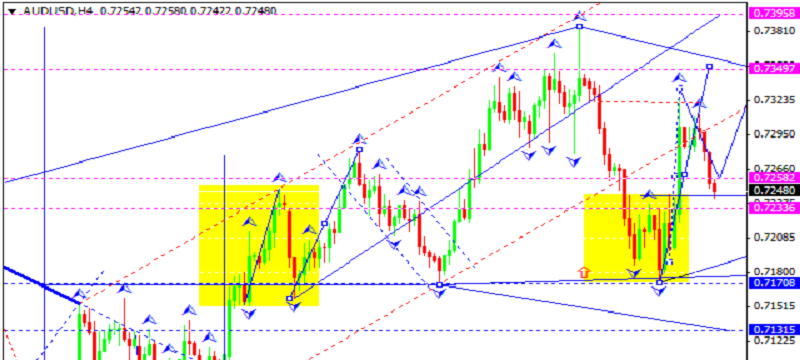
AUD USD, “Australian Dollar vs US Dollar” Australian Dollar is growing towards 0.7350. After that, the instrument may return to 0.7233. The market is forming triangle pattern in the center of its consolidation channel...
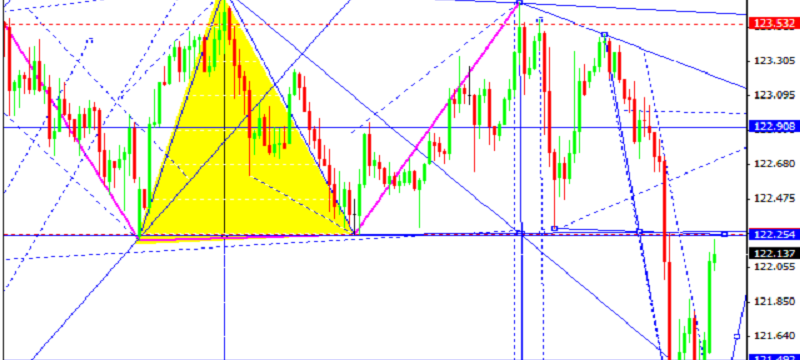
USD JPY, “US Dollar vs Japanese Yen” Yen is returning to 122.25. We think, today, the price may reach this target and then continue falling towards the local target at 121.00...
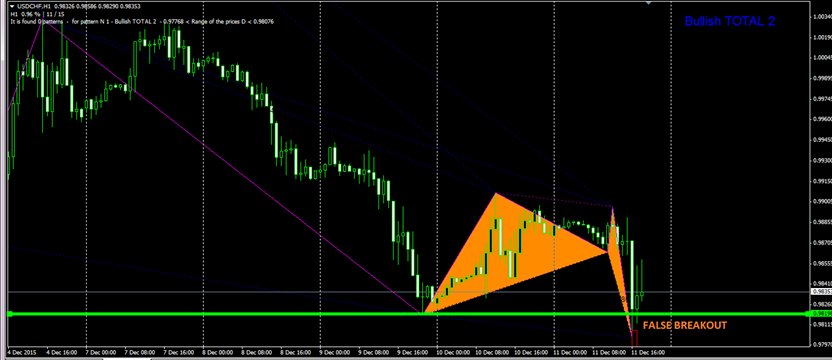
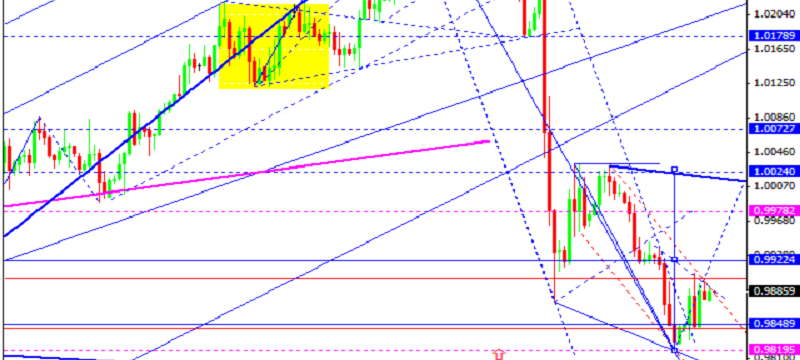
USD CHF, “US Dollar vs Swiss Franc” Franc has formed the ascending impulse and corrected it. We think, today, the price may form another ascending impulse to return to 1.0024 and then test 0.9924 from above, thus morning a wider consolidation channel...
USD CHF, “US Dollar vs Swiss Franc” Franc has formed the ascending impulse and corrected it. We think, today, the price may form another ascending impulse to return to 1.0024 and then test 0.9924 from above, thus morning a wider consolidation channel...
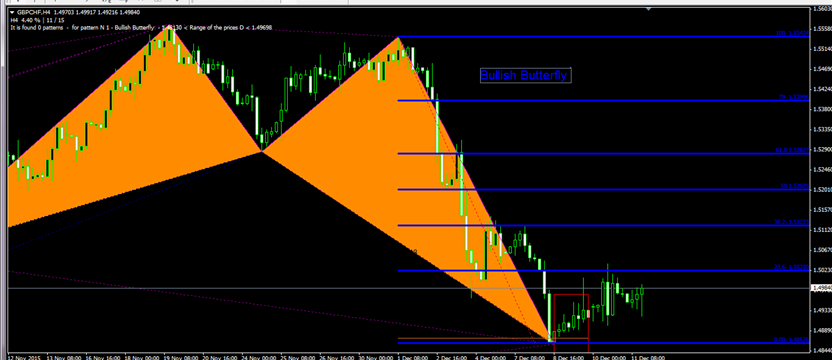
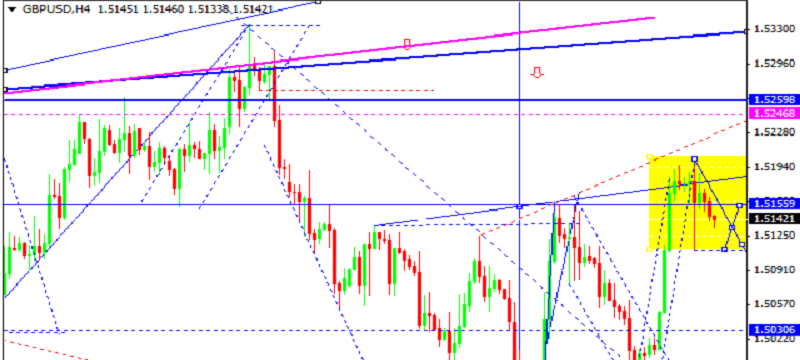
GBP USD, “Great Britain Pound vs US Dollar” Pound is consolidating. We think, today, the price may expand this consolidation channel downwards and then return to 1.5156. Later, in our opinion, the market may continue falling to complete the correction with the target at 1.5030...
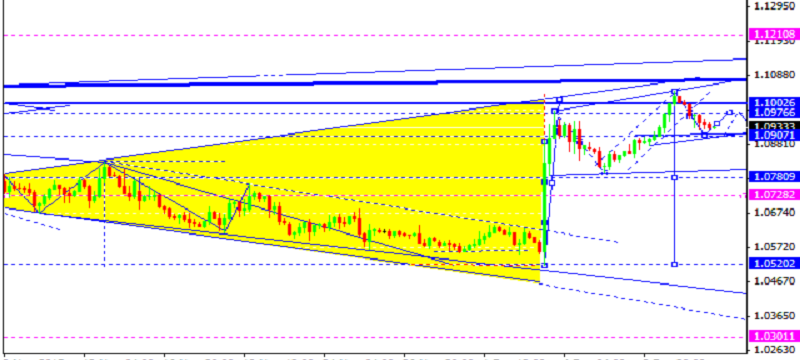
EUR USD, “Euro vs US Dollar” Eurodollar is forming the descending impulse with the target at 1.0907. After that, the instrument may return to 1.0976 and then continue falling inside the downtrend. The next target is at 1.0780...
The Reserve Bank of India on Thursday allowed exchanges to offer cross currency futures contracts and exchange-traded currency options in three more currency pairs...