Mohammed Kaddour / Profile
- Information
|
1 year
experience
|
12
products
|
9
demo versions
|
|
0
jobs
|
0
signals
|
0
subscribers
|
With years of hands-on experience in building custom indicators, trading strategies, and expert advisors (EAs), I specialize in turning trading concepts into powerful and reliable tools. I’ve worked with traders around the world to develop efficient, high-performance solutions tailored to their specific needs—whether for TradingView or MetaTrader 4/5.
What I Offer:
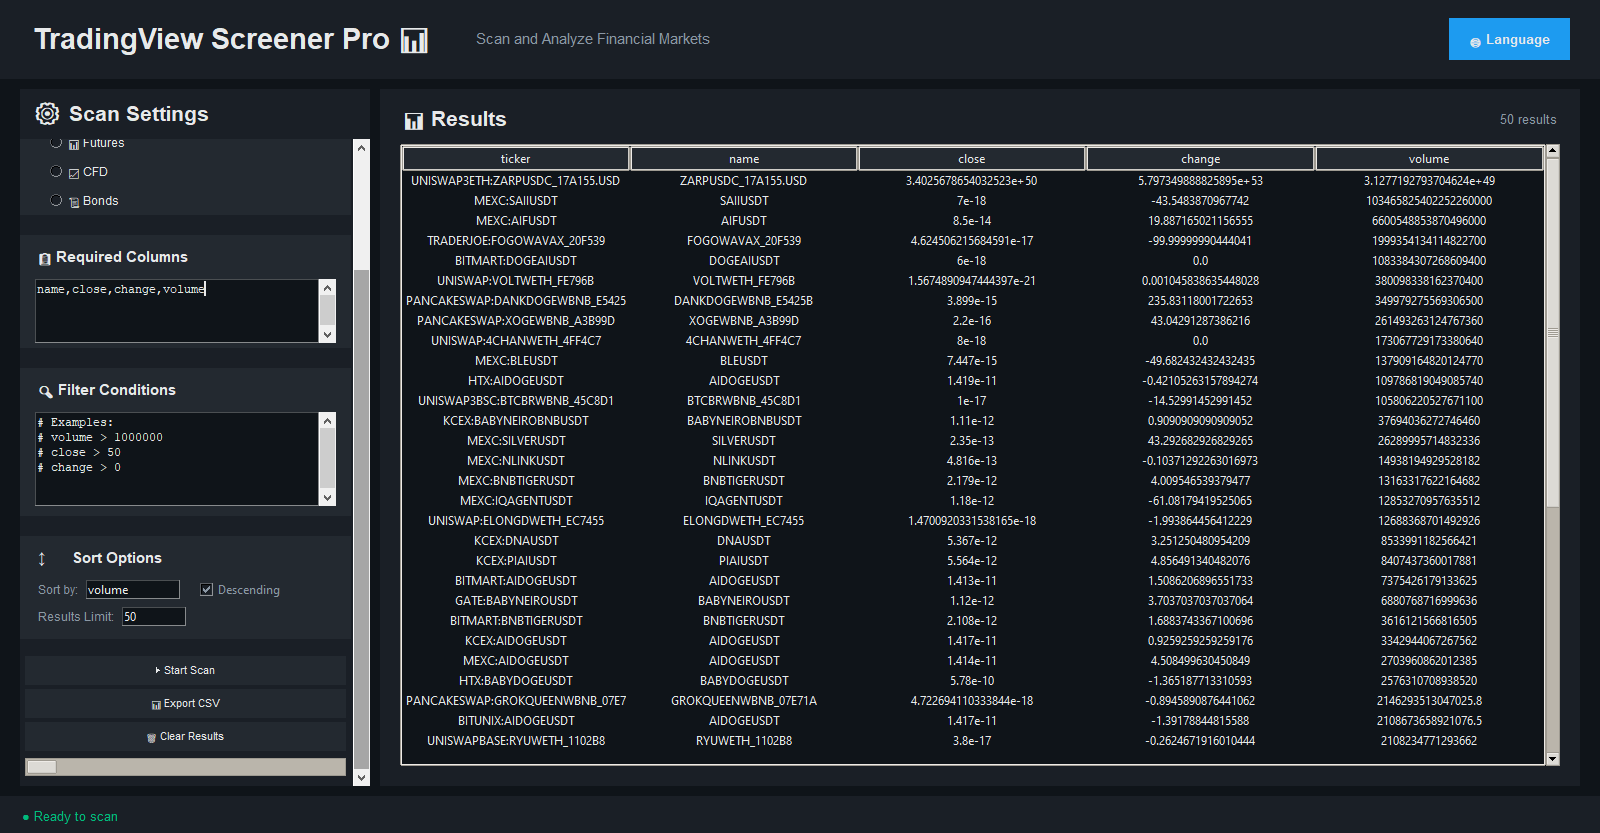
Custom Pine Script indicators and alerts for TradingView
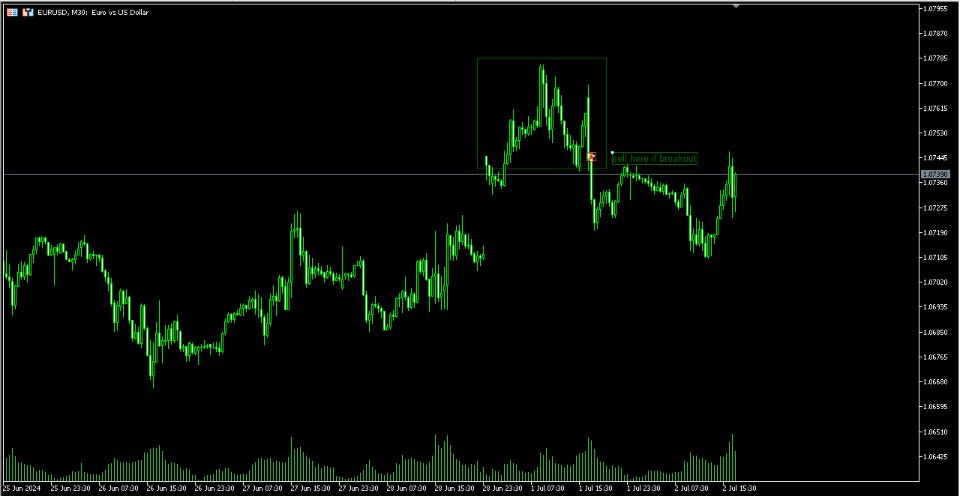
Expert Advisors (EAs) and indicators in MQL4/MQL5
Strategy automation and backtesting
Clean, optimized code with clear documentation
Fast delivery and responsive communication
I take pride in delivering results that not only work—but work exactly the way you want them to.
Your complete satisfaction is my priority, and I guarantee the necessary revisions to ensure the final result meets your expectations.
Let’s build something great for your trading journey!
If you're a TradingView user, you've probably heard of Pine Script — the simple yet powerful language used to build custom indicators and strategies directly on the chart.
💡 Pine Script was designed specifically for traders and technical analysts. It doesn't require deep programming knowledge, making it a great entry point for anyone who wants to transform their trading ideas into actionable tools.
🔧 With Pine Script, you can:
* Create custom buy/sell signals.
* Develop and backtest trading strategies.
* Draw trendlines, support/resistance levels, and set smart alerts.
* Combine and analyze multiple timeframes dynamically.
🎯 Personally, I find Pine Script one of the best tools that helped me turn manual analysis into smart, automated tools — saving time and improving decision-making accuracy.
📌 If you're thinking of building your own indicators or customizing your TradingView experience, Pine Script is the perfect place to start.
Have you ever created your own Pine Script indicator?
Share your experience or questions in the comments below 👇
Volonacci Indicator It is an indicator that combines Fibonacci and volume to determine the price direction This indicator helps you identify Fibonacci angles according to the strategy The Volonacci indicator is indeed an interesting combination of Fibonacci levels and volume. This indicator uses Fibonacci tools to identify potential support and resistance levels, and enhances this by using volume to confirm the strength behind the price action. MT5 Version
Volonacci Indicator It is an indicator that combines Fibonacci and volume to determine the price direction This indicator helps you identify Fibonacci angles according to the strategy The Volonacci indicator is indeed an interesting combination of Fibonacci levels and volume. This indicator uses Fibonacci tools to identify potential support and resistance levels, and enhances this by using volume to confirm the strength behind the price action. MT4 Version
A Renko Tick chart based on continuously adjusting percentage. Live Renko bricks formed by tick data Adjustable brick width expert for indicator attached Scalp with a Renko, get weird. The settings can and will break the script if you turn them up too high. Turning off outline mode will not look as nice, but can potentially allow for a larger number of bricks
The script tries to determine the overall direction of the market, using smoothed Heiken Ashi candles. The coloring system (using bright and dark colors) is an attempt to detect strong market and weak market conditions. There's also an oscillator within the script These are the features: Alert condition Features: You can now set alerts in the alert dialog for events like trend switch, trend strengthening and weakening; all for both Bullish and Bearish trend. I also added the code for
https://www.mql5.com/en/market/product/119890#!tab=stat
EA with the idea of using the "High Risk - High Reward" strategy. You should use the EA with the same capital as my trading signal, withdraw profits regularly and only use lot size 0.01 no matter the capital. Nexus hedg ea is an EA that work with hedge strategy.It can trade Crypto, Forex pairs, Metals, Indice but need your optimize. Fully automatic adviser, with a system for recovering from losses. This EA not use anything indicator for entries. Just use math logical. Features
This is a classic Range BreakOut system. Range is defined by min number of bars and max width in pips. User can adjust both. The Range Breakout Expert Advisor can be used to trade time ranges. The market often finds its direction in the morning hours and then follows this trend for the day, This expert advisor is designed to trade these trends after the morning breakout. Still you can trade all sorts of time breakouts with this program. How the expert works The expert creates a range from a
Many traders use Price Action as entry and exit signal. Since the beginning of chart analysis, traders have found several candlestick patterns that can indicate possible "behaviors" of the market. Candlestick Pattern indicator is an indicator for MetaTrader platform that can detect many of these patterns and show them on screen or to alert traders about them. though they detect slightly different sets of candle patterns. Candlestick Pattern indicator also has a more
INTRODUCTION : The breakout strength meter is a trading tool that is used to identify which currencies are the strongest to breakout, and which currencies are the weakest to breakout. The settings for the indicator are easy, and if you cannot find the settings, please leave a comment The tools are completely free to use Please, if you like the indicator, please leave a comment and rate the indicator in order to develop it
The indicator displays support and resistance levels based on fibonacci level in multi period Creates lines indicating the latest support and resistance levels. These lines are updated whenever there is a change in support or resistance levels. Labels are removed if the corresponding conditions are not met. the period is availble in setting and level fibonacci
This variant of the ZigZag indicator is recalculated at each tick only at the bars that were not calculated yet and, therefore, it does not overload CPU at all which is different from the standard indicator. Besides, in this indicator drawing of a line is executed exactly in ZIGZAG style and, therefore, the indicator correctly and simultaneously
Pivot Points are used by Forex traders to find support and resistance levels based on the previous day's price action. There are various ways to calculate pivot points, including averaging the open, high, low, and close of the previous day's chart price. Forex Traders use a combination of pivot points with moving averages to find trading opportunities in the currency markets. Pivot points are very useful tools that use the previous bars' highs, lows and closings to project support and resistance


