Young Ho Seo / Profile
- Information
|
12+ years
experience
|
62
products
|
1206
demo versions
|
|
4
jobs
|
0
signals
|
0
subscribers
|
Harmonic Pattern Indicator - Repainting + Japanese Candlestick Pattern Scanner + Automatic Channel + Many more
https://www.mql5.com/en/market/product/4488
https://www.mql5.com/en/market/product/4475
https://algotrading-investment.com/portfolio-item/harmonic-pattern-plus/
Non Repainting and Non Lagging Harmonic Pattern Indicator – Customizable Harmonic + Japanese Candlestic Pattern Scanner + Advanced Channel + Many more
https://www.mql5.com/en/market/product/41993
https://www.mql5.com/en/market/product/41992
https://algotrading-investment.com/portfolio-item/profitable-pattern-scanner/
Supply Demand Indicator – Multiple Timeframe Scanning Added + Non Repainting + Professional Indicator
https://www.mql5.com/en/market/product/40076
https://www.mql5.com/en/market/product/40075
https://algotrading-investment.com/portfolio-item/ace-supply-demand-zone/
Momentum Indicator – Path to Volume Spread Analysis
https://www.mql5.com/en/market/product/30641
https://www.mql5.com/en/market/product/30621
https://algotrading-investment.com/portfolio-item/excessive-momentum-indicator/
Elliott Wave Indicator for the Power User
https://www.mql5.com/en/market/product/16479
https://www.mql5.com/en/market/product/16472
https://algotrading-investment.com/portfolio-item/elliott-wave-trend/
Forex Prediction - Turn Support and Resistance to the Advanced Strategy
https://www.mql5.com/en/market/product/49170
https://www.mql5.com/en/market/product/49169
https://algotrading-investment.com/portfolio-item/fractal-pattern-scanner/
MetaTrader 4 and MetaTrader 5 Product Page: https://www.mql5.com/en/users/financeengineer/seller#products
Free Forex Prediction with Fibonacci Analysis: https://algotrading-investment.com/2020/10/23/forex-prediction-with-fibonacci-analysis/
Free Harmonic Pattern Signal: https://algotrading-investment.com/2020/12/17/harmonic-pattern-signal-for-forex-market/
============================================================================================================================
Here are the trading education books. We recommend reading these books if you are a trader or investor in Forex and Stock market. In the list below, we put the easy to read book on top. Try to read the easy to read book first and try to read the harder book later to improve your trading and investment.
First Link = amazon.com, Second Link = Google Play Books, Third Link = algotrading-investment.com, Fourth Link = Google Books
Technical Analysis in Forex and Stock Market (Supply Demand Analysis and Support Resistance)
https://www.amazon.com/dp/B09L55ZK4Z
https://play.google.com/store/books/details?id=pHlMEAAAQBAJ
https://algotrading-investment.com/portfolio-item/technical-analysis-in-forex-and-stock-market/
https://books.google.co.kr/books/about?id=pHlMEAAAQBAJ
Science Of Support, Resistance, Fibonacci Analysis, Harmonic Pattern, Elliott Wave and X3 Chart Pattern (In Forex and Stock Market Trading)
https://www.amazon.com/dp/B0993WZGZD
https://play.google.com/store/books/details?id=MME3EAAAQBAJ
https://algotrading-investment.com/portfolio-item/science-of-support-resistance-fibonacci-analysis-harmonic-pattern/
https://books.google.co.kr/books/about?id=MME3EAAAQBAJ
Profitable Chart Patterns in Forex and Stock Market (Fibonacci Analysis, Harmonic Pattern, Elliott Wave, and X3 Chart Pattern)
https://www.amazon.com/dp/B0B2KZH87K
https://play.google.com/store/books/details?id=7KrQDwAAQBAJ
https://algotrading-investment.com/portfolio-item/profitable-chart-patterns-in-forex-and-stock-market/
https://books.google.com/books/about?id=7KrQDwAAQBAJ
Guide to Precision Harmonic Pattern Trading (Mastering Turning Point Strategy for Financial Trading)
https://www.amazon.com/dp/B01MRI5LY6
https://play.google.com/store/books/details?id=8SbMDwAAQBAJ
http://algotrading-investment.com/portfolio-item/guide-precision-harmonic-pattern-trading/
https://books.google.com/books/about?id=8SbMDwAAQBAJ
Scientific Guide to Price Action and Pattern Trading (Wisdom of Trend, Cycle, and Fractal Wave)
https://www.amazon.com/dp/B073T3ZMBR
https://play.google.com/store/books/details?id=5prUDwAAQBAJ
https://algotrading-investment.com/portfolio-item/scientific-guide-to-price-action-and-pattern-trading/
https://books.google.com/books/about?id=5prUDwAAQBAJ
Predicting Forex and Stock Market with Fractal Pattern: Science of Price and Time
https://www.amazon.com/dp/B086YKM8BW
https://play.google.com/store/books/details?id=VJjiDwAAQBAJ
https://algotrading-investment.com/portfolio-item/predicting-forex-and-stock-market-with-fractal-pattern/
https://books.google.com/books/about?id=VJjiDwAAQBAJ
Trading Education Book 1 in Korean (Apple, Google Play Book, Google Book, Scribd, Kobo)
https://books.apple.com/us/book/id1565534211
https://play.google.com/store/books/details?id=HTgqEAAAQBAJ
https://books.google.co.kr/books/about?id=HTgqEAAAQBAJ
https://www.scribd.com/book/505583892
https://www.kobo.com/ww/en/ebook/8J-Eg58EDzKwlpUmADdp2g
Trading Education Book 2 in Korean (Apple, Google Play Book, Google Book, Scribd, Kobo)
https://books.apple.com/us/book/id1597112108
https://play.google.com/store/books/details?id=shRQEAAAQBAJ
https://books.google.co.kr/books/about?id=shRQEAAAQBAJ
https://www.scribd.com/book/542068528
https://www.kobo.com/ww/en/ebook/X8SmJdYCtDasOfQ1LQpCtg
About Young Ho Seo
Young Ho Seo is an Engineer, Financial Trader, and Quantitative Developer, working on Trading Science and Investment Engineering since 2011. He is the creator of many technical indicators, price patterns and trading strategies used in the financial market. He is also teaching the trading practice on how to use the Supply Demand Analysis, Support, Resistance, Trend line, Fibonacci Analysis, Harmonic Pattern, Elliott Wave Theory, Chart Patterns, and Probability for Forex and Stock Market. His works include developing scientific trading principle and mathematical algorithm in the work of Benjamin Graham, Everette S. Gardner, Benoit Mandelbrot, Ralph Nelson Elliott, Harold M. Gartley, Richard Shabacker, William Delbert Gann, Richard Wyckoff and Richard Dennis. You can find his dedicated works on www.algotrading-investment.com . His life mission is to connect financial traders and scientific community for better understanding of this world and crowd behaviour in the financial market. He wrote many books and articles, which are helpful for understanding the technology and application behind technical analysis, statistics, time series forecasting, fractal science, econometrics, and artificial intelligence in the financial market.
If you are interested in our software and training, just visit our main website: www.algotrading-investment.com
Young Ho Seo
Why Price Action and Pattern Trading
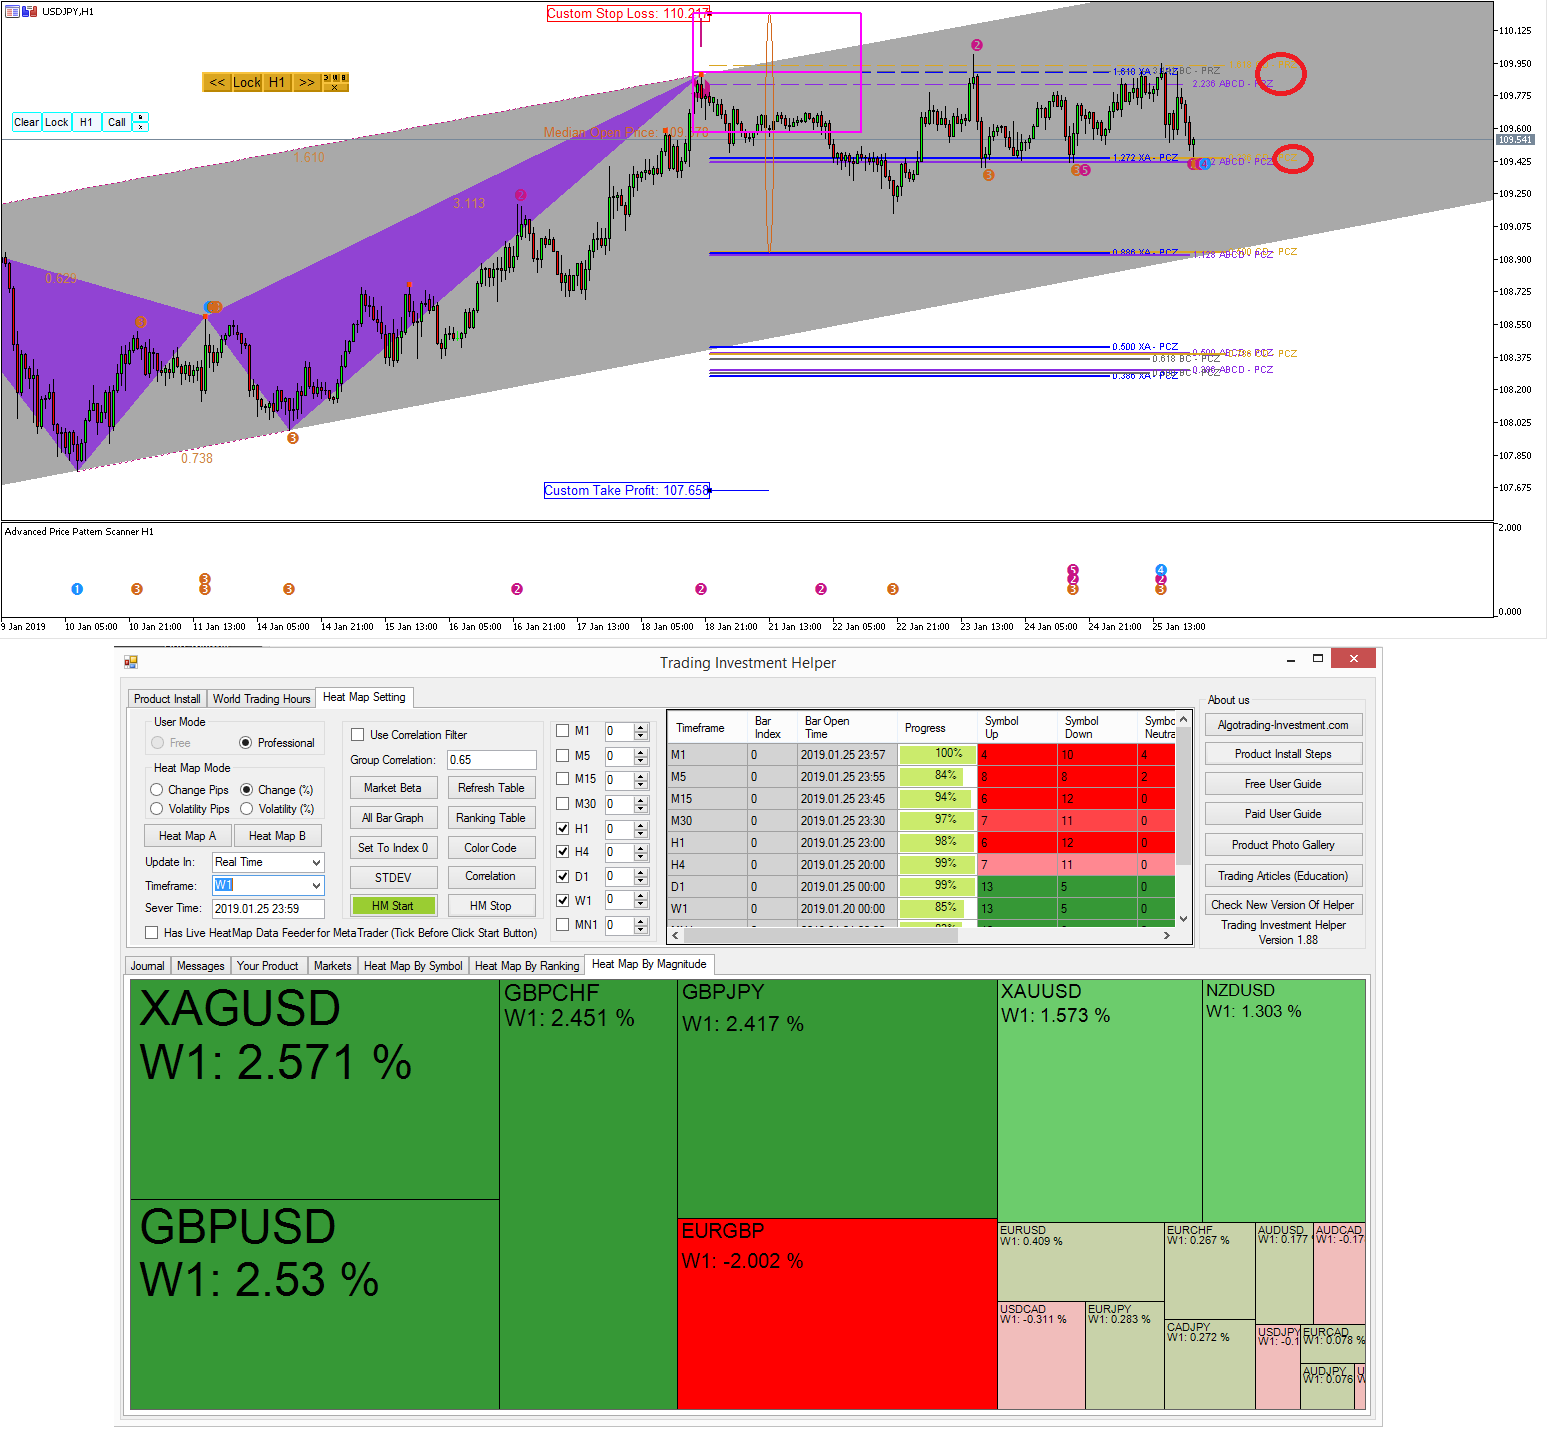
When I first started trading, that was some time ago when the very first version of MetaTrader 4 was released. At that time, I used both manual trading and expert adviser, as I was a curious beast. After some months of learning popular technical indicators and charting techniques at that time, I tested my knowledge in real world market for the first time in Forex trading. I was light minded and all I thought was that I would just use the most basic techniques I learnt.
Just as if many starters do, I also had some beginner’s luck. In the 20 trades in one day, I got around 17 trades produced the correct buy and sell decision. As the great fan of statistics, math, and polymath, I know that the figure 17 out of 20 is not a random number.
Ironically, I was not able to produce similar results following days. From next days, I was probably disturbed with several minds like those that I will become rich soon if I maintain this high success rate, etc. I could not concentrate on my trading. When I look back all this, this was the typical beginner’s thought anyway. Even though this was happened over 10 years ago, still I considered this as one of very important lessons in my life.
I am very much analytical person. I gave a lot of thought on the incidence where I got 17 correct predictions out of 20. Therefore, I started to think about the main ingredients of this event. It was the chart as my decision was merely the reaction against the price action in my chart. That is to say that my intuition does most of work to figure out the decision. It was not technical indicators (I guess they supported my decision up to some degree but not the main ingredients) though but it was rather entire candlesticks drawn in charts.
After intensive research, I found the closest and most convincing term to describe what my intuition did. It was the price patterns. Subconsciously, my brain was looking for certain geometry from chart to win in the market. Of course, not many people can manipulate subconscious in consistent manner including myself. To use the subconscious effectively, you have to bring the subconscious to the surface, i.e. conscious space. That is to say, that you need some training or tools to pick up the geometry like your brain does subconsciously.
You know that pattern recognition is the most accurate weapons we have and we use every day in our life. We use it to find out our friends, lover, enemy, good house, bad house, etc. For forex and stock trading, this is also the precious weapon to select good stocks and bad stocks to trade and to figure out potential bullish and bearish market as well as turning point. Price patterns in charts are aligned with your intuition for your trading. Fortunately, we have made many trials and errors of using this price patterns in the market to find out the best practical application. Here is one secret of best trading practice.
The very essence of best trading practice come down to one words, “superimposed pattern”. That is to say, that you make trading decision based on multiple of patterns aligned in chart to get the highest accuracy as possible (=superimposed pattern trading). This follows the typical wisdom taught in many trading schools and textbooks, “trade with multiple evidences”.
Geometry and patterns are not rocket science. Anyone can understand and use them for your trading. Some example of superimposed pattern trading principle and some recipes are introduced in my book.
https://algotrading-investment.com/portfolio-item/guide-precision-harmonic-pattern-trading/
https://algotrading-investment.com/portfolio-item/scientific-guide-to-price-action-and-pattern-trading/
Here is the great range of tools for your Price Action and Pattern Trading we have developed for your winning trading.
https://algotrading-investment.com/our-products-list/

Young Ho Seo
Powerful Use of Potential Continuation Zone with Harmonic Patterns
Potential Continuation Zone was introduced first in the book: Guide to Precision Harmonic Pattern Trading: Mastering Turning Point Strategy for Financial Trading by Young Ho Seo. Here we will show you how to improve your Harmonic trading marginally using this powerful PCZ concept.
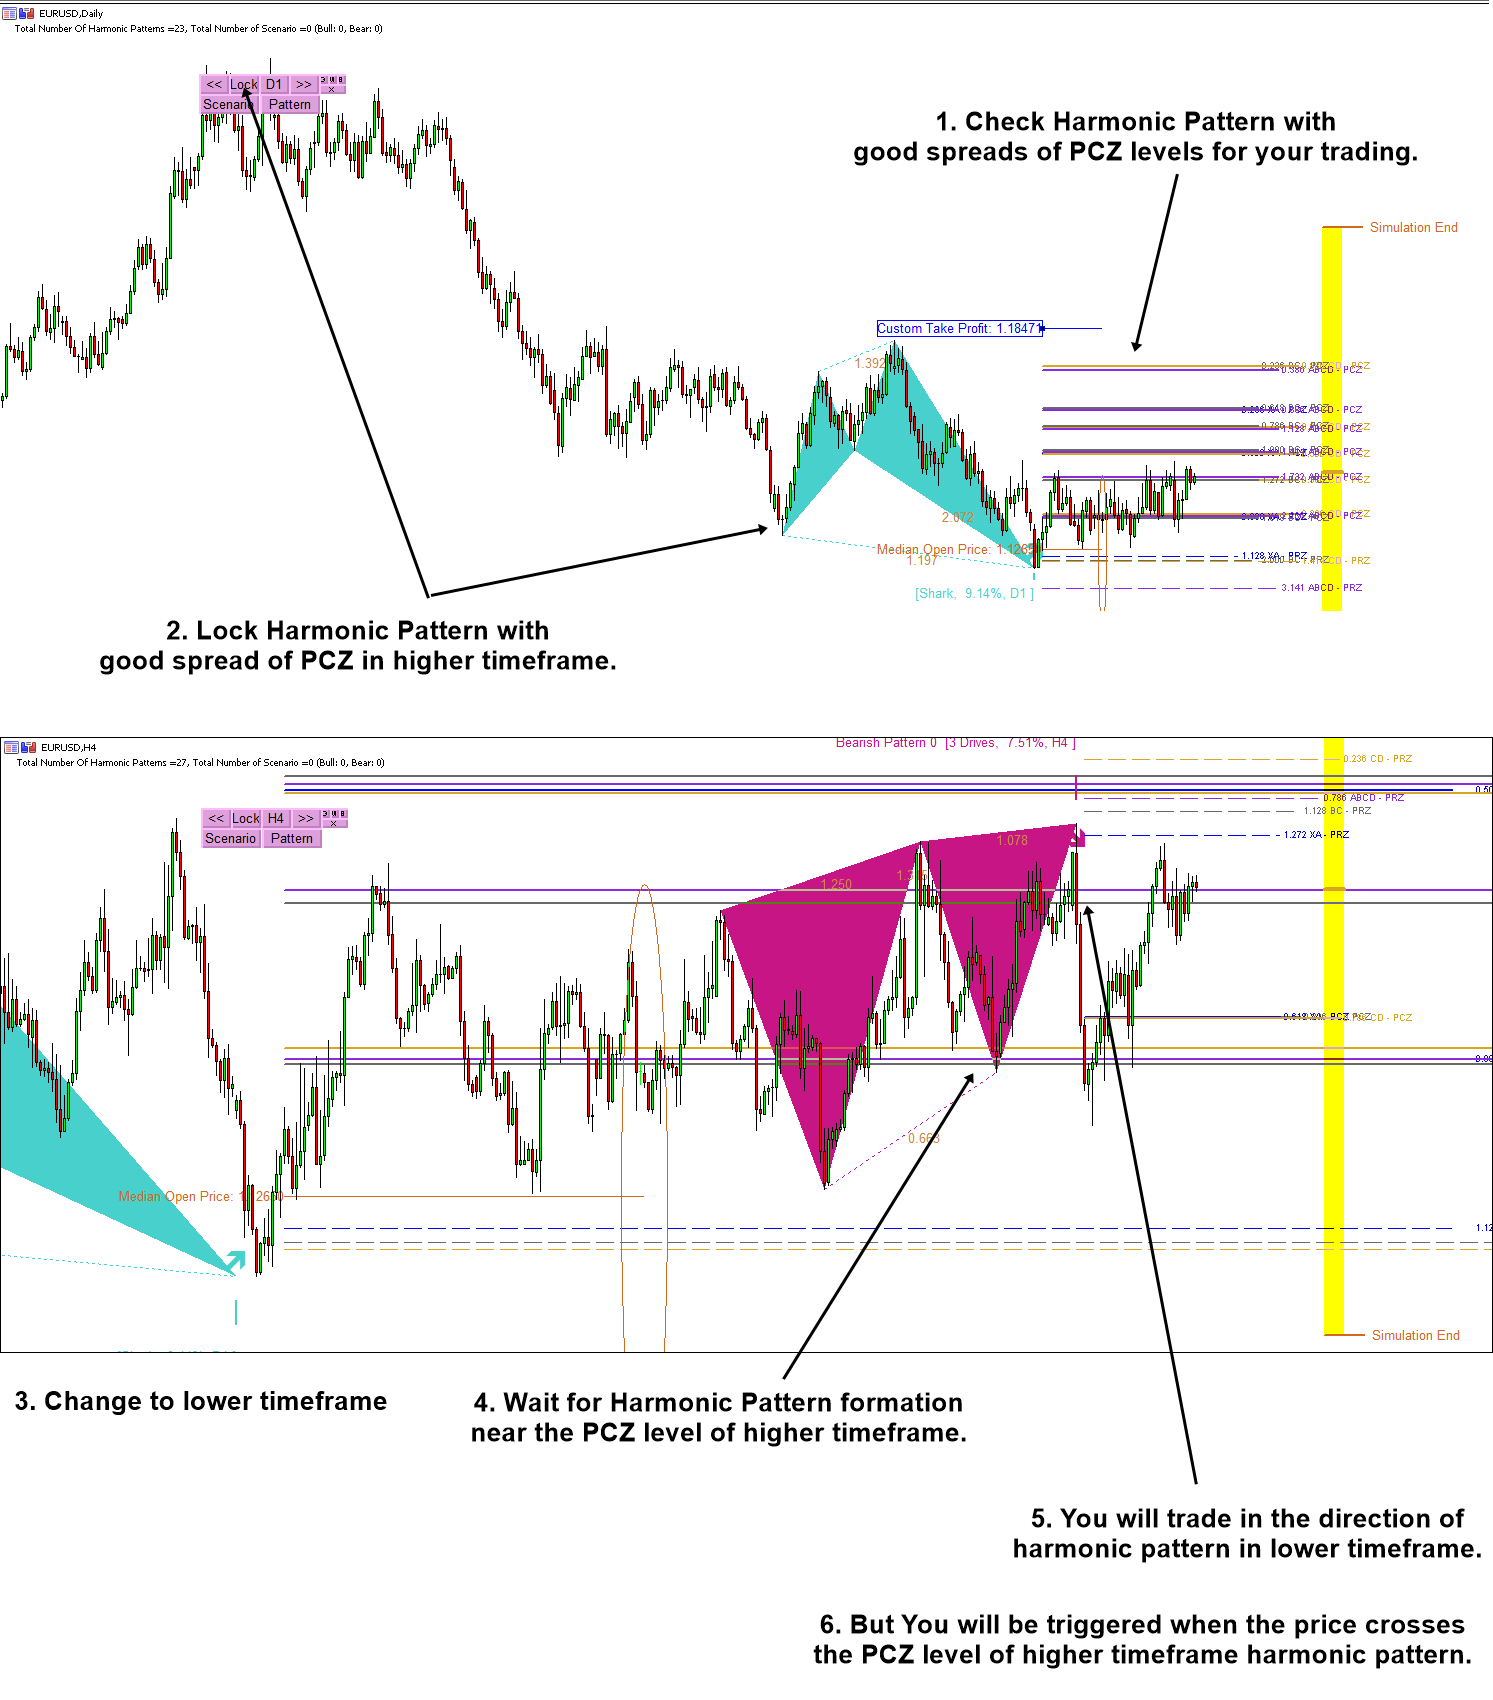
As it was shown in the book, good harmonic patterns for your trading have a well balanced Potential Continuation Zone and Potential Reversal Zone. Typically harmonic patterns with good spread of PCZ levels will help your trading immensely. In this technique, you will be looking at those harmonic patterns in higher timeframe first. Then lock the pattern in your chart. Now change your timeframe to lower like M30 or H1 or H4, etc.
You will wait for the formation of Harmonic pattern near the PCZ level of higher timeframe. Once you have found the harmonic pattern near PCZ level, then there is potential entry for you. You will be triggered when the price crosses the PCZ level and you will trade in the direction of Harmonic pattern in lower timeframe.
This is one of the technique you can trade with Potential Continuation zone. If the formation of harmonic pattern in lower timeframe coincide with Potential Reversal Zone of higher timeframe, you can still make the same trading decision as I have described before.
With this technique, your accuracy of harmonic trading will increase marginally. This technique works well because you have good grab of market insight in both higher and lower timeframe.
Here is further tip when you are using Harmonic Pattern Scenario Planner. In this case, you will follow step 1, 2 and 3 in the screenshot. With Harmonic Pattern Scenario Planner, you can predict potential harmonic pattern formation in advance in lower timeframe. So you could anticipate at which level you will be trading before other trader. Prediction future harmonic pattern is real good stuff from Harmonic Pattern Scenario Planner.
As it was mentioned in the book: Guide to Precision Harmonic Pattern Trading, your best harmonic pattern trading opportunity will appear when you blend the three concepts well in your trading including Potential Reversal Zone (Scott Carney), Potential Continuation Zone (Young Ho Seo) and Pattern Completion Interval (Young Ho Seo).
We hope you to become truly incredible trader with our cutting edge trading technology.
Below is link to our website:
https://algotrading-investment.com
https://www.mql5.com/en/users/financeengineer/seller#products

Young Ho Seo
Automatic Resizing your Stop Loss and Take Profit Level with Harmonic Pattern Plus (Harmonic Pattern Scenario Planner)
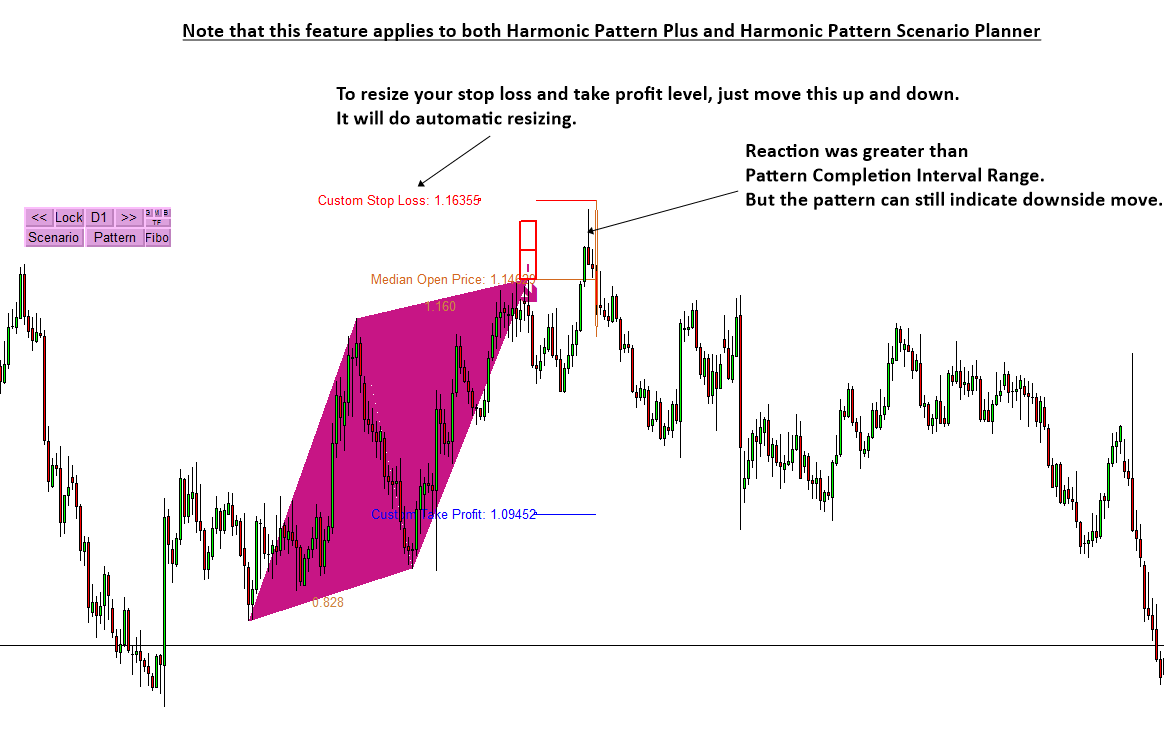
Having understood all the concept behind the Pattern Completion Interval, you might observe that sometime price can react outside the pattern completion interval. Sure, there is nothing perfect in the world. As long as you understand the pros and cons of using large stop loss size, it is still fine to control your own stop loss size.
However, we still prefer to express stop loss size in terms of pattern completion interval range for convenience. For example, if the original stop loss size was equal to 1 x pattern completion interval, you can certainly use 1.5 x pattern completion interval or 2 x pattern completion interval.
Another consideration before you are using pattern completion interval, if you can enter the market at the competitive price, then you can feel less guilty when you increase your stop loss size because you are still remaining good rewards/Risk ratio. On the other hands, if you have entered market at not so competitive price, then you might be cautious when you increase your stop loss size.
Hope this less is helpful for junior traders.
To visit our website, follow the links below:
https://www.mql5.com/en/market/product/4488
https://www.mql5.com/en/market/product/4475
https://www.mql5.com/en/market/product/6240
https://www.mql5.com/en/market/product/6101
http://algotrading-investment.com/portfolio-item/harmonic-pattern-plus/
http://algotrading-investment.com/portfolio-item/harmonic-pattern-scenario-planner/

Young Ho Seo
Introduction to Harmonic Pattern Scenario Planner
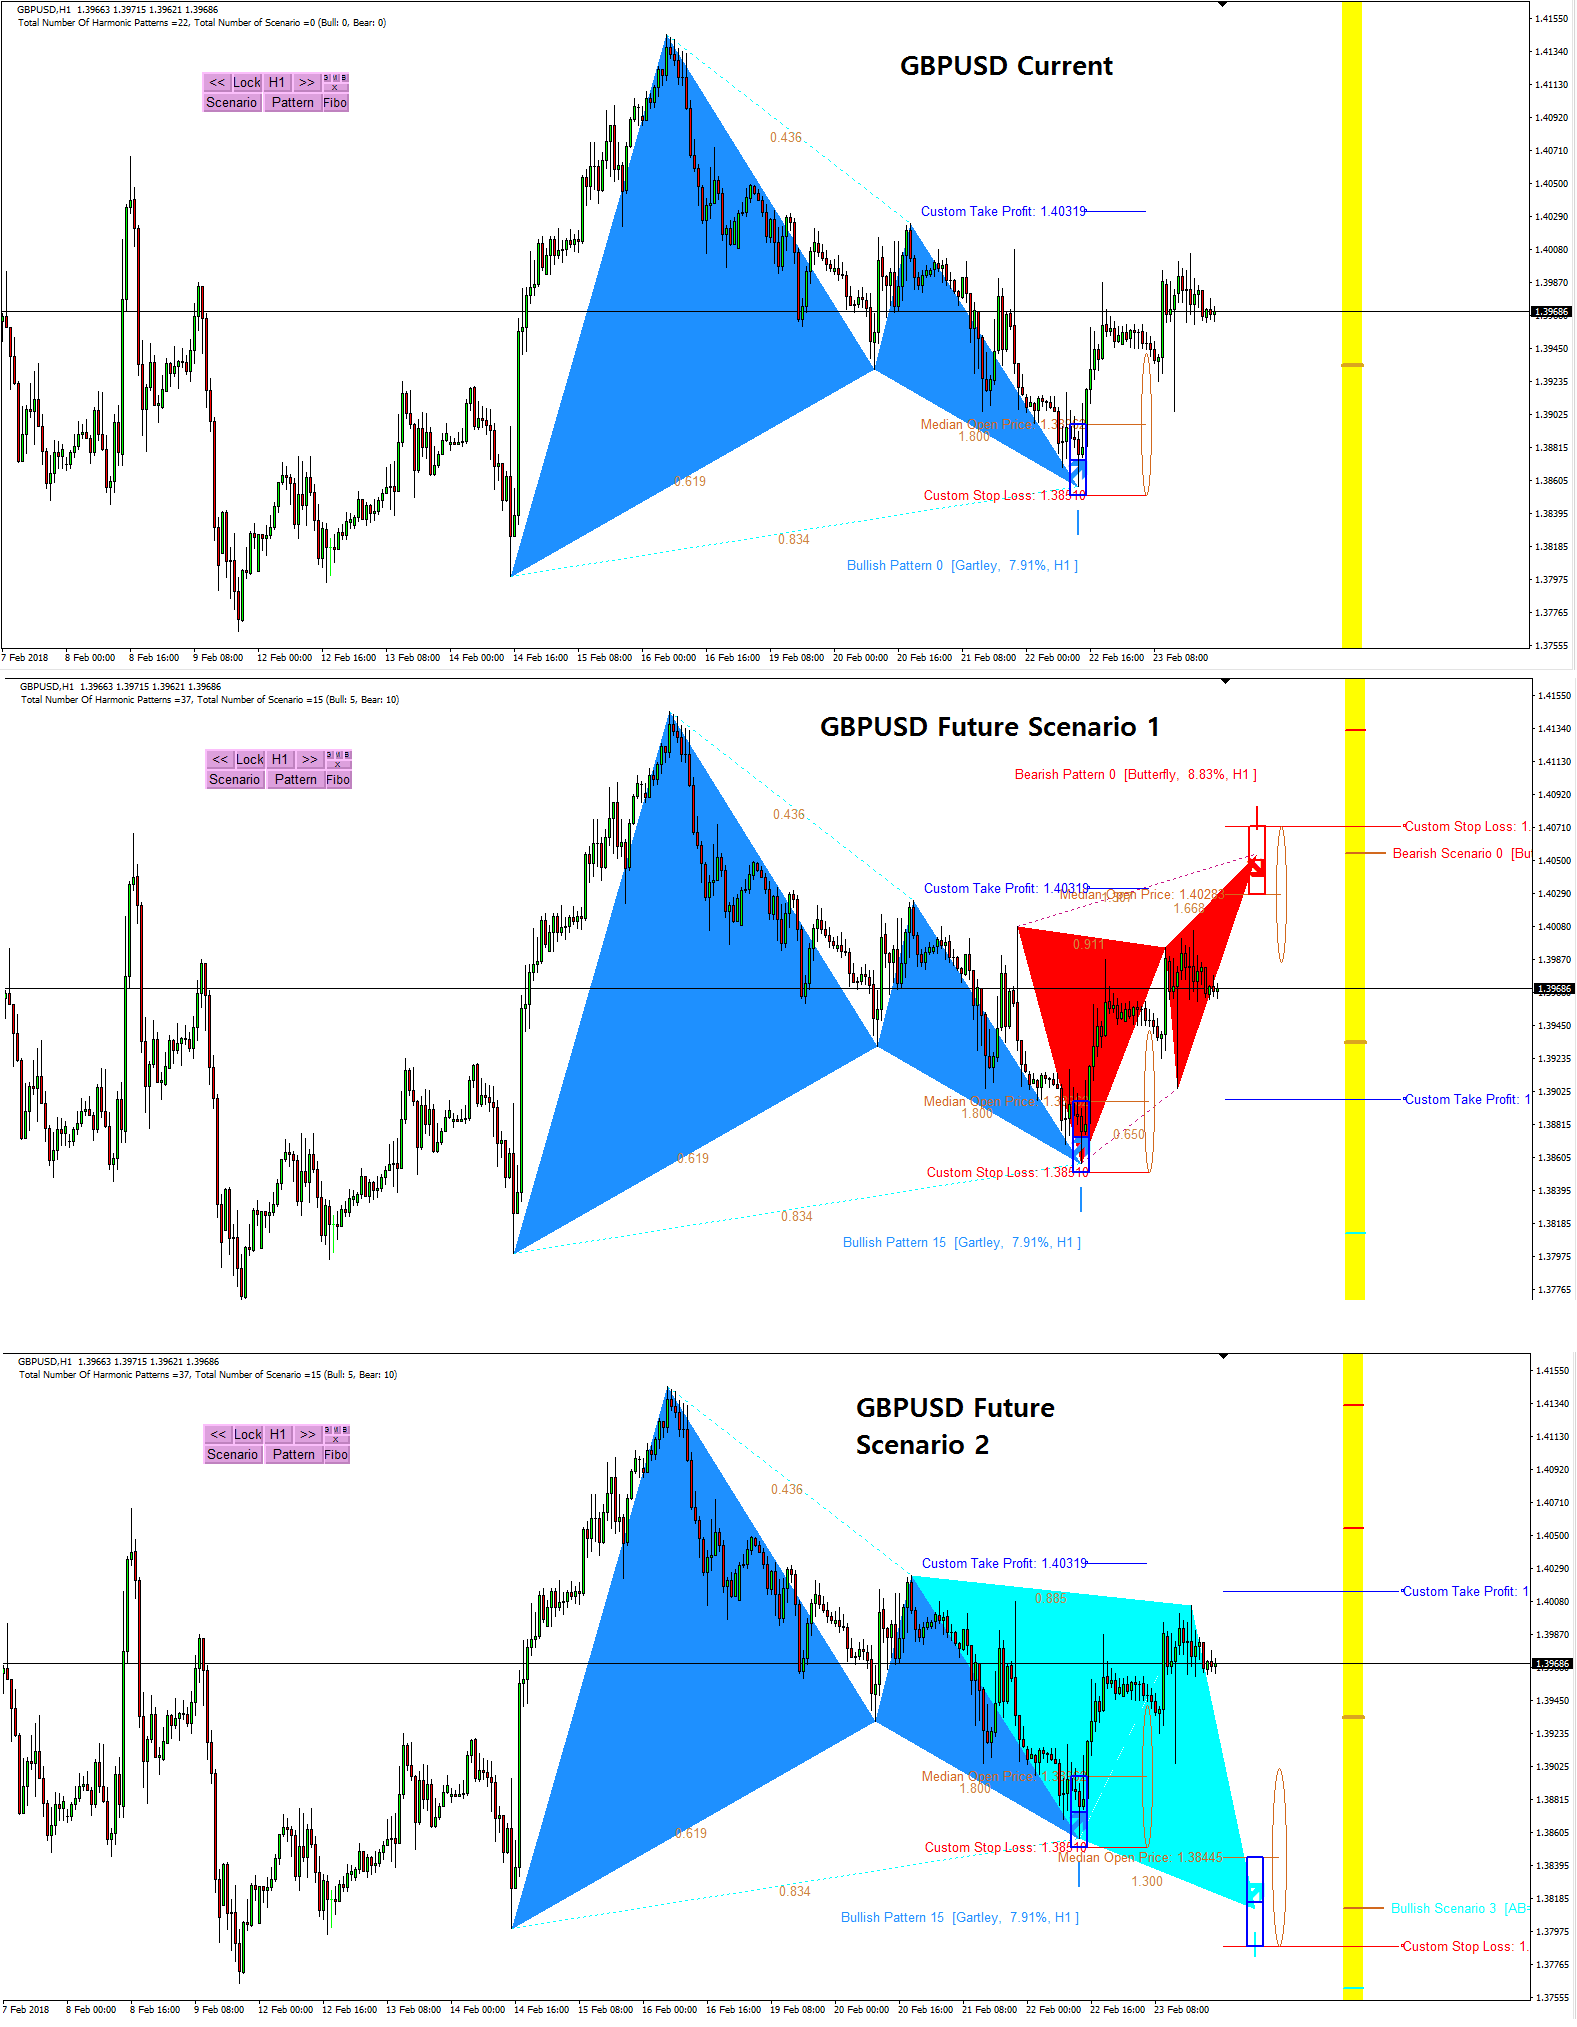
The present state of Forex market can go through many different possible price paths to reach its future destination. Future is dynamic. Therefore, planning your trade with possible future scenario is an important step for your success. To meet such a powerful concept, we introduce the Harmonic Pattern Scenario Planner, the first predictive Harmonic Pattern Tool in the world among its kind.
Main Features
Predicting future patterns for scenario analysis
11 Harmonic Pattern Detection
Automatic stop loss and take profit recognition for superb risk management
Pattern Completion Interval for precision trading
Potential Continuation Zone Detection for future price prediction
Potential Reversal Zone Detection for Point D identification
Automatic Channel Detection to go with Harmonic Pattern (Optional)
Multiple timeframe Pattern Analysis
Multiple timeframe Pattern Detection
Guided Trading Instruction for professional traders
Pattern Locking and Unlocking feature in your chart
Even more, please find it out.
Scenario Simulation for Future Harmonic Pattern
There are powerful simulation techniques known to generate possible future price patterns like Monte Carlos Simulation, Brownian motion simulation, etc. To do so, we need to understand the price behavior including distribution and its randomness. Then we repeat the simulation as many times as possible to identify various future price path. Some future price path may be very important for your trading whereas some other price path may be insignificant. Harmonic Pattern Scenario Planner collects those significant price paths only for your advance trading decision.
How to Use
You can run Harmonic Pattern Scenario Planner like Harmonic Pattern Plus to pick up the turning point. At the same time, you can predict the future patterns for the advanced scenario analysis. The predicted pattern can be used for the earlier decision making for your trading.
Reduce commission and slippage using pending orders in advance
Worst case scenario planning before taking position
Early identification of important support and resistance lines automatically in advance
More accurate prediction of entry and exit timing
How to Trade
Each Harmonic Pattern provides you the potential entry for the turning point. You might apply few other filters to improve your trading. Some of the basic filters you can apply include RSI, CCI, MACD, Bollinger Bands, and Moving Average. More advanced filter can include Price Breakout Pattern Scanner, Mean Reversion Supply Demand, Elliott Wave Trend, and Harmonic Volatility Indicator. Please note that the trading performance can vary for your trading experience and trading skills.
Indicator Input
Here we list part of input setting. For full input setting, visit this webpage:
https://algotrading-investment.com/2018/10/25/short-guideline-for-harmonic-pattern-plus-and-harmonic-pattern-scenario-planner/
Harmonic Pattern Parameters 1 ( User Option ) ===========================
These parameters below concerns operations of Harmonic patterns. You can change button size, timeframe to detect patterns and alerts using these parameters. You can change timeframe of pattern detection. However, you cannot use smaller timeframe pattern detection for higher timeframe. For example, you cannot set Timeframe to detect patterns = H1 timeframe while you are using D1 chart.
Timeframe to detect Patterns
Max number of patterns to display
Pattern Index from which to display
Enable sound alert
Send email if pattern is found
Send notification if pattern is found
Display Fibo retracement (DC Future Price Projection)
Fibo Retracement Length
Fibo Retracement Color for pattern
Fibo Retracment Wdith for pattern
Use white background for chart
Amount of bars to scan for pattern search (1500 = default)
Detect Pattern at Every Tick: true or false only
Pattern Update Frequency (Period)
http://algotrading-investment.com/portfolio-item/harmonic-pattern-scenario-planner/
https://www.mql5.com/en/market/product/6101
https://www.mql5.com/en/market/product/6240

Young Ho Seo
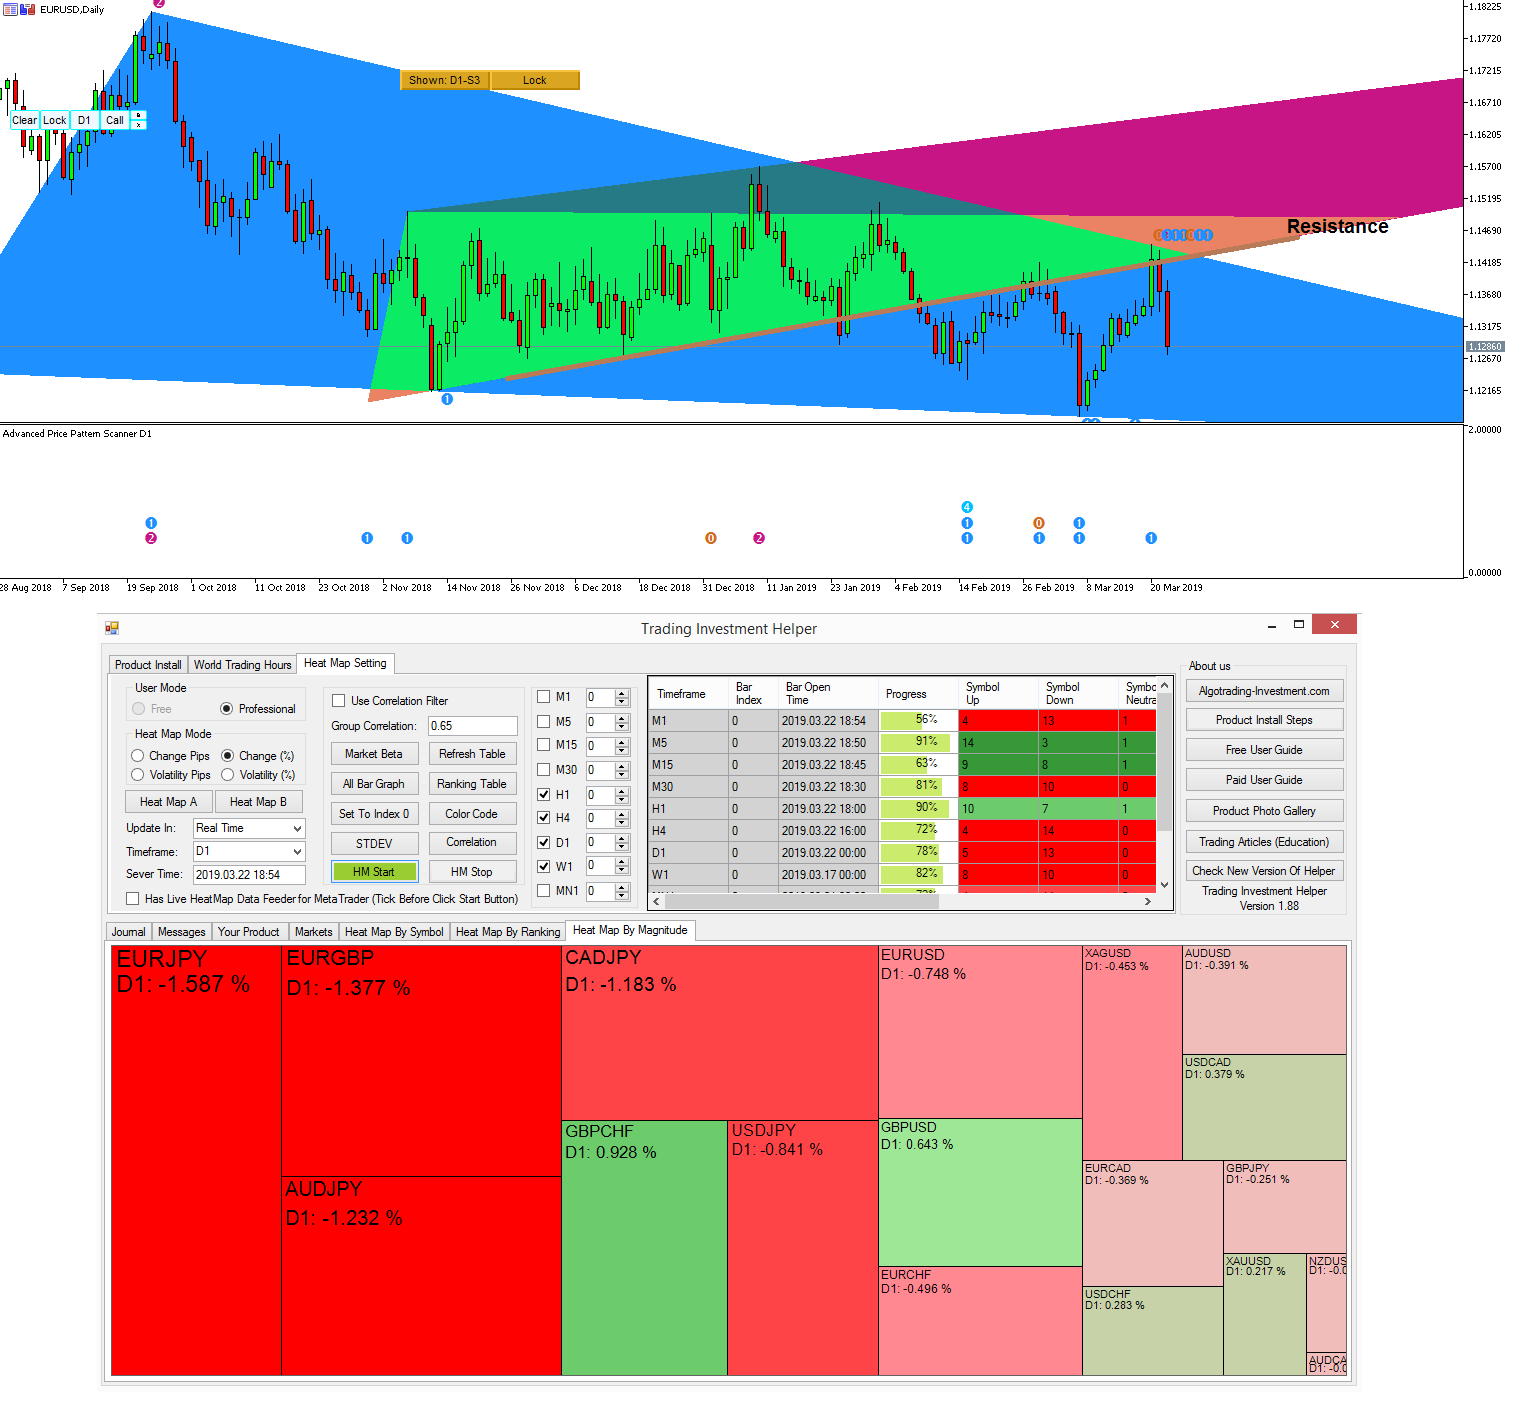
EURUSD Market Outlook-22 March 2019
EURUSD is falling for another day. As we have mentioned, EURUSD hit the critical resistance level at mid term. Even more, overall market is bearish too.
https://algotrading-investment.com/
https://www.mql5.com/en/users/financeengineer/seller#products
EURUSD is falling for another day. As we have mentioned, EURUSD hit the critical resistance level at mid term. Even more, overall market is bearish too.
https://algotrading-investment.com/
https://www.mql5.com/en/users/financeengineer/seller#products

Young Ho Seo
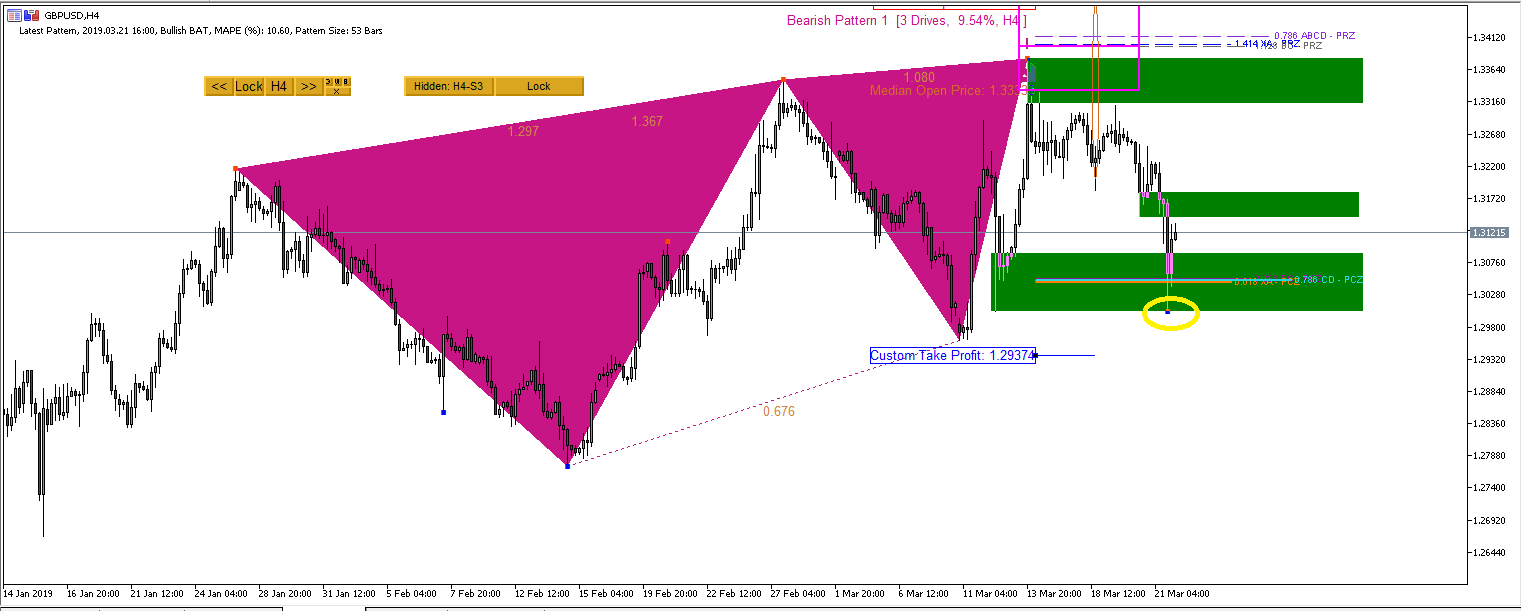
GBPUSD Market Outlook-22 March 2019
So we were watching GBPUSD with care since it seems that it is the center of market volatility. Today, GBPUSD hit the right bottom of the demand zone we have counted in our previous post and it went back quickly for the correction. The move was big and fast nearly 200 pips.
http://algotrading-investment.com/portfolio-item/harmonic-pattern-plus/
https://www.mql5.com/en/market/product/4488
https://www.mql5.com/en/market/product/4475

Young Ho Seo
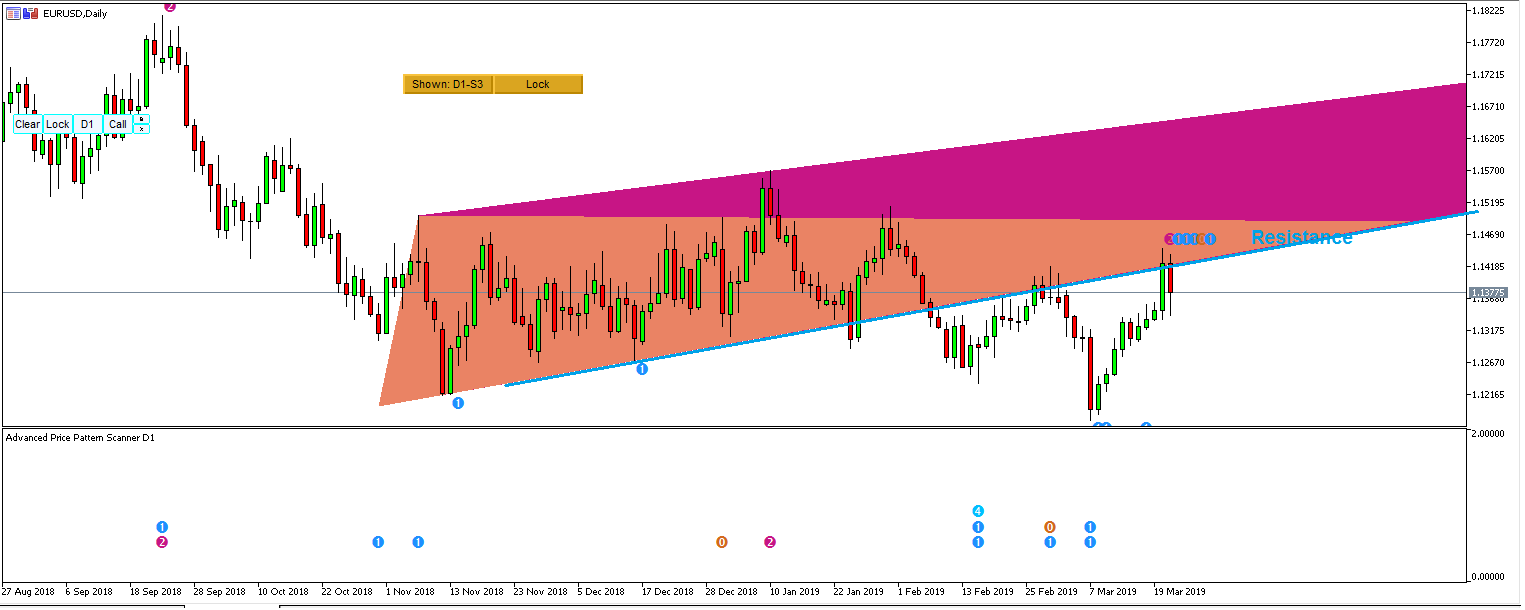
EURUSD Market Outlook-21 March 2019
EURUSD is ended with a bearish fall about 50 pips. Here is what happened on EURUSD. The presence of wedge and triangle forms a strong resistance for EURUSD. In fact, EURUSD tested the resistance today but it was rejected.
https://algotrading-investment.com/portfolio-item/advanced-price-pattern-scanner/
https://www.mql5.com/en/market/product/24679
https://www.mql5.com/en/market/product/24678

Young Ho Seo
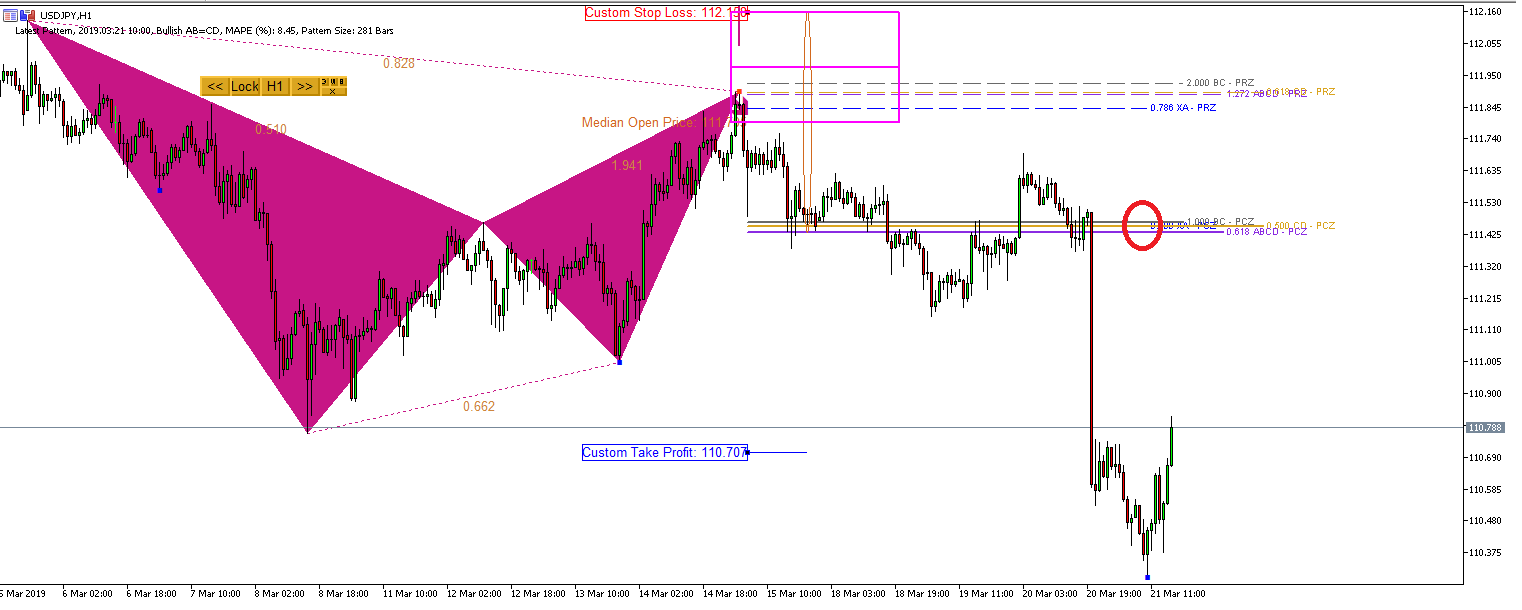
USDJPY Market Outlook-21 March 2019
As we have mentioned in our previous USDJPY post, USDJPY maintained the bearish position last few days. Hope you got some quick profit here.
http://algotrading-investment.com/portfolio-item/harmonic-pattern-plus/
https://www.mql5.com/en/market/product/4488
https://www.mql5.com/en/market/product/4475

Young Ho Seo
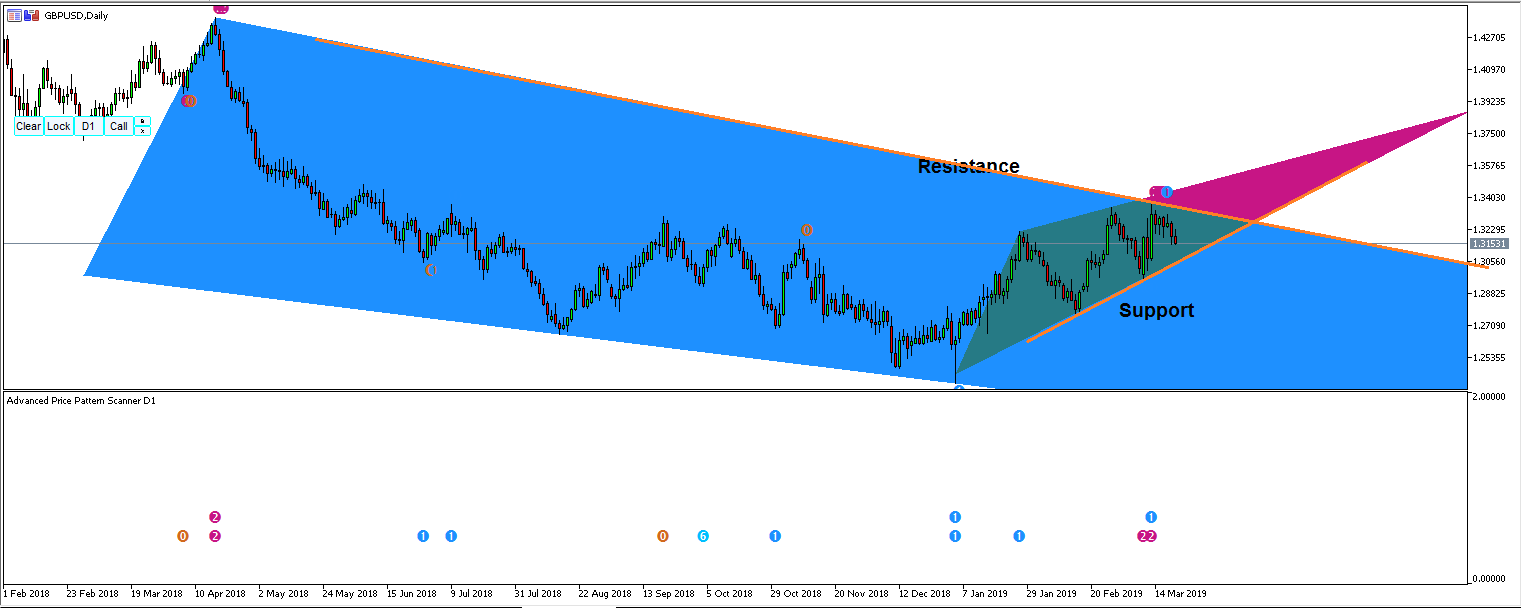
GBPUSD Market Outlook - 21 March 2019
Yesterday and Today GBUSD was falling nearly 100 pips. As we have mentioned, GBPUSD are pretty bearish this week. For long market view, probably this is good description of what GBPUSD is at the moment.
https://algotrading-investment.com/
https://www.mql5.com/en/users/financeengineer/seller#products

Young Ho Seo
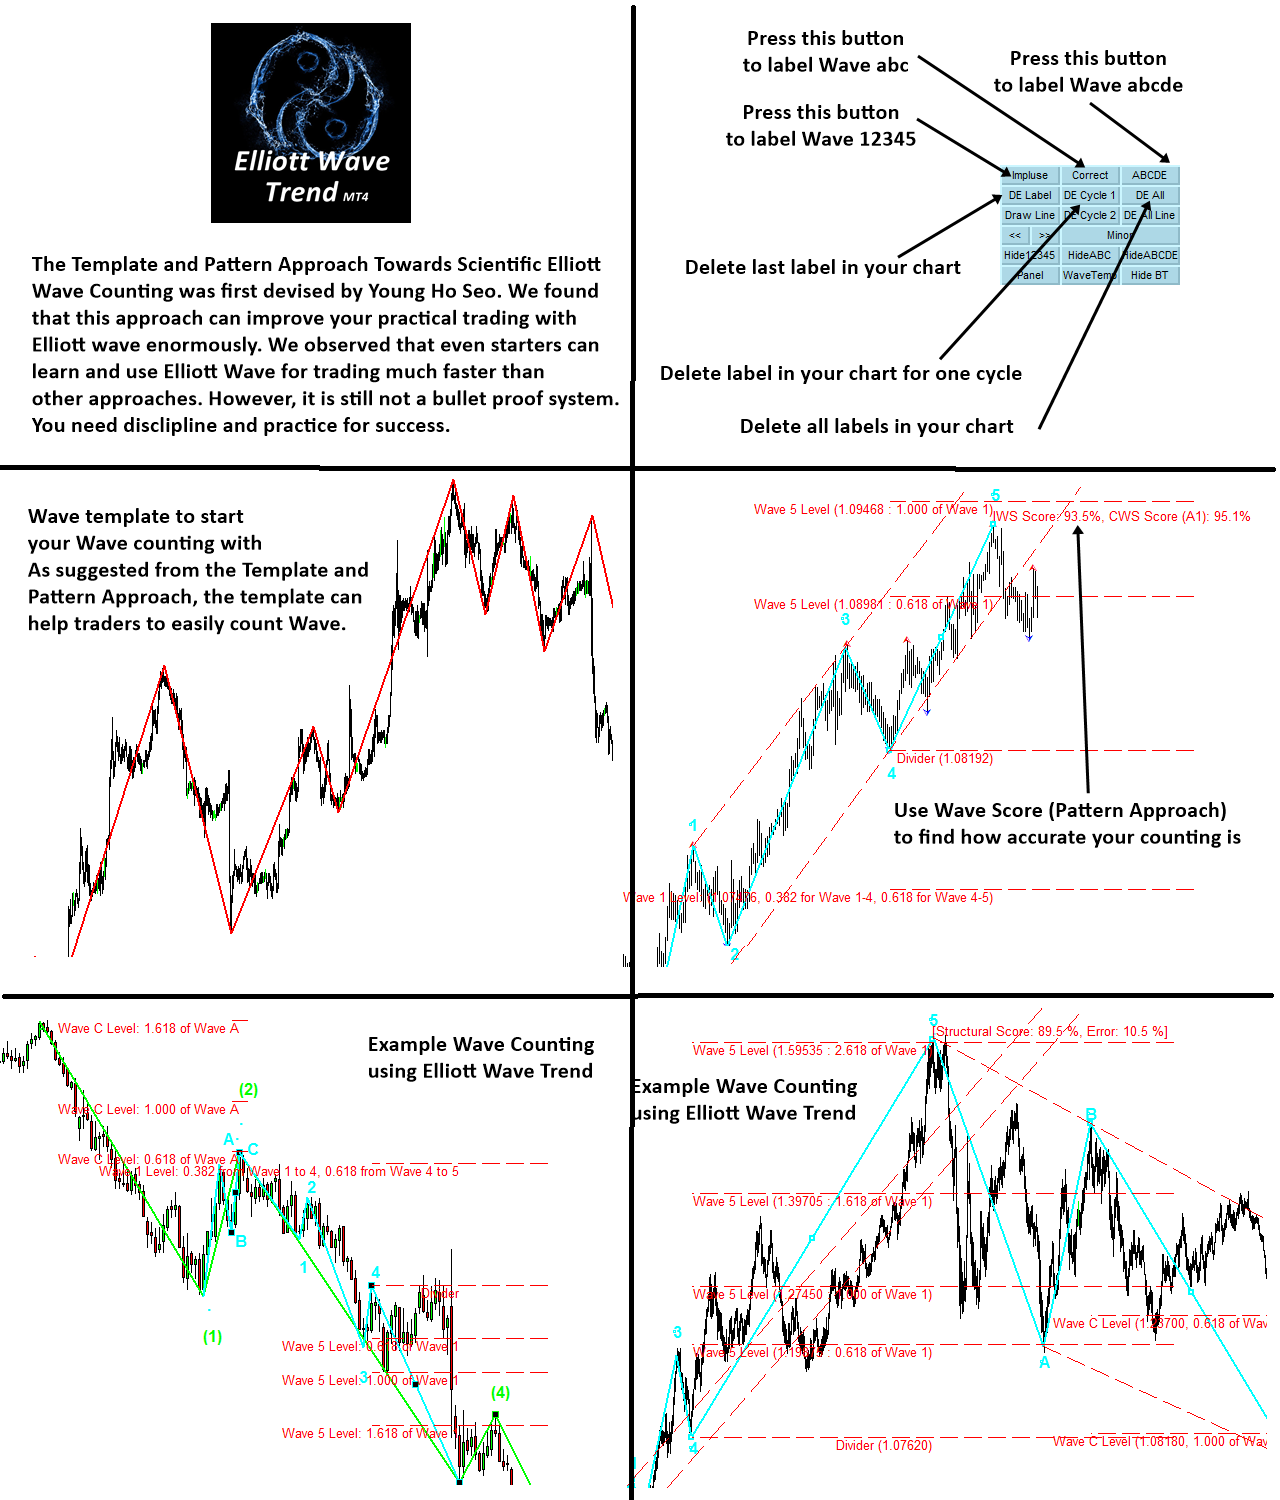
Most advanced Elliott Wave Software for your Trading
Elliott Wave Trend is the most advanced Elliott Wave Trading software, whith capability to scan Wave .12345 pattern and Wave .ABC and Wave .ABCDE. Elliott Wave Trend was built on the concept of Precision Trading with Elliott Wave Structure Score. Our Elliott Wave Trend is professional tool for professional trader. Yet, the price of it is affordable.
With Elliott Wave Trend, you can also share your analysis with your Friend and clients through Elliott Wave Reader.
Our Elliott Wave Trend is available in both MetaTrader 4 and MetaTrader 5 version.
https://algotrading-investment.com/2018/10/25/how-elliott-wave-can-improve-your-trading-performance/
Link to Elliott Wave Trend.
http://algotrading-investment.com/portfolio-item/elliott-wave-trend/
https://www.mql5.com/en/market/product/16472
https://www.mql5.com/en/market/product/16479

Young Ho Seo
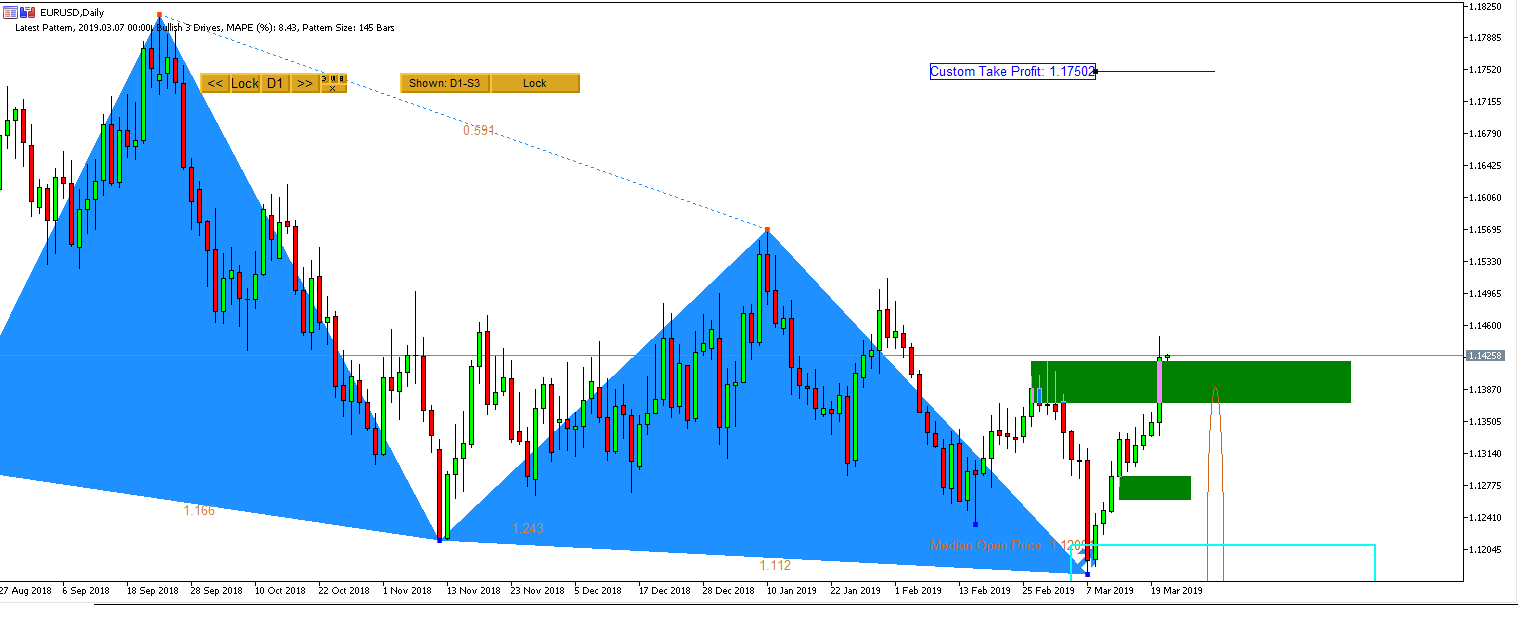
EURUSD Market Outlook - 20 March 2019
EURUSD generated 100 pips for bullish trader.
https://algotrading-investment.com
https://www.mql5.com/en/users/financeengineer/seller#products
EURUSD generated 100 pips for bullish trader.
https://algotrading-investment.com
https://www.mql5.com/en/users/financeengineer/seller#products

Young Ho Seo
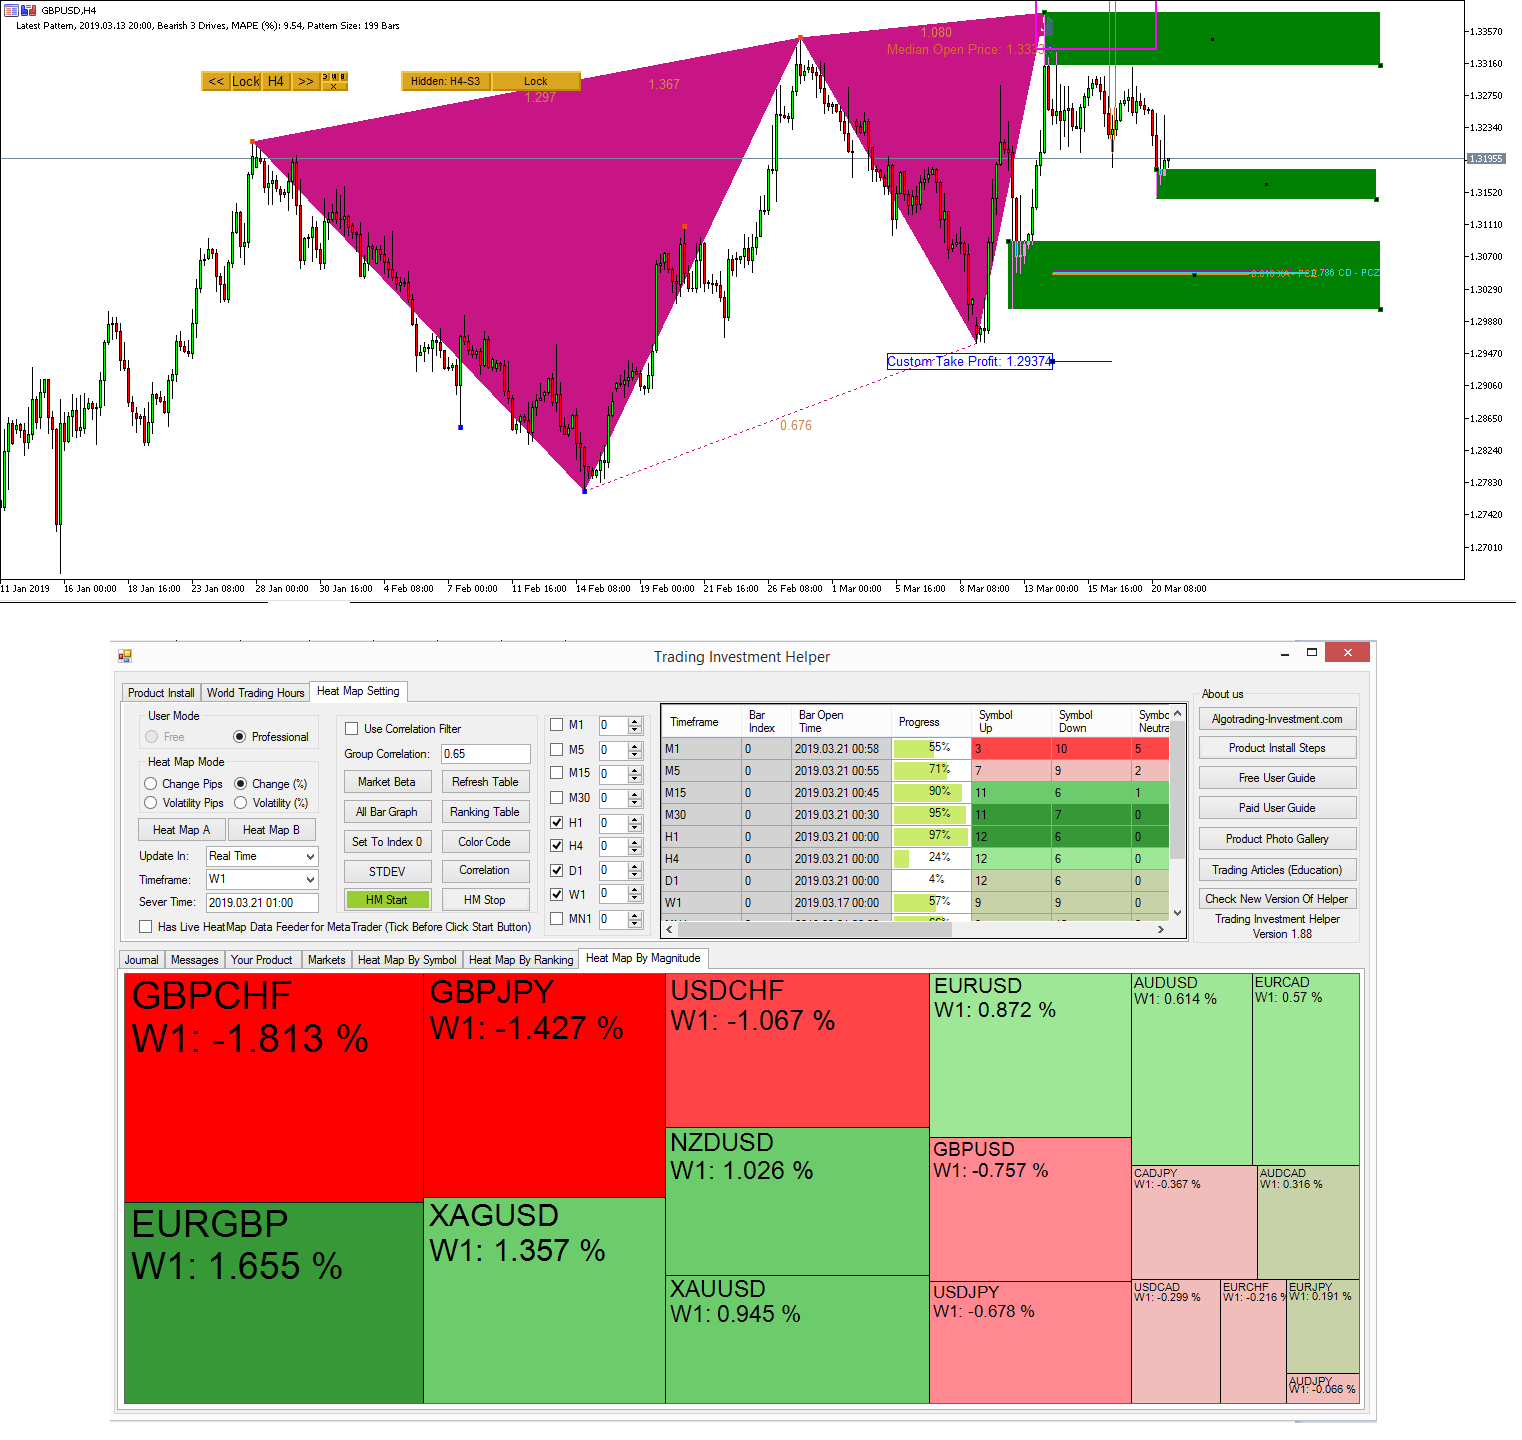
GBPUSD Market Outlook-20 March 2019
This week GBPUSD seems the driver of the market. GBP (British Pound) is moving with its own agenda generating the most of volatility. Bearish sentiment is stronger with GBPUSD and other GBP symbols. I have marked some important supply demand zone in chart for your trading.
https://algotrading-investment.com
https://www.mql5.com/en/users/financeengineer/seller#products

Young Ho Seo
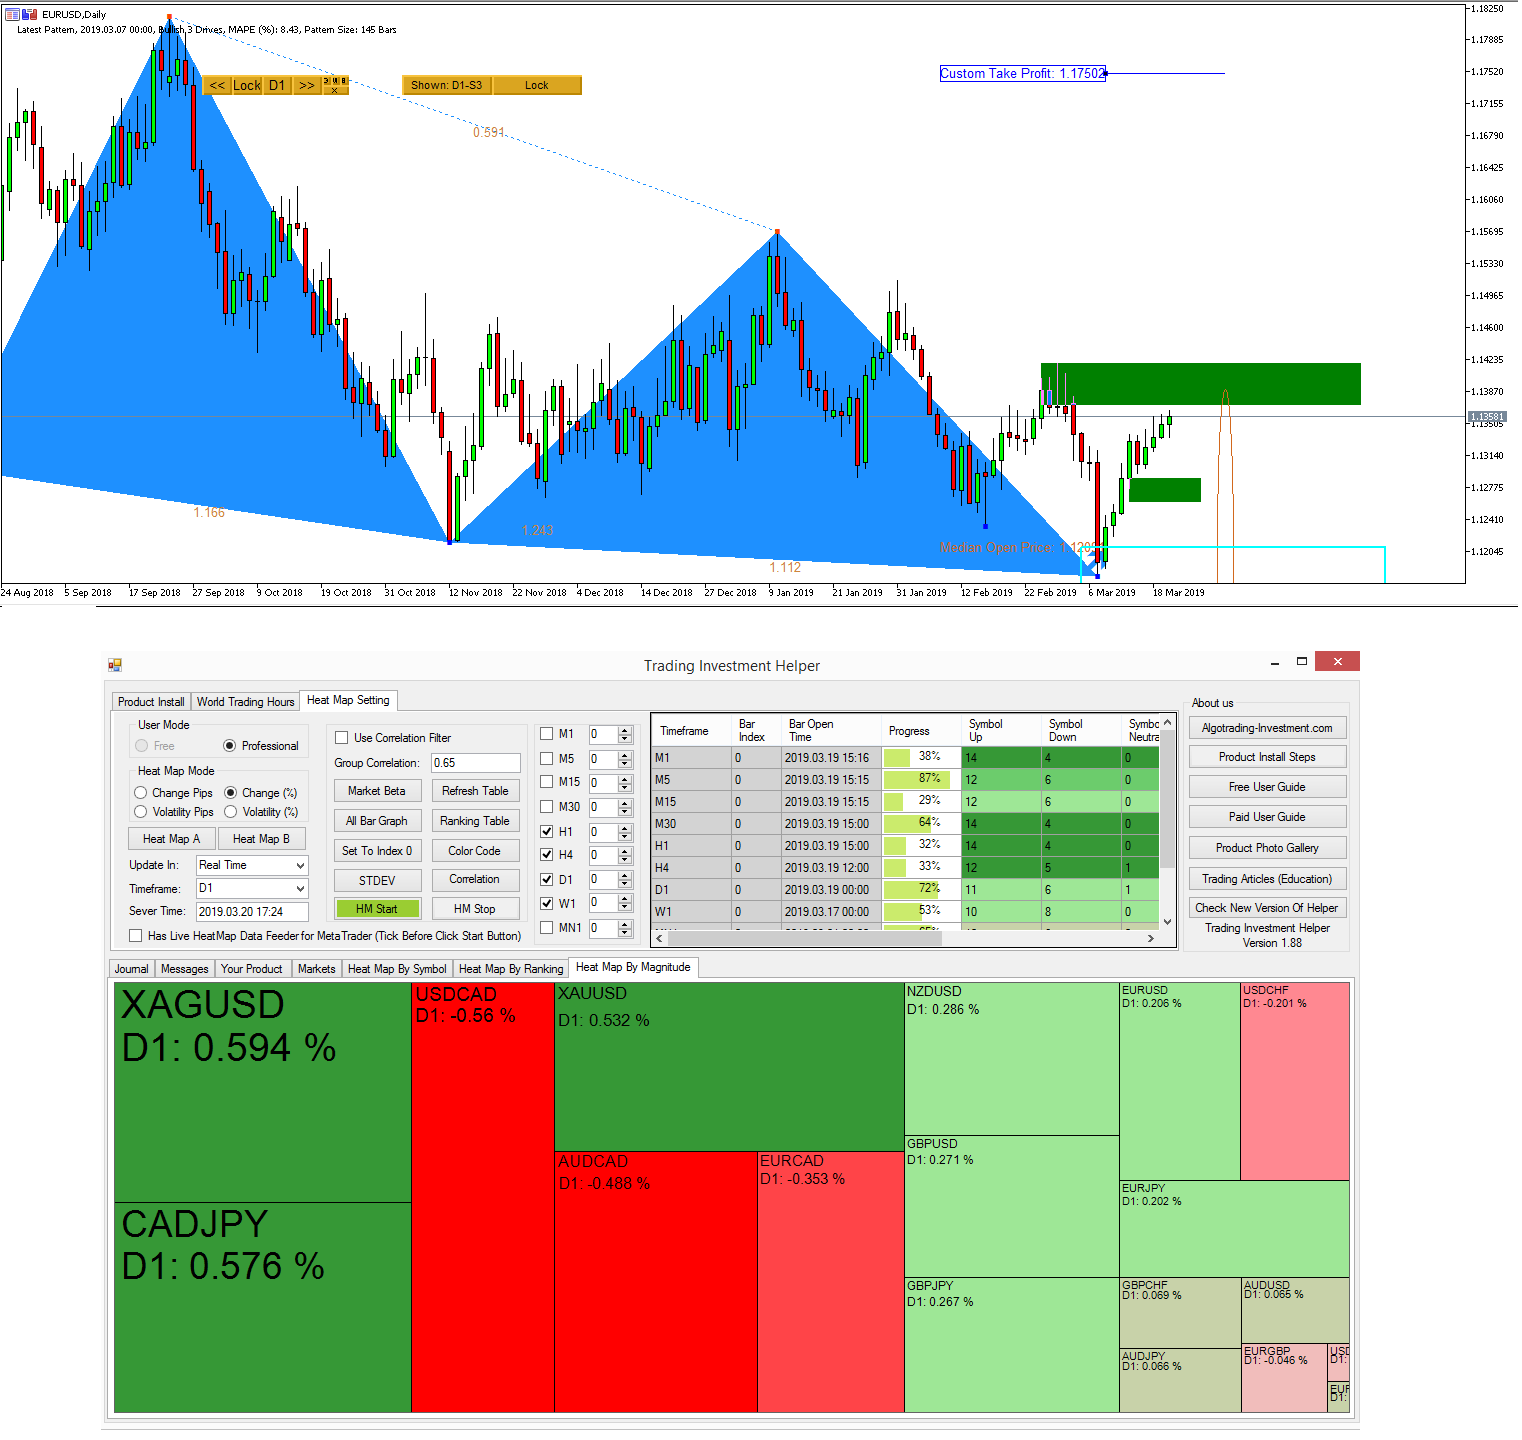
EURUSD Market Outlook-20 March 2019
Market is slight more favored towards bull. CAD seems to be most bullish symbol at the moment. EURUSD is moderate bullish still. It is very slow and approaching to the supply zone as close as 5 pips now.
Analysis was generated from Harmonic pattern plus.
http://algotrading-investment.com/portfolio-item/harmonic-pattern-plus/
https://www.mql5.com/en/market/product/4488
https://www.mql5.com/en/market/product/4475

Young Ho Seo
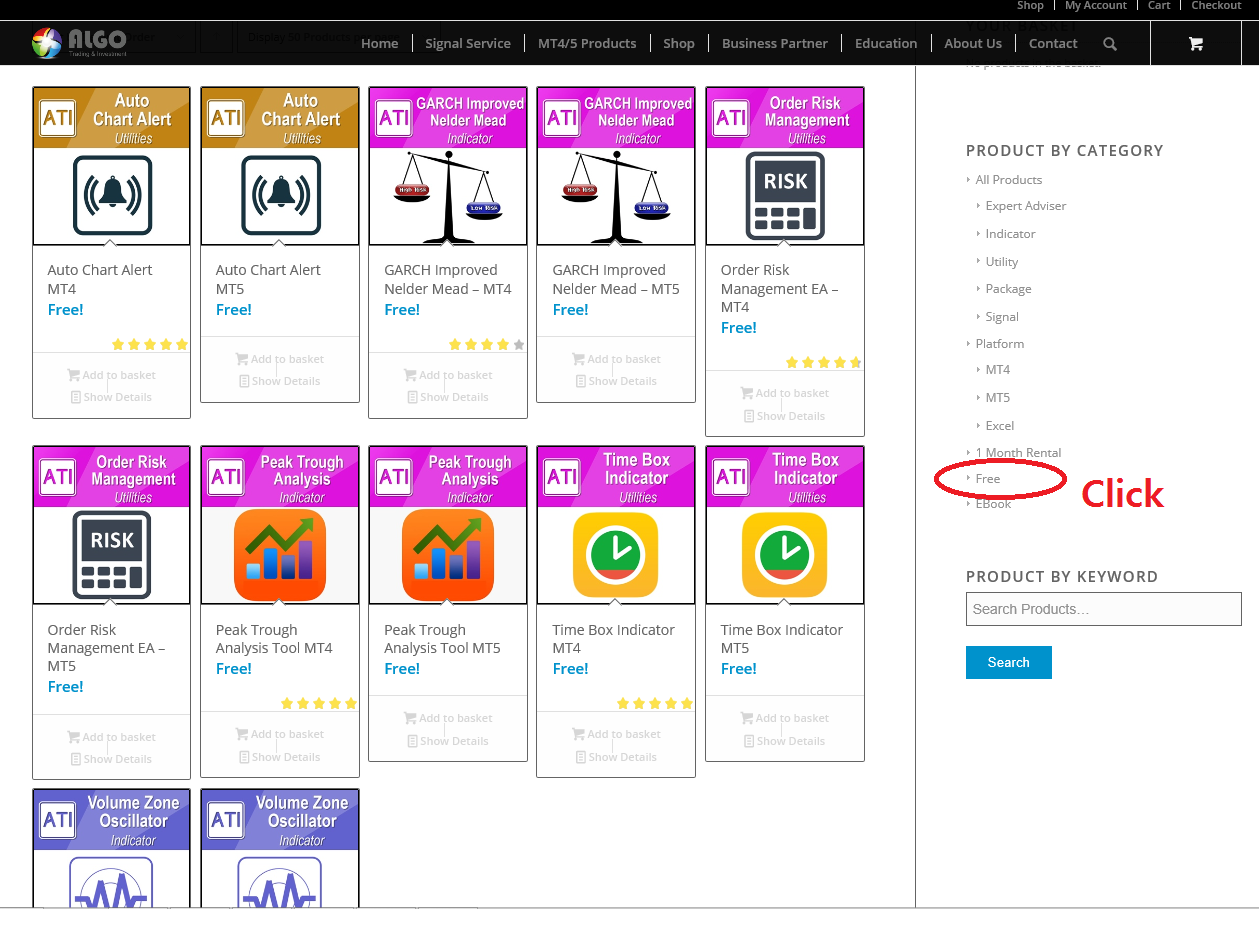
Free tools for your trading and investment.
Do not forget that we have lots of free tools for your trading and investment. Free is really free, so enjoy them.
http://algotrading-investment.com/product-category/free/
https://www.mql5.com/en/users/financeengineer/seller#products
Also you can access to our free articles and manuals in this link below:
http://algotrading-investment.com/price-action-and-pattern-trading-articles/

Young Ho Seo
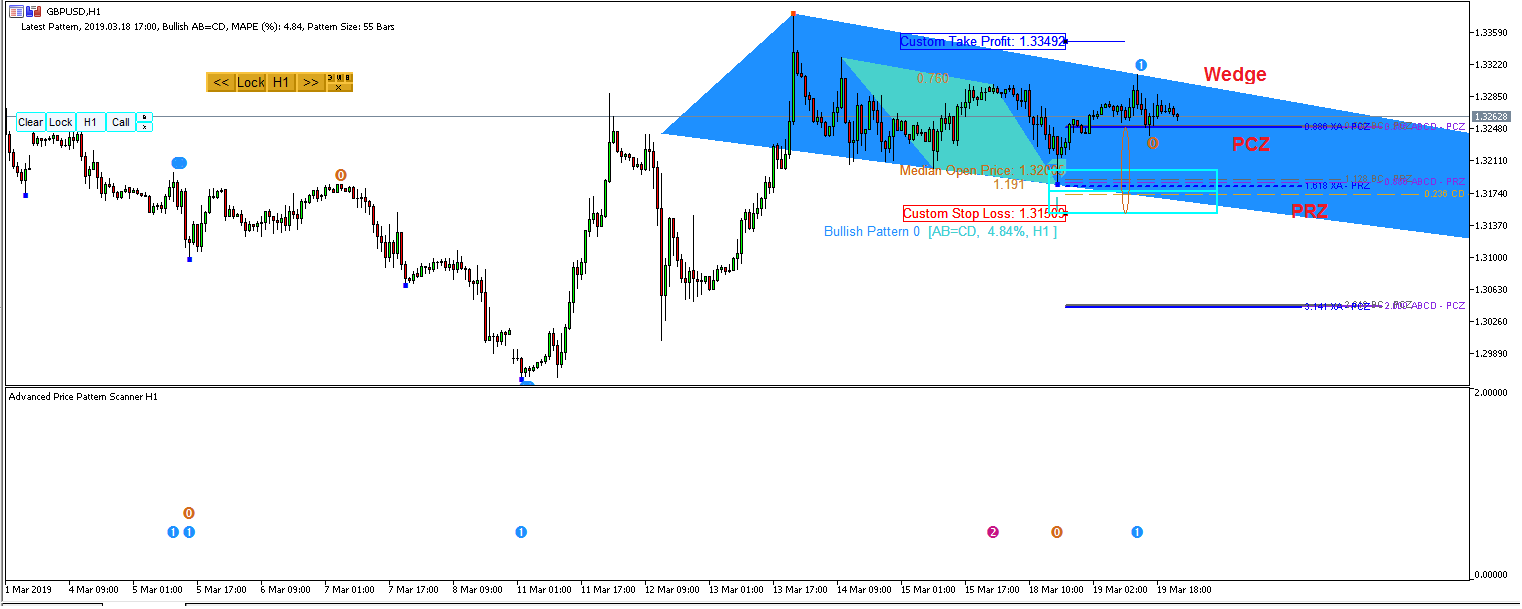
GBPUSD Market Outlook - 19 March 2019
Here is the some important levels for GBPUSD for your trading generated from Advanced Price Pattern Scanner + Harmonic Pattern Plus. This is the continuation of the triangle patterns we have shown in our previous post.
https://algotrading-investment.com/portfolio-item/advanced-price-pattern-scanner/
https://www.mql5.com/en/market/product/24679
https://www.mql5.com/en/market/product/24678

Young Ho Seo
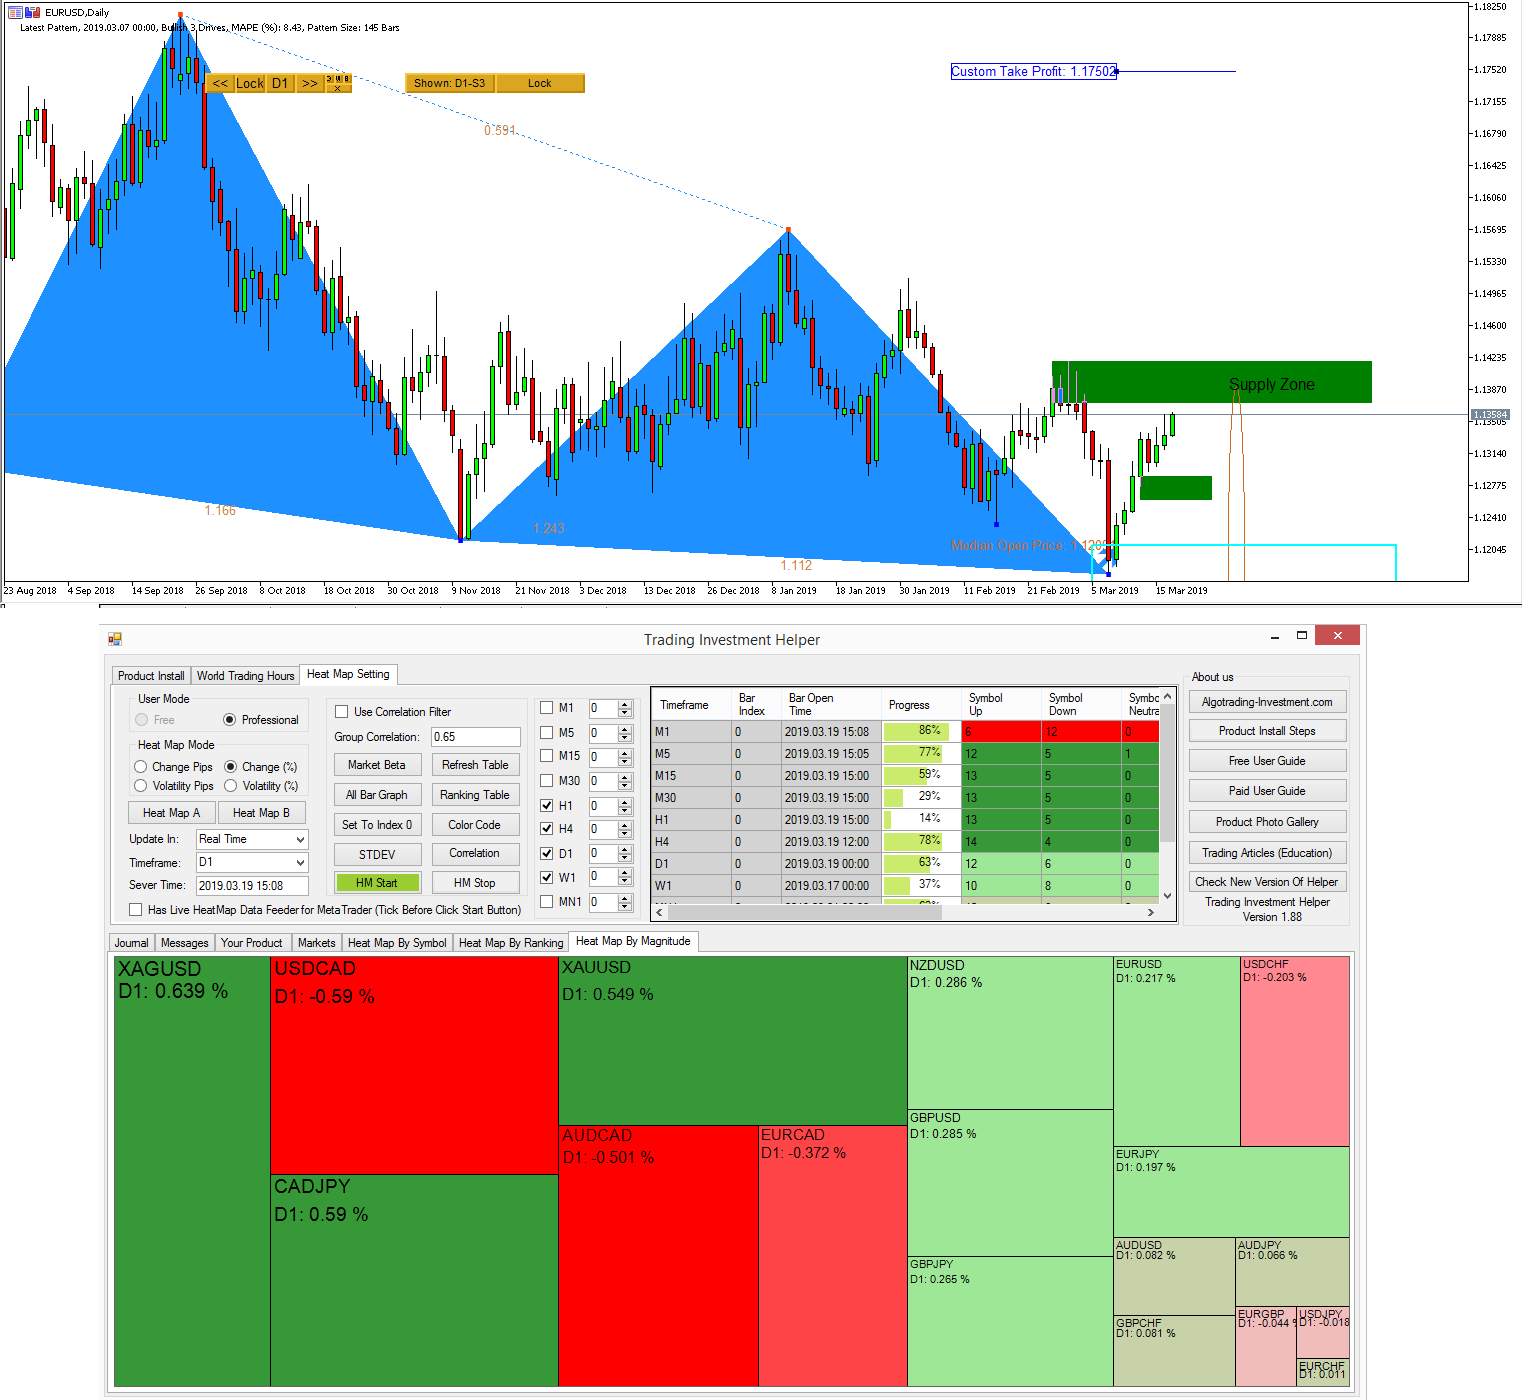
EURUSD Market Outlook-19 March 2019
Overall market is bullish. EURUSD is taking the moderate journey towards the supply zone. It is now just 10 pips away from the zone.
https://algotrading-investment.com
https://www.mql5.com/en/users/financeengineer/seller#products
Overall market is bullish. EURUSD is taking the moderate journey towards the supply zone. It is now just 10 pips away from the zone.
https://algotrading-investment.com
https://www.mql5.com/en/users/financeengineer/seller#products

Young Ho Seo

Most advanced Elliott Wave Software for your Trading
Elliott Wave Trend is the most advanced Elliott Wave Trading software, whith capability to scan Wave .12345 pattern and Wave .ABC and Wave .ABCDE. Elliott Wave Trend was built on the concept of Precision Trading with Elliott Wave Structure Score. Our Elliott Wave Trend is professional tool for professional trader. Yet, the price of it is affordable.
With Elliott Wave Trend, you can also share your analysis with your Friend and clients through Elliott Wave Reader.
Our Elliott Wave Trend is available in both MetaTrader 4 and MetaTrader 5 version.
https://algotrading-investment.com/2018/10/25/how-elliott-wave-can-improve-your-trading-performance/
Link to Elliott Wave Trend.
http://algotrading-investment.com/portfolio-item/elliott-wave-trend/
https://www.mql5.com/en/market/product/16472
https://www.mql5.com/en/market/product/16479
Elliott Wave Trend is the most advanced Elliott Wave Trading software, whith capability to scan Wave .12345 pattern and Wave .ABC and Wave .ABCDE. Elliott Wave Trend was built on the concept of Precision Trading with Elliott Wave Structure Score. Our Elliott Wave Trend is professional tool for professional trader. Yet, the price of it is affordable.
With Elliott Wave Trend, you can also share your analysis with your Friend and clients through Elliott Wave Reader.
Our Elliott Wave Trend is available in both MetaTrader 4 and MetaTrader 5 version.
https://algotrading-investment.com/2018/10/25/how-elliott-wave-can-improve-your-trading-performance/
Link to Elliott Wave Trend.
http://algotrading-investment.com/portfolio-item/elliott-wave-trend/
https://www.mql5.com/en/market/product/16472
https://www.mql5.com/en/market/product/16479

Young Ho Seo
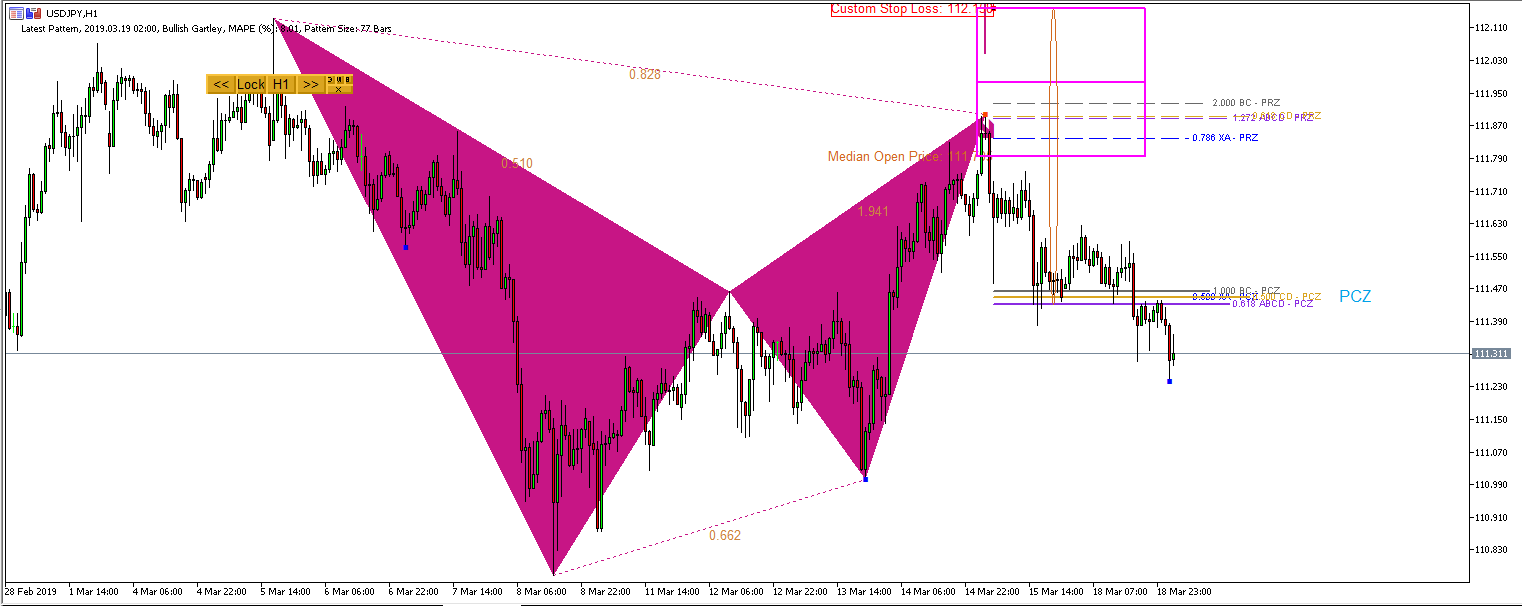
USDJPY Market Outlook-18 March 2019
USDJPY was pretty bearish since the formation of BAT pattern. Few hours ago, USDJPY tested the Potential Continuation Zone but without success.
https://algotrading-investment.com
https://www.mql5.com/en/users/financeengineer/seller#products
USDJPY was pretty bearish since the formation of BAT pattern. Few hours ago, USDJPY tested the Potential Continuation Zone but without success.
https://algotrading-investment.com
https://www.mql5.com/en/users/financeengineer/seller#products

Young Ho Seo
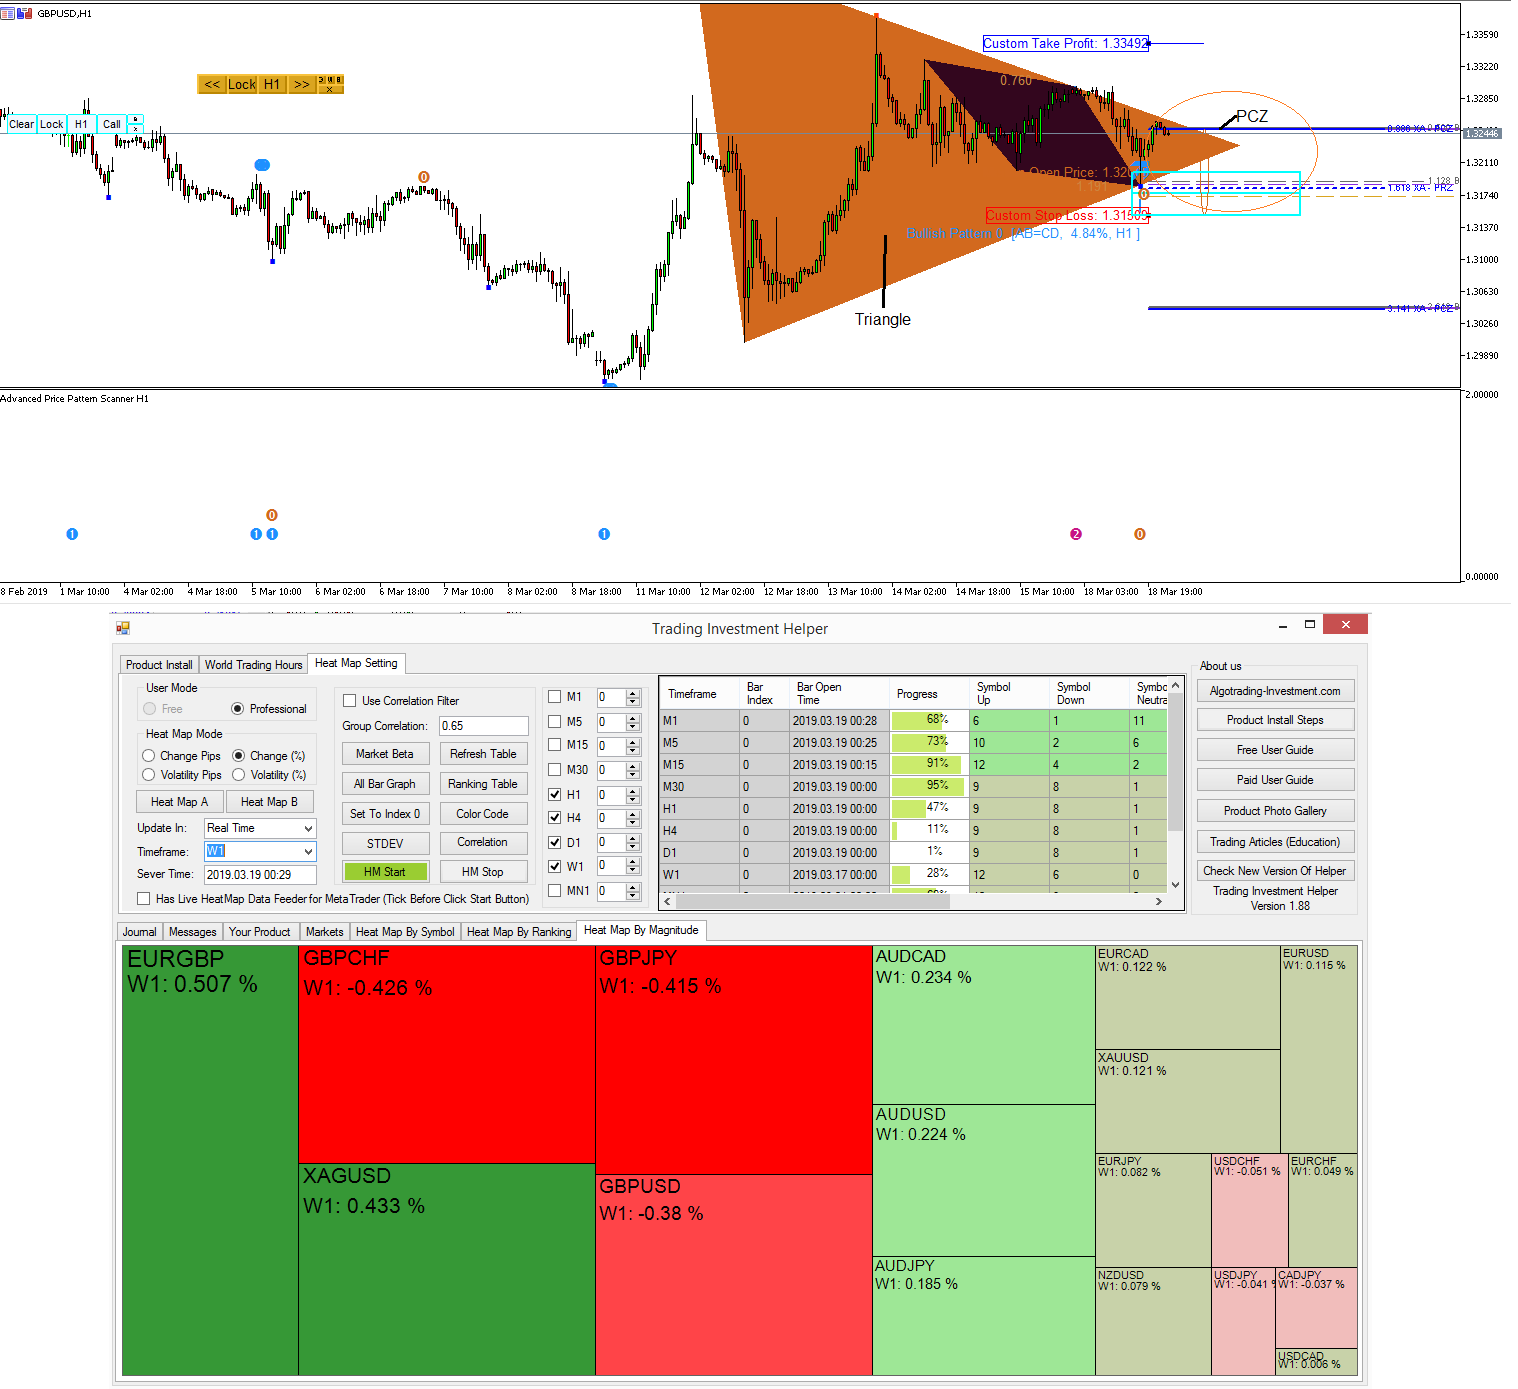
GBPUSD Market Outlook-18 March 2019
Market ended generally bull but Pound (GBP) was pretty week against other currency pairs. Last few hours, GBPUSD was in fact taking some bullish correction with formation of AB=CD pattern. Now we might wandering why the bullish moment was not kept. It is because we have triangle pattern and PCZ confluence.
https://algotrading-investment.com/
https://www.mql5.com/en/users/financeengineer/seller#products

Young Ho Seo
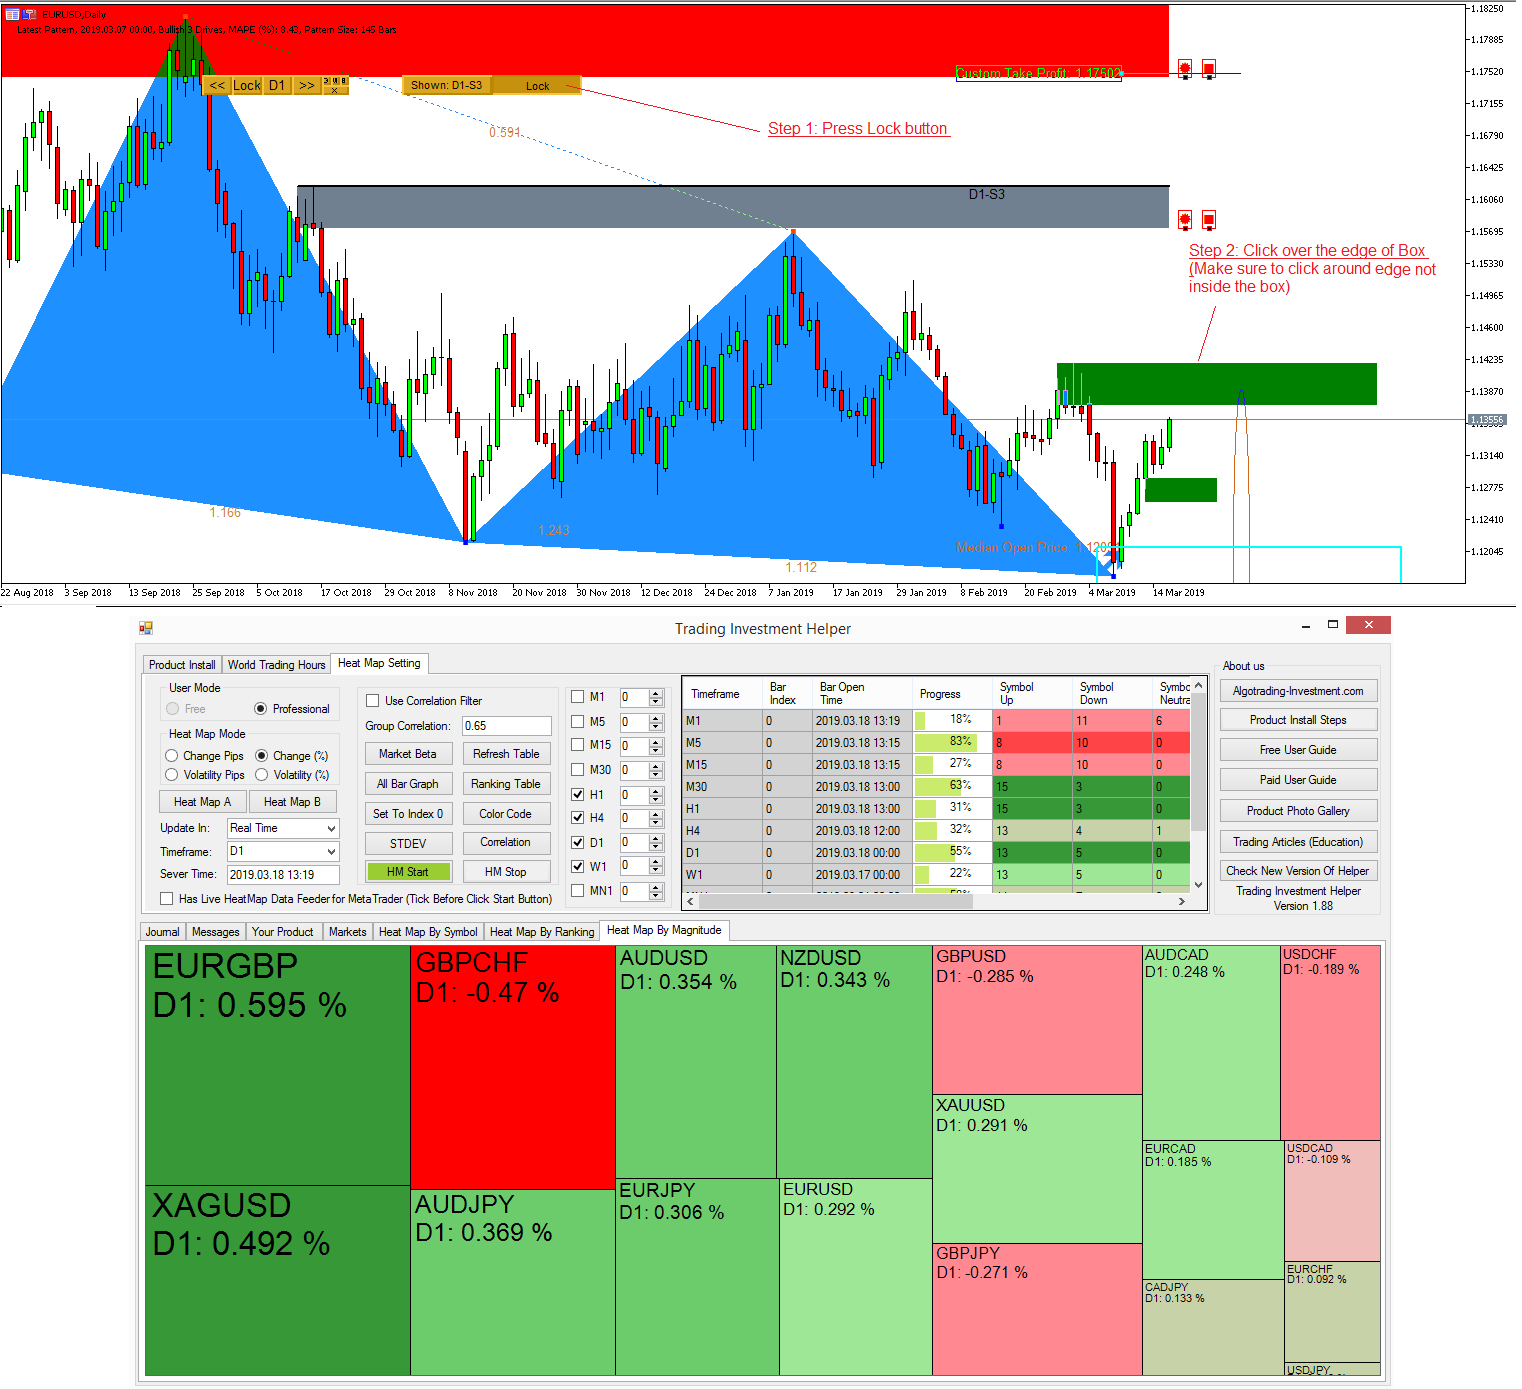
EURUSD Market Outlook-18 March 2019
Bullish sentiment is little stronger than bearish sentiment in the market. As we have mentioned, EURUSD is approaching to test the supply zone. For your information, I have locked this supply zone in my chart. To do so, just follow the two step process in Mean Reversion Supply Demand.
1) Press Lock button
2) Click around the edge of the supply or demand zone you want to lock.
That is it. This will turn your demand or supply zone to green locked zone for your future reference.
https://algotrading-investment.com/
https://www.mql5.com/en/users/financeengineer/seller#products

: