Vasiliy Sokolov / Profile
- Information
|
11+ years
experience
|
17
products
|
602
demo versions
|
|
5
jobs
|
0
signals
|
0
subscribers
|
The article describes the way to create a custom strategy tester and a custom analyzer of the optimization passes. After reading it, you will understand how the math calculations mode and the mechanism of so-called frames work, how to prepare and load custom data for calculations and use effective algorithms for their compression. This article will also be interesting to those interested in ways of storing custom information within an expert.
This article describes the construction of the custom optimization criterion R-squared. This criterion can be used to estimate the quality of a strategy's balance curve and to select the most smoothly growing and stable strategies. The work discusses the principles of its construction and statistical methods used in estimation of properties and quality of this metric.
Call/Put Ratio is one of the most well-known indicators of the market sentiment. The indicator has been developed by Martin Zweig. It is based on real volumes of the CBOE option market. As we know, a Call option gives its owner the right to buy the underlying asset at a predetermined price. A Put option gives the right to sell it. Thus, increasing volumes for Call options indicate the increasing demand. The growth of Put option volumes shows that supply starts exceeding demand. If we divide the
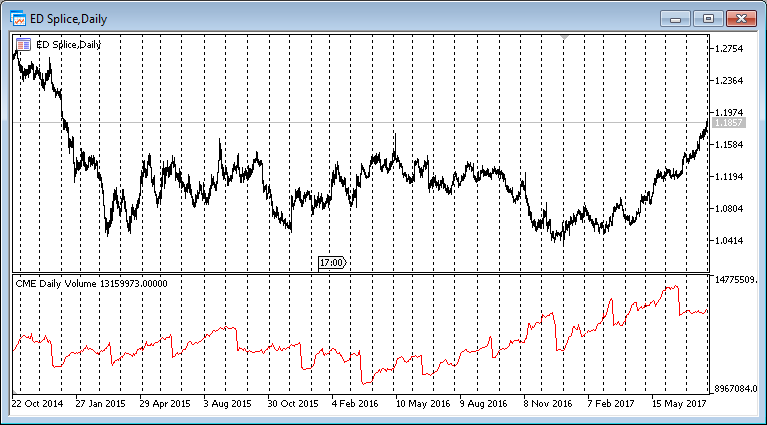
CME Daily Bullettin Open Interest provides the data on the open interest of futures contracts on the CME for your charts. Open interest is a special type of volume, that shows how many contracts are being held by the market participants at each moment of time. This type of information is available only in futures markets. But now, with this indicator, you can also analyze these data when trading the spot markets, such as FOREX. In addition, the indicator provides data on the open interest for
Full list of supported finance instruments of CME Daily Bulletin
The article describes the work with indicators through the universal CUnIndicator class. In addition, new methods of working with pending orders are considered. Please note: from this point on, the structure of the CStrategy project has undergone substantial changes. Now all its files are located in a single directory for the convenience of users.
In this article, we will create the basic functionality of a scalping Market Depth tool. Also, we will develop a tick chart based on the CGraphic library and integrate it with the order book. Using the described Market Depth, it will be possible to create a powerful assistant tool for short-term trading.
The eighth part of the article features the description of the CSymbol class, which is a special object that provides access to any trading instrument. When used inside an Expert Advisor, the class provides a wide set of symbol properties, while allowing to simplify Expert Advisor programming and to expand its functionality.
The ring buffer is the simplest and the most efficient way to arrange data when performing calculations in a sliding window. The article describes the algorithm and shows how it simplifies calculations in a sliding window and makes them more efficient.