|
13+ years
experience
|
201
products
|
252
demo versions
|
|
1
jobs
|
0
signals
|
0
subscribers
|
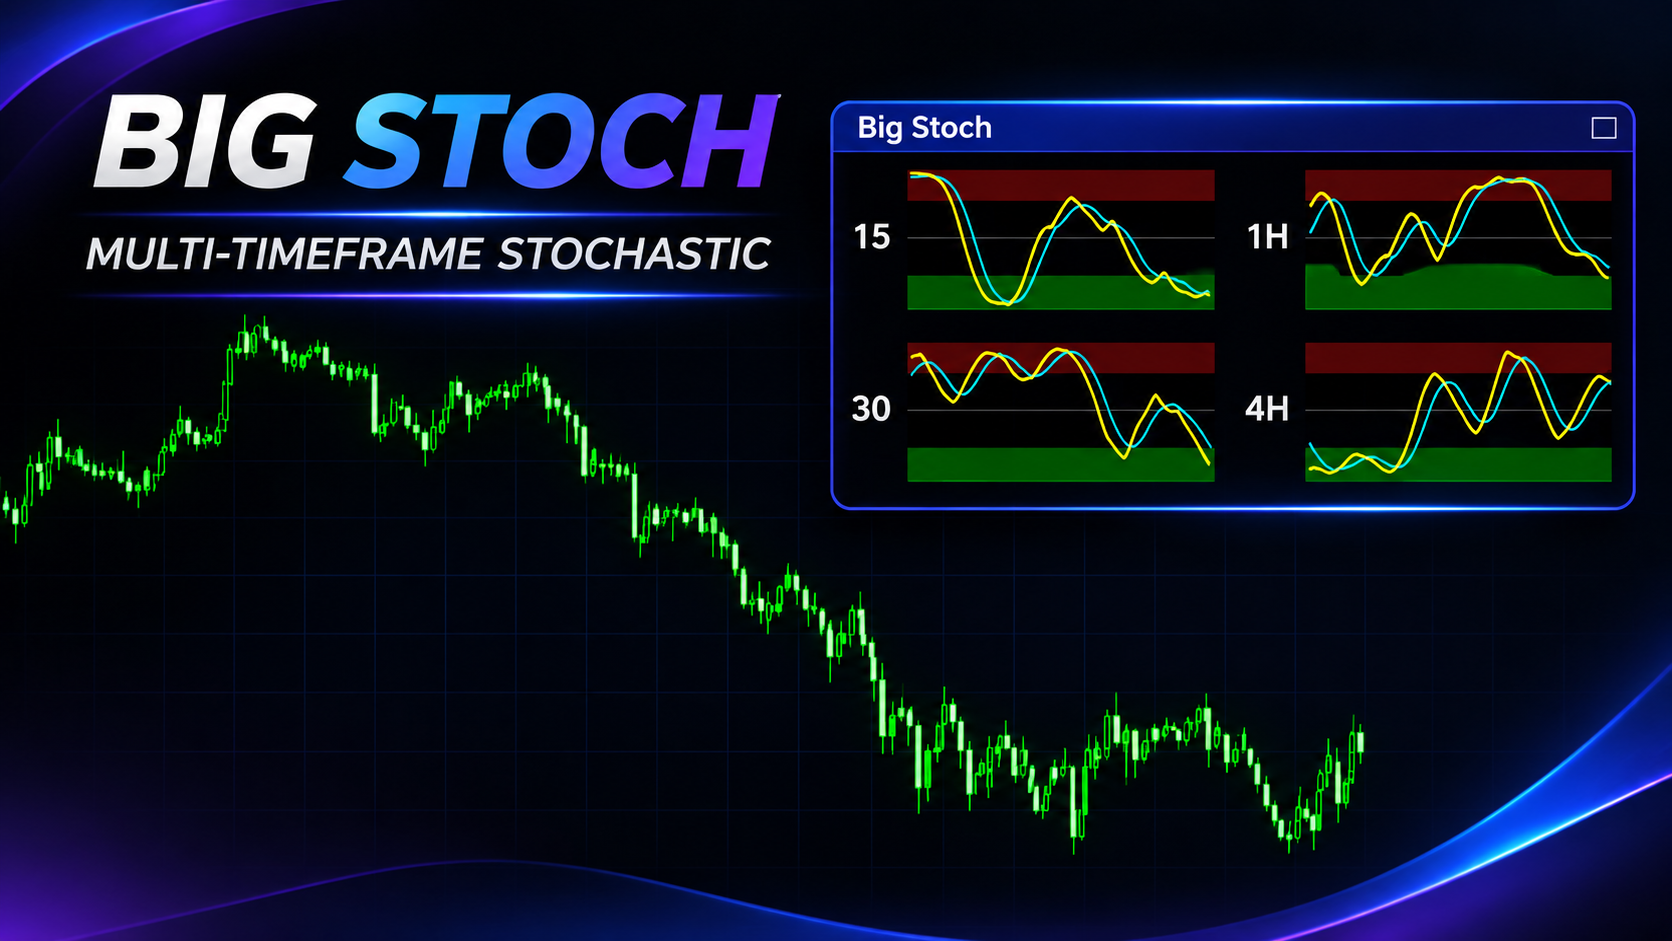
Big Stoch places up to four Stochastic mini-panels directly on the main price chart. Each panel is calculated from the selected timeframe and has its own %K, Slowing and %D parameters. This lets you monitor, for example, M15, M30, H1 and H4 at the same time without switching the main chart. Oscillator values use a 0–100 scale. MT5-version: https://www.mql5.com/en/market/product/205700 How Traders Can Use It The indicator is designed to help compare short-term momentum with the broader market
Big Stoch places up to four Stochastic mini-panels directly on the main price chart. Each panel is calculated from the selected timeframe and has its own %K, Slowing and %D parameters. This lets you monitor, for example, M15, M30, H1 and H4 at the same time without switching the main chart. Oscillator values use a 0–100 scale. MT4-version: https://www.mql5.com/en/market/product/205729 How Traders Can Use It The indicator is designed to help compare short-term momentum with the broader market
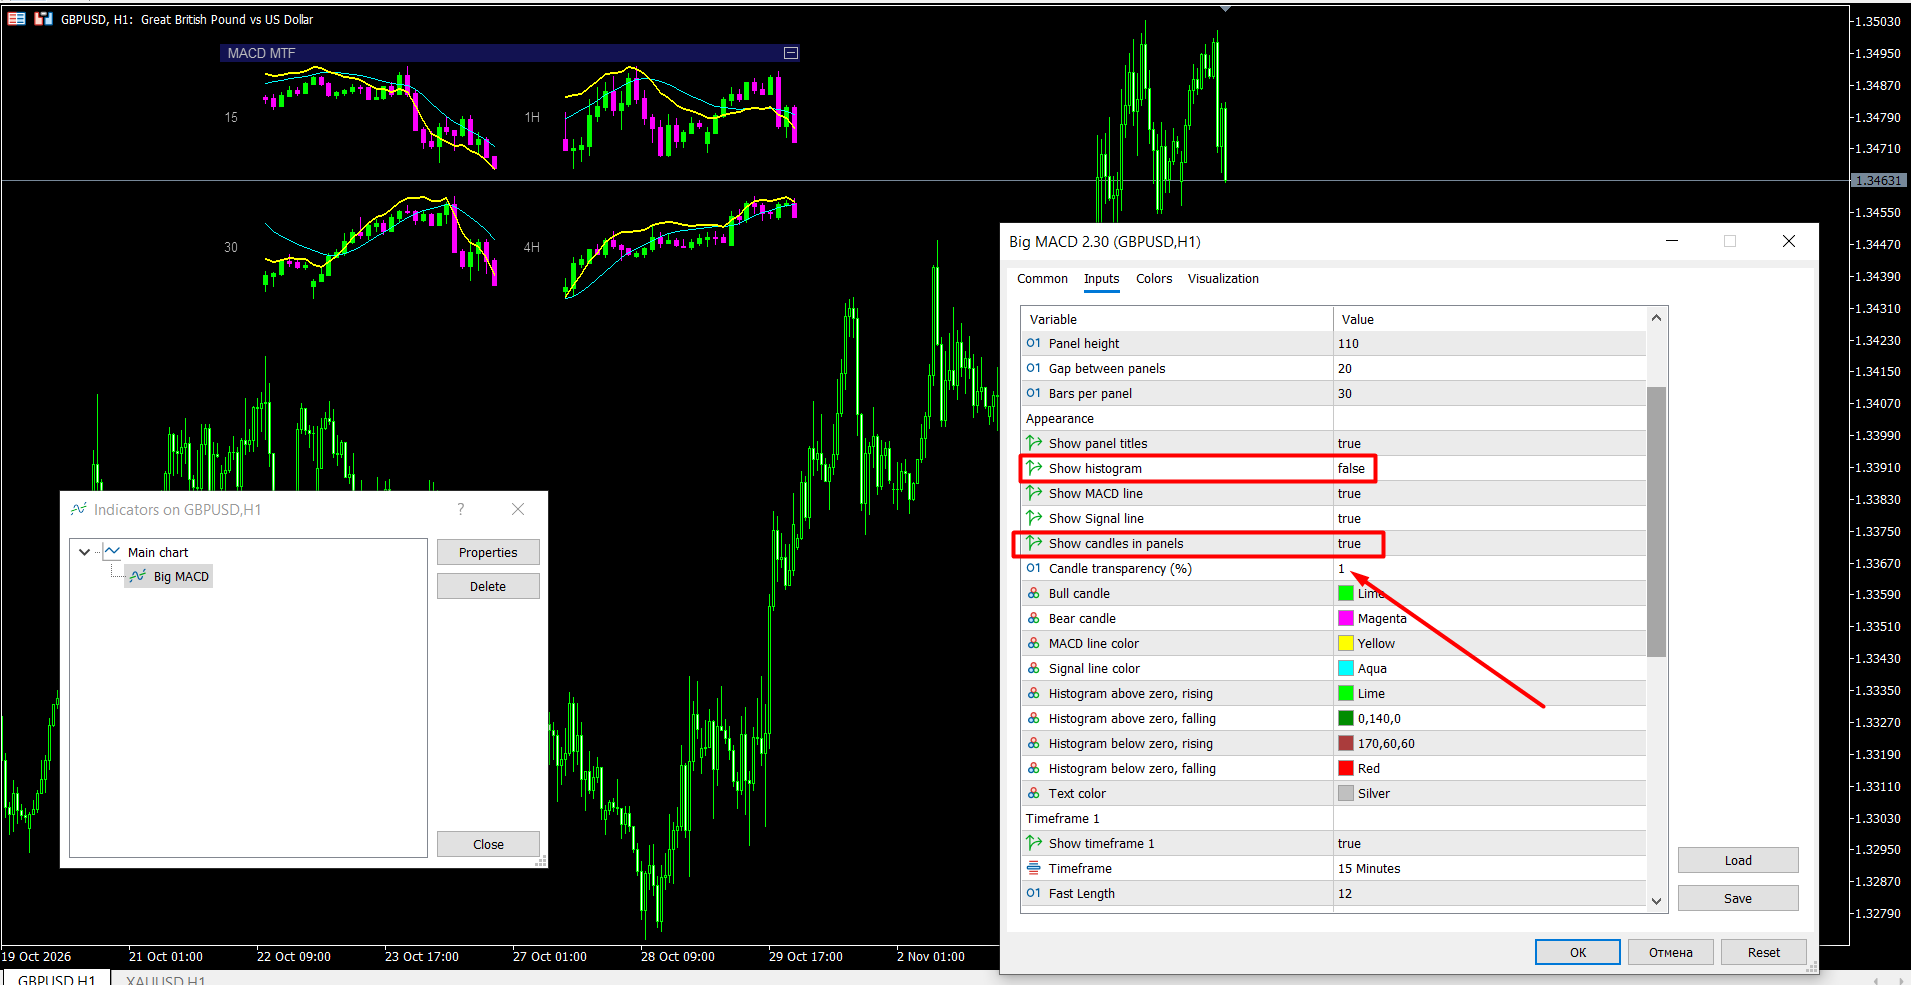
Big MACD displays the MACD indicator for up to four timeframes at once, in compact panels placed directly on the price chart. You can watch the market on M15, M30, H1, H4 or any other timeframes you choose without switching charts, and make decisions with the full multi-timeframe picture in front of you. MT4-version: https://www.mql5.com/en/market/product/205527 What you see on the chart Control strip. A thin strip sits above the panels. Drag it with the mouse to move the whole block
Big MACD displays the MACD indicator for up to four timeframes at once, in compact panels placed directly on the price chart. You can watch the market on M15, M30, H1, H4 or any other timeframes you choose without switching charts, and make decisions with the full multi-timeframe picture in front of you. MT5 -version: https://www.mql5.com/en/market/product/205373 What you see on the chart Control strip. A thin strip sits above the panels. Drag it with the mouse to move the whole block anywhere
FalconRidge is an all-in-one chart overlay for MetaTrader 4. It brings swing structure, key price levels, volatility zones, a price channel and a trend scoreboard onto a single chart, so you can read the market context at a glance instead of juggling many separate tools. MT4-version: https://www.mql5.com/en/market/product/203421 WHAT YOU SEE ON THE CHART Swings: arrows mark confirmed swing highs (red, pointing down) and swing lows (green, pointing up). A line connects consecutive swings
FalconRidge is an all-in-one chart overlay for MetaTrader 4. It brings swing structure, key price levels, volatility zones, a price channel and a trend scoreboard onto a single chart, so you can read the market context at a glance instead of juggling many separate tools. MT5-version: https://www.mql5.com/en/market/product/203426 WHAT YOU SEE ON THE CHART Swings: arrows mark confirmed swing highs (red, pointing down) and swing lows (green, pointing up). A line connects consecutive swings and
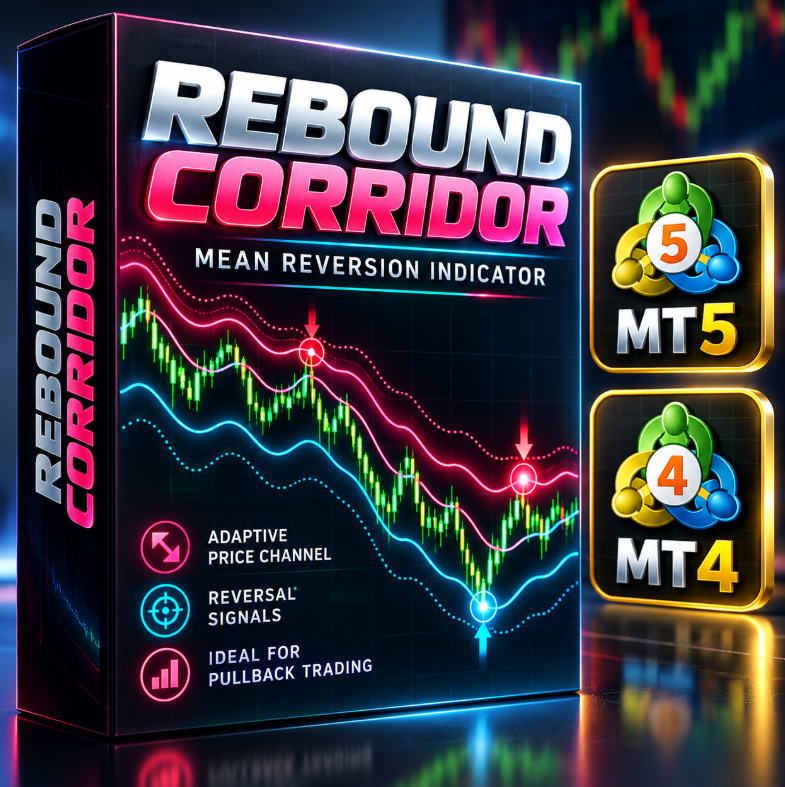
REBOUND CORRIDOR — indicator for MetaTrader 4 Rebound Corridor builds an adaptive corridor around price and marks the moments when price pushes beyond its edge and turns back toward the centre. It is designed for pullback and mean-reversion trading. MT5-version: https://www.mql5.com/en/market/product/203386 WHAT YOU SEE ON THE CHART Central line (the corridor axis). Its colour shows the current market bias: cyan — bullish, pink — bearish, violet — neutral. Inner bands (solid lines) — the
REBOUND CORRIDOR — indicator for MetaTrader 5 Rebound Corridor builds an adaptive corridor around price and marks the moments when price pushes beyond its edge and turns back toward the centre. It is designed for pullback and mean-reversion trading. MT4-version: https://www.mql5.com/en/market/product/203401 WHAT YOU SEE ON THE CHART Central line (the corridor axis). Its colour shows the current market bias: cyan — bullish, pink — bearish, violet — neutral. Inner bands (solid lines) — the
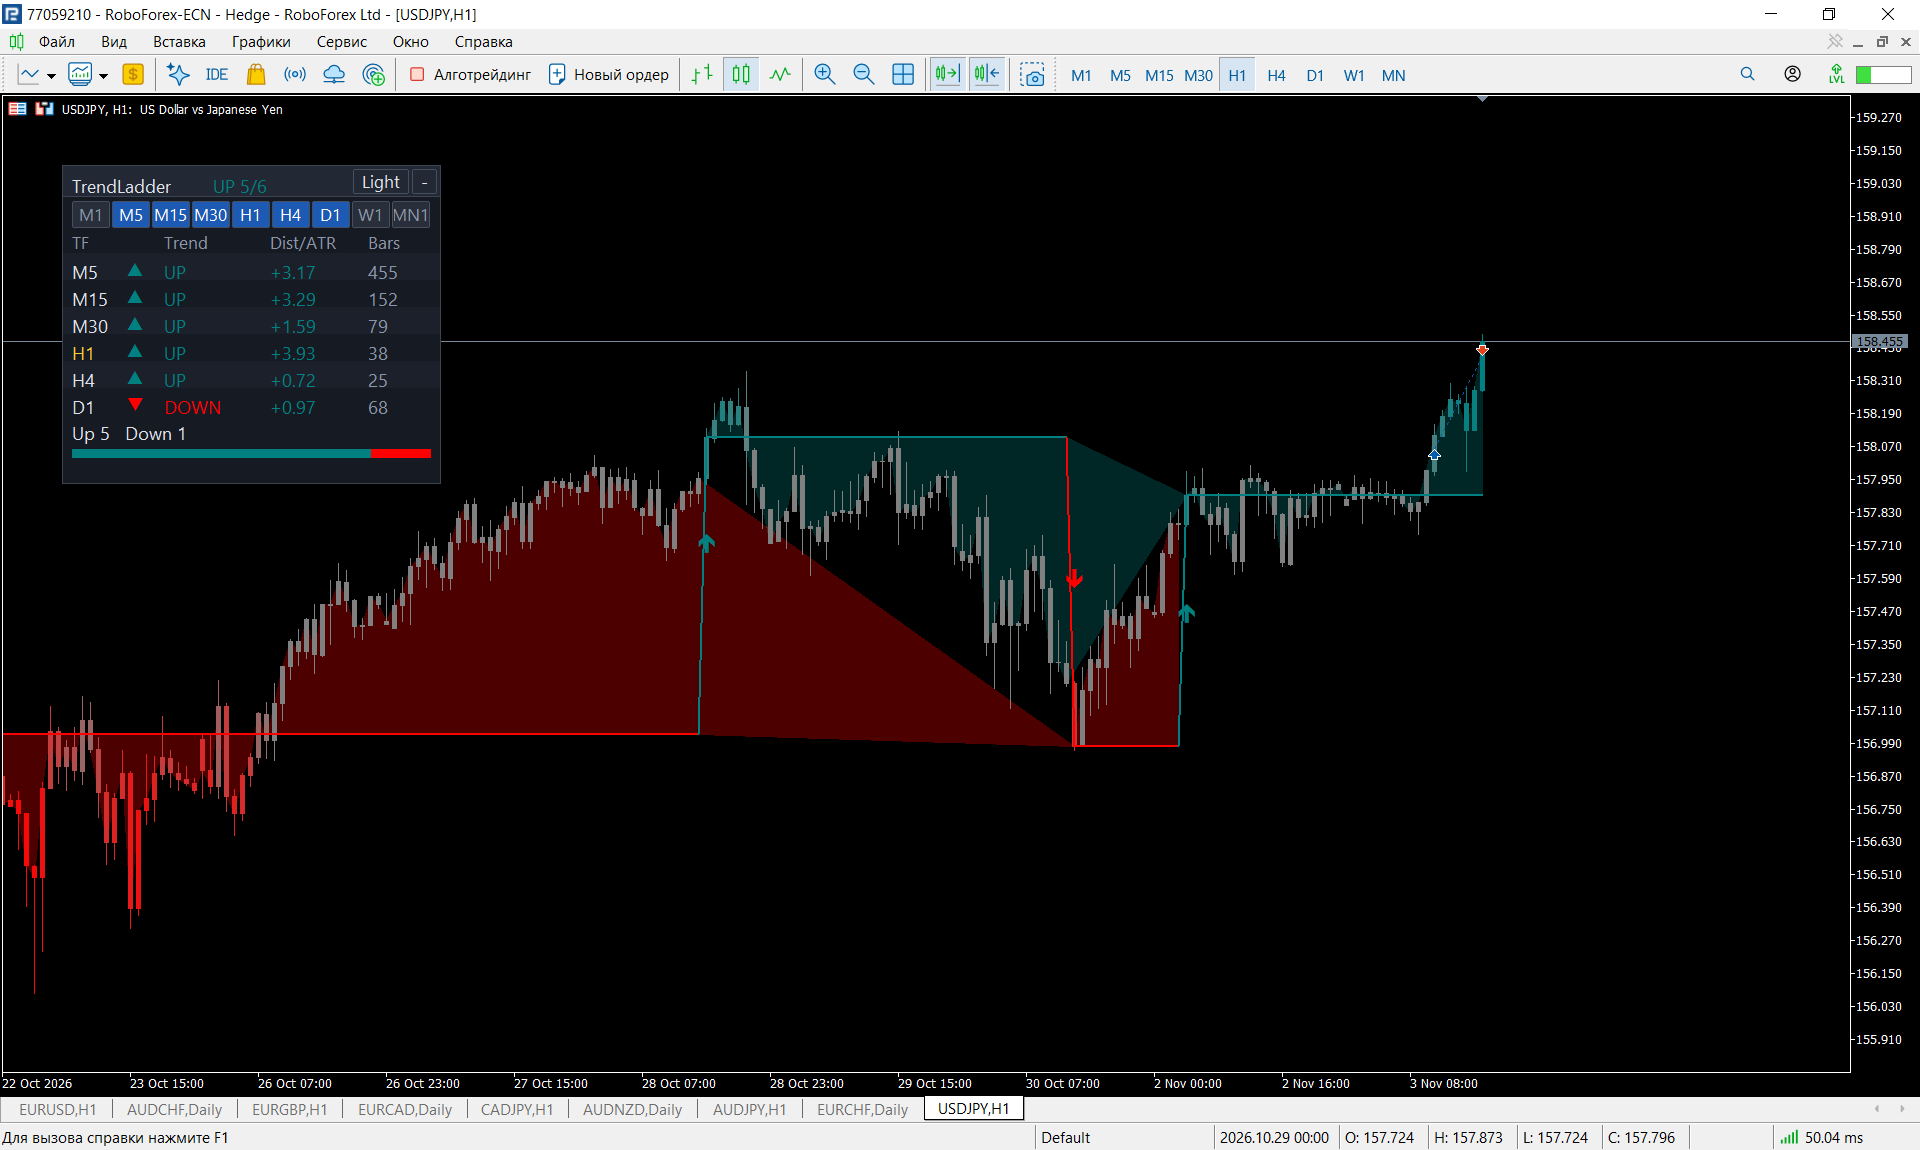
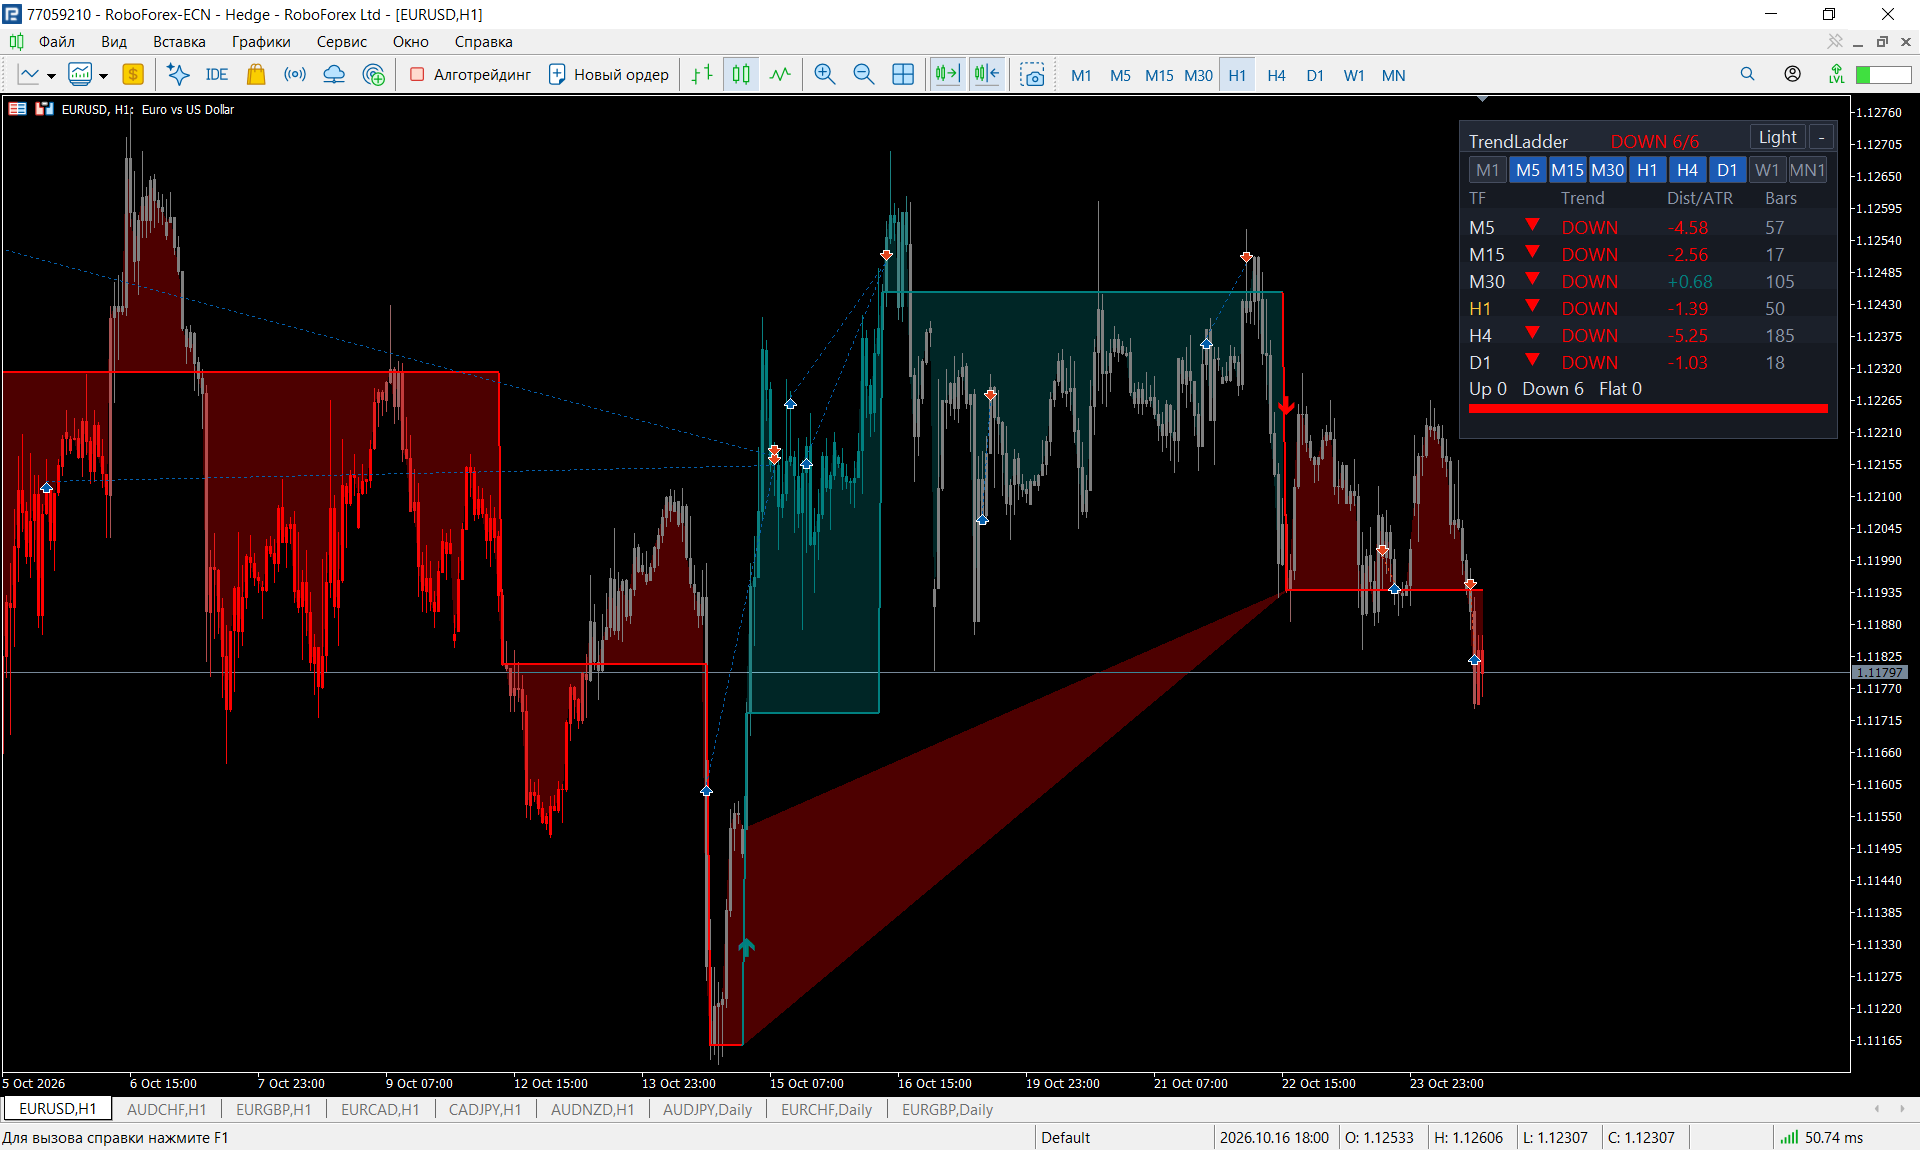
TrendLadder — adaptive trend indicator with a multi-timeframe panel PURPOSE TrendLadder shows the trend direction as a clean "step" line. While the market is just noise, the line stays put; it moves only when price makes a meaningful, confirmed move. This lets you see at a glance who is in control — buyers or sellers — and when the trend has really changed. MT5-version: https://www.mql5.com/en/market/product/203073 WHAT YOU SEE ON THE CHART Step line : green — uptrend, red — downtrend
TrendLadder — adaptive trend indicator with a multi-timeframe panel PURPOSE TrendLadder shows the trend direction as a clean "step" line. While the market is just noise, the line stays put; it moves only when price makes a meaningful, confirmed move. This lets you see at a glance who is in control — buyers or sellers — and when the trend has really changed. MT4-version: https://www.mql5.com/en/market/product/203097 WHAT YOU SEE ON THE CHART Step line : green — uptrend, red — downtrend