EA Performance Guard by Magic Number MT4

  • Utilities
  • Kazuma Uezono
    Kazuma Uezono
    • MQL5 / MQL4 / Pine Script Developer at  KuHero
    • Japan
    • 5504
    5 (1)
    MQL5 / MQL4 / Pine Script v6 developer and active trader.
    Seller on the MQL5 Market (indicators for MT4/MT5).
    Services:
    - TradingView Pine Script to MT5/MT4 conversion (bar-by-bar matching, with tester report)
    - MT4 to MT5 migration
  • Version: 1.3
  • Updated: 17 November 2026
  • Activations: 5
EA Performance Guard for MetaTrader 4 keeps a separate record for each EA on your account, identified by its magic number. If one EA hits a limit that you have set (drawdown, daily loss, or weaker recent results such as a losing streak, a low profit factor, a negative average trade or its equity curve falling under its moving average), the guard stops that EA alone: its open orders are closed, its pending orders are deleted, and any new order it places while stopped is closed. All other EAs continue as before.

The guard only carries out the rules you choose. It does not open trades, sends no buy or sell signals and is not a trading system. It cannot prevent losses and does not rate EAs: it reacts when your numbers are reached, and the final loss can be larger than the limit because of gaps, slippage or delays. The limits are your own choice.

Intended for: traders running several EAs on one MT4 account (for example on a VPS) who want a separate loss limit and a separate "stop when recent results fall" rule for each EA, rather than one limit for the whole account.

Features (MT4)
- Finds EAs by itself: each magic number seen in the Account History tab, in open orders or in pending orders gets a row. Manual trades (magic 0) can be included. An optional symbol list narrows the scope.
- Loss limits for each EA: maximum drawdown (in money or %) and daily loss (in money), optionally including floating P/L.
- Performance limits for each EA, active once the EA has a minimum number of closed trades (20 by default): losing streak, profit factor over the last N trades, average of the last N trades below zero, closed-trade equity curve under its moving average.
- One text input for per-EA exceptions: different limits for chosen magic numbers, warning only for some, or exclusion.
- Two actions: stop the EA (close its orders, delete its pending orders, close orders it opens while stopped) or warning only (nothing is closed).
- Optional global variable EPG_BLOCK_<magic> = 1 while an EA is stopped, which your own EA code can read.
- Resume options: after N days, at the start of the next day, by hand from the panel, or never automatically.
- The stop state survives a terminal restart (state file plus global variables).
- Panel with one row per EA and Stop / Resume buttons; CSV log; popup, push and email alerts.
- No DLL, no WebRequest, no external server.

Main Inputs (MT4)
- Which EAs: days of history for statistics (0 = everything shown in the Account History tab), include manual trades (magic 0), symbol list (empty = all symbols).
- Loss limits: max drawdown on/off (on), unit money or % (%), value (5), capital per EA for % (0 = automatic, explained below), daily loss on/off (off) and amount, hour and minute when a new day starts (server time), include floating P/L (on). Values in brackets are the defaults.
- Performance limits: minimum closed trades (20); losing streak on/off and count (on, 6); profit factor on/off, last N trades and minimum (on, 30, 0.8); expectancy on/off and last N trades (off, 50); equity curve under MA on/off and period (off, 20).
- Per-EA overrides: a single line of text (format below).
- Action: stop the EA or warning only (default: warning only), global variable on/off (on), maximum slippage for closing (points, 30).
- Resume: rule (default: by hand only), N days (3), statistics after a resume (restart from the resume time, or keep the whole history).
- Log and alerts: CSV log (on), popup (on), push, email.
- Panel: show or hide, language (auto, English, Japanese), position, font size, EAs per page.

How It Works (MT4)
- Where the data comes from: MT4 gives an EA only the history that is shown in the terminal's Account History tab. Right-click that tab and choose "All History"; with a shorter period, only the visible part is counted. If no deposit record is visible, the panel warns that the history may be partial. A custom period whose end lies in the past raises no warning, even though recent trades are then missing.
- Statistics per EA are built from closed orders, with swap and commission. Each MT4 order carries its own magic number. One history record is one trade: a partial close is counted once, and the remaining part (a new ticket) is counted again when it is closed.
- Close-by: one close-by counts as one trade. The extra 0-lot record that MT4 writes for the opposite order is not counted as a trade. If orders of two different EAs are closed by each other, the trade belongs to the EA whose record holds the P/L.
- Conditions that stop an EA (each can be switched on or off):
- Maximum drawdown: the highest value of the EA's closed P/L minus its current value (closed P/L, plus floating P/L when included). For %, it is divided by capital plus that highest value. Capital = your input, or when 0: account balance minus this EA's closed P/L.
- Daily loss: P/L of orders closed since the start of today, plus, when included, the full floating P/L of the EA's open orders (also those opened on earlier days). The day begins at the hour and minute you set in server time (00:00 server time by default), not at midnight on your PC.
- Losing streak: the number of losing trades in a row; a trade at exactly 0 breaks the streak.
- Profit factor: gross profit divided by gross loss over the last N trades; not judged while those trades contain no loss.
- Expectancy: the mean result of the last N trades is under 0.
- Equity curve under MA: the EA's cumulative closed P/L is under its simple moving average of the last N trades.
- Drawdown and daily loss apply from the first trade; the other four apply only after the minimum number of closed trades.
- Timing: MT4 has no trade event for this, so the guard looks for changes every second (timer) and on every tick of its chart, and reads the history again when the number of orders or history records changes (and at least every 2 seconds). The panel is redrawn only when its chart receives ticks; in a quiet or closed market the panel can show older values.
- Stopping an EA: the guard closes the EA's open orders and deletes its pending orders, and tries again when the market is closed, the freeze level blocks or the broker refuses. While stopped, every new order or pending order with that magic number is closed or deleted, logged as "blocked" and left out of the EA's statistics. Orders of other magic numbers are never touched.
- MT4 cannot attach a comment to a close, so a close made by the guard looks like any other close in the terminal. The CSV log shows which closes came from the guard.
- Blocked trades stay out of the statistics after a resume as well: the tickets opened and closed while the EA was stopped are kept in the state file.
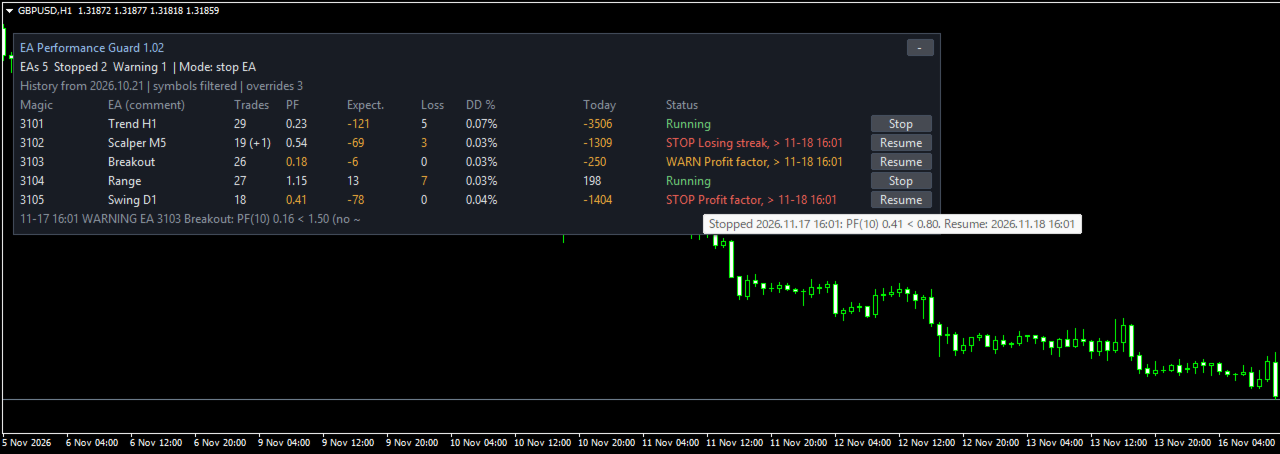
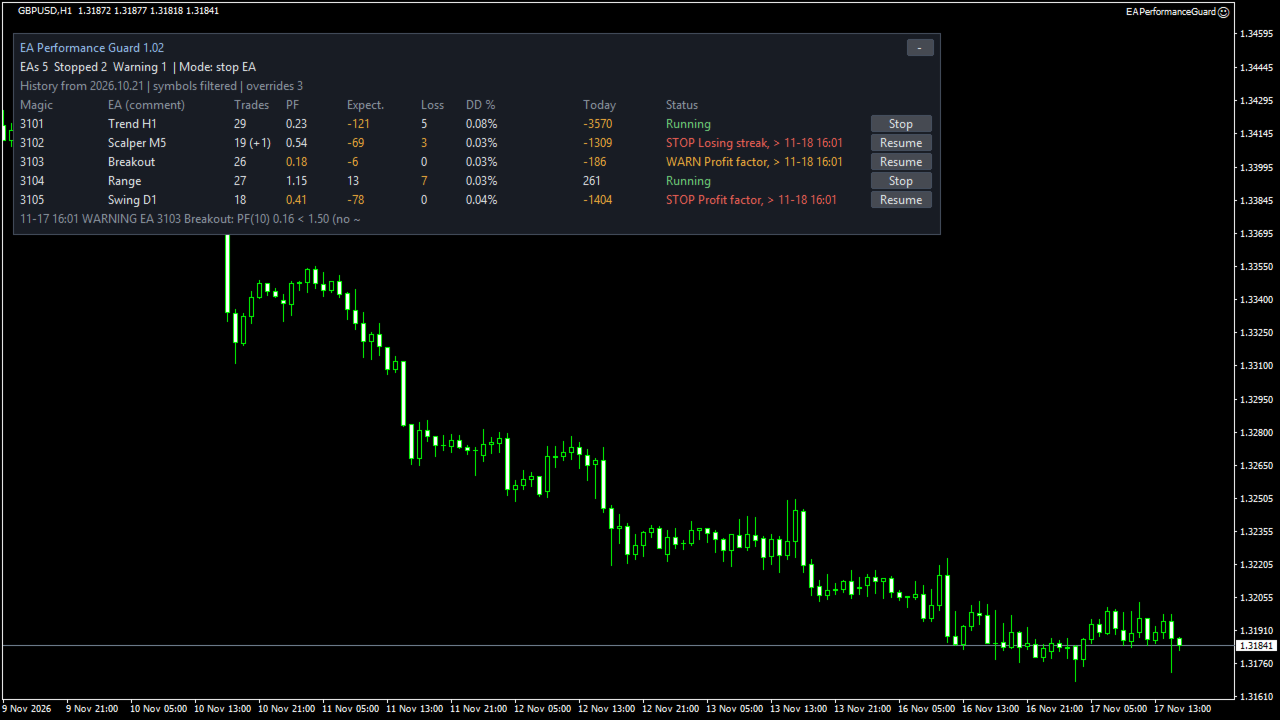
- Warning only: the row shows WARN, the event is logged and alerts go out, but no order is closed or deleted. WARN stays until the resume rule clears it.
- Stop button (two clicks within 5 seconds): stops the EA by hand, even in warning-only mode. An EA stopped by hand can only be resumed by hand. The Resume button (two clicks) works with every resume rule.
- Statistics after a resume: "Restart" uses only the trades after the resume, so the performance limits wait again for the minimum trades. "Keep" uses the whole history, but judging starts again at the resume: drawdown and daily loss from the values at that moment, the streak only from new losses, and profit factor, expectancy and MA after new trades (the smaller of N and the minimum). The panel may still display a longer streak that includes older trades.
- Overrides: magic:key=value,key=value, with | between EAs. Example: 12345:maxdd=3,pf=1.0|67890:off|24680:warn,losses=8. Keys: off (not watched), warn (warning only), stop (stop even in warning-only mode), maxdd (unit of the global setting), daily, losses, pf, pfn (N for profit factor), expn (N for expectancy), ma (MA period), min (minimum trades), cap (capital for %). A value above 0 switches that limit on for this EA; 0 switches it off. Do not separate EAs with ; because the text after it can be lost in a .set file. A wrong entry shows an error and the guard does not start.
- Panel columns: magic number, EA name (from the order comment, if any), trades ("(+n)" = blocked trades), profit factor, expectancy, current losing streak, drawdown, today, status (Running, WARN, STOP, CLOSING, with the resume time) and a Stop / Resume button. Hover for details. Collapse button and pages.
- CSV log: MQL4\Files\EPG\EPG_log_<account>.csv, one row per event (STOP, WARN, RESUME, POSITION_CLOSED, BLOCKED_CLOSED, ORDER_DELETED, CLOSE_FAIL, DELETE_FAIL) with server time, magic, name, reason, details, the statistics at that moment and the result.
- EPG_BLOCK_<magic> is 1 while the EA is stopped and 0 after a resume; it is deleted when the guard is removed from its chart. In your own EA, skip new entries while GlobalVariableGet("EPG_BLOCK_12345") == 1.

Notes and Limits (MT4)
- Set the Account History tab to "All History" before you rely on the numbers (see How It Works).
- The default is warning only. On start the guard judges every EA found in the history shown; with history days = 0, past EAs that no longer trade are judged too, and an EA already beyond a limit shows WARN and sends an alert. When the behaviour is as you expect, change Action to "Stop the EA". After that, an EA beyond a limit is stopped and closed at once, including EAs that show WARN at that moment, so first resume any EA you want to keep running.
- A stopped EA is not switched off; it keeps running on its chart. Each new order it opens is closed at once and pays spread and commission every time. Remove the stopped EA from its chart or let it read EPG_BLOCK_<magic>.
- Deleting the state file (MQL4\Files\EPG\EPG_state_<account>.txt) erases the record of trades made while an EA was stopped; those trades then count in its statistics again.
- An order opened by a stopped EA just before the market closes cannot be closed until the market opens again.
- One guard per account. A second copy in the same terminal stays idle and says so on its panel. A guard in another terminal logged in to the same account cannot be detected, so both would act.
- Amounts are in the account currency (for example USD or JPY), not in pips or points.
- The loss can exceed your limit: the guard acts only after the limit is reached, and gaps, slippage, a closed market, refused orders or a lost connection can delay the close or worsen the price.
- It works only while MetaTrader 4 is running and connected. Closing needs the AutoTrading button ON and "Allow live trading" ticked in the guard's settings. A VPS is recommended.
- EAs are separated only by magic number: EAs sharing a magic number count as one EA, and magic 0 counts as manual trading.
- The EA name is read from the order comment; it can be empty or changed by the broker.
- With few trades the statistics move a lot, which is why the performance limits wait for a minimum number. A stop on these limits does not mean that the EA is bad or that it would have lost.
- Strategy Tester: no other EA runs there, so the guard finds no EA trades and only its panel can be checked. Please test it on a demo account with your EAs.
- MT4 version: if the Windows "Language for non-Unicode programs" cannot display Japanese, the panel and its messages switch to English automatically, even when Japanese is selected (an MT4 limitation).

Compatibility and Support (MT4)
- MetaTrader 4 only. Attach it to one chart of any symbol; it watches every symbol on the account unless a symbol list is set.
- No DLL and no external server. Files are written only to MQL4\Files\EPG\.
- Panel language English or Japanese (follows the terminal language by default).
- Support via MQL5 messages, answered within 3 business days, for installation, settings and bug reports. We cannot say which limits to use or which EAs to run or stop, and we give no market opinions or trade decisions.

Disclaimer (MT4)
- This product is a software tool and not investment advice. It recommends no EA, symbol or setting. Leveraged trading carries a high risk of loss. No profit is promised or implied, and there is no guarantee that a loss is avoided or stays within your limits. Try it on a demo account first; your settings and your trading are your own responsibility.
More from author
Supply & Demand Zones marks supply and demand zones on a MetaTrader 5 chart with one fixed, fully published rule: a strong bar (body at least X times ATR) that leaves a short "base" of small-body bars behind it. The base becomes a demand zone when the strong bar is bullish and closes above it, or a supply zone when the strong bar is bearish and closes below it. Each zone shows its state: fresh, touched with a count, or broken. It is meant for traders who draw these zones by hand and want them d
FREE
Elliott Wave Auto Count labels Elliott waves automatically on four degrees at the same time: the base degree and the three degrees above it. It follows the rules and guidelines of "Elliott Wave Principle" (Frost & Prechter). For the current wave it also shows a price x time guideline zone and an invalidation level. This is the MetaTrader 4 version; the counting logic is the same as in the MetaTrader 5 version (sold separately). HOW IT WORKS 1. Swings: five ATR(100)-based zigzags. Each higher d
Fibo Price Time Zones combines Fibonacci price levels with Fibonacci time targets and draws them on the chart as boxes (price x time zones). Where boxes from several waves and from up to two higher timeframes overlap, the area is emphasized in three levels. It is meant for traders who already use Fibonacci retracements and extensions and also want to see roughly when a level is worth watching, without drawing every tool by hand. It is a display tool only: it gives no buy or sell signals and doe
VWAP Band Fills with Anchored VWAP is a TV-compatible VWAP for MetaTrader 5. It uses the same formula as the built-in "VWAP" indicator of TradingView (Pine ta.vwap), offers the same inputs - anchor period, source, offset, standard deviation or percentage bands #1 to #3 - and draws it the same way: a blue VWAP line, green / olive / teal bands and light fills between them. An optional anchored VWAP starts from a vertical line that you drag to any bar. HOW IT IS CALCULATED For every bar of the cu
FREE
Stoch RSI Band Fill is a Stochastic RSI indicator for MetaTrader 5. MT5 does not include a built-in Stoch RSI, so this indicator adds one. It follows the same calculation steps as the built-in Stoch RSI on TradingView and uses the same layout: K and D lines, 80 / 50 / 20 levels and a shaded band between the upper and lower levels. CALCULATION, STEP BY STEP 1. RSI of the selected price (default: close, length 14), smoothed with Wilder's method (RMA). The first average is the simple average of the
FREE
RSI AutoScale is a clean, lightweight RSI for traders who use both TradingView and MetaTrader 5 and want the two charts to look the same. WHAT IT SHOWS - RSI (Wilder smoothing): the same values as the standard RSI, with any applied price. - Signal line on the RSI: SMA, EMA, SMMA or LWMA, with its own period. - Levels: upper, middle and lower lines (70 / 50 / 30 by default). They use MT5's native levels, so they reach the right edge and their values appear on the scale. - Zone fills: the middle
FREE
Candle Countdown Tag with Spread shows how long the current candle has left, in a small colored tag right next to the last candle - the way TradingView shows its bar countdown. The same tag can also show the current spread, the time left of up to two more timeframes and the open time of the next candle. It is a display tool for MetaTrader 5: no alerts, no signals, no trading. WHAT IT SHOWS - Time left of the chart timeframe: mm:ss under one hour, hh:mm:ss under one day, "2d 04:15:30" for longe
FREE
Pivot Points Six Types with Level Alerts is a TV-compatible pivot point indicator for MetaTrader 5. It uses the same formulas and the same period boundaries as the "Pivot Points Standard" indicator that comes with TradingView, and it draws the levels the same way: short horizontal lines that start at the first bar of each period, with "R1 (price)" style labels in orange (#FB8C00). SIX CALCULATION TYPES The levels are calculated from the high, low and close of the previous period. - Traditional
FREE
Supertrend Trend Fill with Change Alerts is a TV-compatible Supertrend for MetaTrader 5. It uses the same calculation as the "Supertrend" indicator built into TradingView and draws it the same way: a green line below price in an up trend, a red line above price in a down trend, and a light fill between the line and the middle of each candle body. Supertrend shows the direction of the trend. It is a charting aid, not a buy or sell signal, and it does not predict where price will go. HOW IT IS C
FREE
MACD Four Color Histogram is a MACD for MetaTrader 5 that uses the same formula and the same look as the built-in MACD on TradingView. It is made for traders who use both platforms and want the MACD on each chart to read the same way. HOW IT DIFFERS FROM THE MT5 STANDARD MACD - MT5 standard MACD: the histogram is the MACD line itself, and the signal line is an SMA. - This indicator: three parts, as on TradingView. MACD line, signal line, and histogram = MACD - signal. The histogram has 4 colors.
FREE
Prior Day Week Month Levels with Touch Alerts draws the previous day, week and month high and low on your MetaTrader 5 chart as clean horizontal lines with labels at the right edge, in the style of TradingView. It can also show the previous day's close and today's open. LEVELS - PDH / PDL: previous day high and low (blue #2962FF, solid) - PWH / PWL: previous week high and low (orange #FF9800, dashed) - PMH / PML: previous month high and low (purple #9C27B0, dash-dot) - PDC: previous day close (
FREE
Do you mark supply and demand zones by hand and get a slightly different result every time? This free MetaTrader 4 indicator draws them with one fixed rule that is written out in full below, so you can check every zone yourself. The idea: a strong candle (body at least X times ATR) leaves a "base" of 1 to 10 small candles right before it. A bullish strong candle that closes above the base turns it into a demand zone; a bearish one that closes below it turns it into a supply zone. The indicator
FREE
This is the MetaTrader 4 edition of RSI AutoScale. It draws the standard Wilder RSI with a signal line, a shaded band between the levels, colored areas where the RSI leaves that band, and a choice of three scales. It is meant for traders who use TradingView and MetaTrader 4 side by side and want the RSI pane to look much the same on both. HOW IT LOOKS ON MT4 - RSI line: the same values as MT4's built-in RSI for the same period and applied price. - Signal line: a moving average of the RSI (SMA, E
FREE
Supertrend Trend Fill with Change Alerts MT4 brings a TV-compatible Supertrend to MetaTrader 4. If you also use TradingView, you know its built-in "Supertrend": a green line under price while the trend is up, a red line over price while it is down, and a soft colored band between the line and the candles. This MT4 indicator reproduces that calculation and that look. What it is for: seeing the current trend direction and where it would flip. What it is not: a buy or sell signal or a forecast. A
FREE
VWAP Band Fills with Anchored VWAP MT4 brings the VWAP of TradingView to MetaTrader 4. If you use TradingView's built-in "VWAP", you will find the same inputs here (Anchor Period, Source, Offset, Bands Calculation Mode, Bands Multiplier #1 to #3, Hide VWAP on 1D or Above), the same formula (Pine ta.vwap) and the same colors - plus an anchored VWAP that starts wherever you drag a vertical line. THE FORMULA Within each anchor period, bar by bar: VWAP = sum(source x tick volume) / sum(tick volume
FREE
A MetaTrader 4 MACD built to read like the MACD you see on TradingView: a MACD line, a signal line, and a histogram of the gap between them, colored in four shades. If you switch between the two platforms during the day, the MACD pane on your MT4 chart will look and behave the way you are used to. WHY NOT THE MT4 BUILT-IN MACD? MT4's own MACD draws the MACD line as gray bars and smooths the signal line with an SMA. There is no separate histogram and no color change. This indicator calculates the
FREE
MetaTrader 4 ships with a Stochastic and an RSI, but not with a Stochastic RSI. This indicator fills that gap for MT4 users and is built to be TV-compatible: it follows the calculation of the Stoch RSI that comes with TradingView, and the pane looks the way TradingView users expect - a blue K line, an orange D line, dashed 80 and 20 levels, a dotted 50 line and a light band between 80 and 20. WHAT APPEARS IN THE SUBWINDOW - K and D lines. The Data Window lists only K and D. - Upper band (80) a
FREE
Prior Day Week Month Levels with Touch Alerts MT4 puts yesterday's, last week's and last month's high and low on your MetaTrader 4 chart, drawn the way TradingView users are used to seeing them: thin horizontal lines with a short label and price at the right edge. Optional extras: previous day close and today's open, and an alert when price touches a line. WHAT YOU SEE Line | Meaning | Default look PDH | previous day high | blue #2962FF, solid PDL | previous day low | blue #2962FF, solid PWH |
FREE
Pivot Points Six Types with Level Alerts MT4 brings TV-compatible pivot points to MetaTrader 4. If you also chart on TradingView, you know its built-in "Pivot Points Standard". This MT4 indicator reproduces it: the same six calculation methods, the same period choices from one day to ten years, and the same look - an orange (#FB8C00) line for each level, starting at the beginning of each period, labelled like "S2 (1.08345)". WHICH LEVELS EACH METHOD GIVES Method | Levels drawn | Note Tradition
FREE
Directional Movement DMI with Cross Alerts MT4 brings a TV-compatible DMI to MetaTrader 4. If you also chart on TradingView, you know its built-in "Directional Movement Index": a pink ADX line, a blue +DI line and an orange -DI line in a panel under the price. This MT4 indicator uses the same formula, the same defaults and the same colors. What it is for: reading how strong the recent movement has been (ADX) and whether upward (+DI) or downward (-DI) movement has been larger. What it is not: a
FREE
Ichimoku Cloud Fill with Cross Alerts MT4 brings a TV-compatible Ichimoku Cloud to MetaTrader 4. If you also chart on TradingView, you know its built-in "Ichimoku Cloud": five lines and a soft green or red cloud. This MT4 indicator reproduces that calculation, the same defaults and the same placement of the spans, and fills the cloud with solid color bars instead of hatching. What it is for: seeing where price stands against the middle of recent ranges and how the cloud ahead is shaped. What it
FREE
Candle Countdown Tag with Spread MT4 puts a TradingView-style countdown on your MT4 chart: a small tag beside the last candle that tells you when the bar closes, together with the current spread. Optional extra lines show the time left of two more timeframes and when the next candle opens. Nothing else - it does not trade, alert or give signals. ONE TAG, UP TO FIVE LINES Line | Example | Setting Chart timeframe | 12:41 | on by default Extra timeframe 1 | H4 02:12:41 | off (choose a timeframe t
FREE
Dow Structure MTF shows the Dow theory trend of five timeframes at once in MetaTrader 4, using the pullback low / rally high method that is common among Japanese traders. For each timeframe it shows whether the trend is up, down or range, which price would change it, and how far the current price is from that price. Only closed bars are used, so a confirmed result does not change afterwards (no repaint). It is meant for traders who check the trend structure of several timeframes by hand and wan
Fibo Price Time Zones for MetaTrader 4 combines Fibonacci price levels with Fibonacci time targets and draws them on the chart as boxes (price x time zones). Where boxes from several waves and from up to two higher timeframes overlap, the area is emphasized in three levels. It is meant for MT4 traders who already use Fibonacci retracements and extensions and also want to see roughly when a level is worth watching. It is a display tool only: it gives no buy or sell signals and does not place ord
Time Average Lines draws four averages measured by time, not by the number of bars, so each line keeps the same length of time when you switch timeframes: a time moving average, a TWAP, a same-time-of-day average and a time-based EMA. For the same-time average, the rest of today is shown as a dotted path that joins the past averages; the path is a summary of the past, not a forecast. It is meant for intraday traders who want averages that mean the same thing on M1 and on M15, and who want to co
Auto Trendline Channel MTF draws trendlines, parallel channels and horizontal support / resistance automatically from confirmed swing highs and lows in MetaTrader 4, and records for each line the touch count, close breaks, wick breaks and retests. A table shows, for the chart timeframe and two higher timeframes, the nearest line above and below the price, the distance to it and the Dow theory direction. It is meant for traders who draw trendlines and levels by hand and want them drawn by fixed,
Currency Strength Meter for MetaTrader 4 combines the 28 pairs of the 8 major currencies (USD, EUR, JPY, GBP, AUD, NZD, CAD, CHF) into one strength line per currency, with a ranking table for the chart timeframe, M15, H1, H4 and D1. The full formula is published below. It is meant for MT4 traders who compare currencies before choosing which pair to look at, and who want to know exactly how the numbers are made. It is an analysis aid: it does not tell you when to buy or sell and does not show fu
Trade History Stats Panel for MetaTrader 4 reads the closed trades in your own account history and sums them up in a panel on the chart: number of trades, win rate, profit factor, average P/L per trade, drawdown of the closed-trade curve, holding time, buy / sell, and tables by month, symbol, weekday and hour. It is meant for traders who want to look back at their own past trades, like a trading journal that fills itself in, and to check the numbers by period, symbol or magic number. It never p
Prop Challenge Loss Tracker for MetaTrader 4 shows, in a panel on the chart, how much room is left before the daily loss limit and the maximum loss limit of a funded-account (prop) challenge are reached, and sends staged alerts as the limits are used up. It is meant for traders taking a prop challenge who want to see their remaining loss room at a glance, set to the rules of their own program. It is a display and alert tool only: it never opens, modifies or closes any order. Whether a limit is
Market Structure Liquidity Map for MetaTrader 4 draws smart money concepts (SMC) style market structure on the chart: swing labels, break of structure (BOS), change of character (CHoCH), equal highs and lows, previous day and week levels, liquidity sweeps and unfilled fair value gaps (FVG), with a small table for the chart timeframe and two higher timeframes. It is meant for MT4 traders who read structure and liquidity by hand and want the same levels drawn the same way every time. It is a disp
Filter:
No reviews
Reply to review