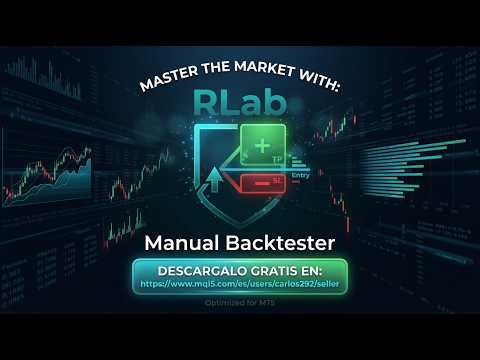
R Lab Manual Backtester
- Utilities
-
Carlos Dante Diaz
 Hi, I'm Carlos Díaz, a programmer and algorithmic trader from Argentina with more than 10 years of experience as a trader. I design, code and test all my Expert Advisors in MQL5, using MetaEditor and the MetaTrader 5 Strategy Tester.
- Version: 1.30
RLab Manual Backtester
Risk Reward & R-Multiple Tracker
Practice your trading with manual backtesting directly on the chart. Draw buy and sell trades with a single click, featuring ATR-based stops, R:R-based take profits, and automatic results in both R-multiples and cash.
FULL DESCRIPTION:
RLab Manual Backtester is a utility for MetaTrader 5 that turns your chart into a practice laboratory. Draw buy or sell trades over historical data, and the tool automatically tells you whether each trade would have hit Take Profit or Stop Loss first, and how much you would have won or lost.
It does not open real trades: it is designed to test and validate your ideas before risking real money.
HOW IT WORKS:
- Select BUY or SELL on the panel.
- Click on the chart where you would have entered.
- The trade box is drawn automatically: the Stop Loss is calculated using ATR x 2 (configurable) and the Take Profit is set at a 1:2 risk-to-reward ratio (also configurable).
- Drag the lines to adjust the SL, TP, or move the entire box.
While moving the mouse, you will see a live preview of the box. Press the Esc key to cancel drawing.
AUTOMATIC RESULTS:
- Each box checks subsequent candles and marks with a checkmark if the TP was reached, or a cross if the SL was hit.
- If both levels are reached on the same candle, the outcome is resolved using M1 candles. If both are touched in the very same minute, the SL is prioritized (conservative approach).
- The panel displays the total number of trades, wins, losses, win rate, and total outcome in both R-multiples and cash.
RISK AND LOT SIZE:
- Editable account balance directly from the panel.
- Three risk types selectable via a dropdown menu: percentage of account, fixed lot size, or fixed cash amount.
- Optional compound interest: each trade calculates its risk based on the accumulated balance.
- Lot size is calculated according to symbol specifications (tick value, minimum lot, maximum lot, and step).
CUSTOMIZABLE:
- Quick settings panel directly on the chart: enable or disable individual text labels (trade type, R:R, lot size, cash, distance, prices, and outcome), arrows, and markers.
- Bold typography, adjustable font sizes, and customizable colors.
- Outcome markers can be drawn inside the box: a checkmark in the green zone for wins, a cross in the red zone for losses.
- Your settings are saved between sessions.
IDEAL FOR:
- Practicing and training your entry criteria using your preferred risk-to-reward ratio.
- Validating a trading idea across numerous trades before automating it.
- Tracking your results in R-multiples, independent of account size.
IMPORTANT:
- The tool evaluates results using historical chart candles. It does not simulate spread, commissions, swaps, or slippage, and assumes entries are executed at the exact price where you clicked. Results are for guidance purposes only.
- Works on any symbol and timeframe.
- Boxes remain drawn on the chart and are preserved when changing timeframes.
- Past performance does not guarantee future results. Trading involves the risk of loss.