Wyckoff Schematic Detector
- Indicators
-
Felicien Badou Diouf
 We are a quantitative trading technology company specializing in algorithmic trading, Expert Advisors, trading automation, and quantitative research.
 - Version: 1.0
- Activations: 5
Wyckoff Schematic Detector Accumulation Distribution Spring UTAD
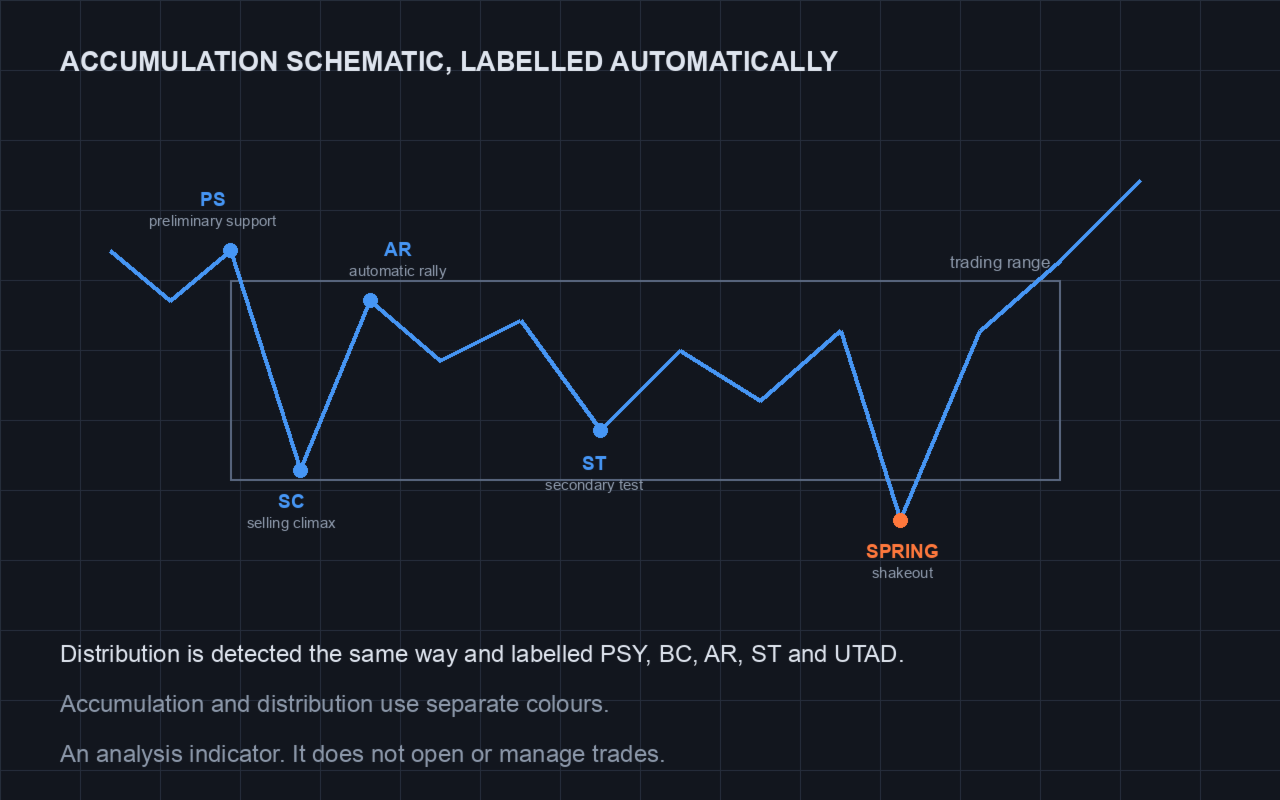
Automatically detects and labels the classic Wyckoff accumulation and distribution sequence — PS, SC, AR, ST, Spring, SOS, LPS and the distribution mirror PSY, BC, AR, ST, UTAD, SOW, LPSY — from price structure combined with volume and bar range analysis. Draws the trading range, marks each event on the bar where it occurred, and alerts on new events. Everything is evaluated on closed bars only, so nothing repaints.Automate the Wyckoff Method — Volume + Range > Price Shape Alone
The Wyckoff method works because it reads intent through volume and price action — not just patterns. But manual schematic analysis is slow, subjective, and error-prone. This indicator automates the core Wyckoff logic: phase detection, trading range identification, and spring/upthrust signaling using objective volume and range metrics.
What It Detects (Automatically, Non-Repainting)
1. Four Wyckoff Phases
| Phase | Detection Logic | Visual |
|---|---|---|
| Accumulation | Decreasing range + increasing volume on down moves + spring test | Green "A" label + range box |
| Markup | Higher highs/higher lows + volume expansion on advances | Blue "M" label + trend channel |
| Distribution | Decreasing range + increasing volume on up moves + upthrust test | Red "D" label + range box |
| Markdown | Lower highs/lower lows + volume expansion on declines | Orange "M" label + trend channel |
2. Key Wyckoff Events
- Spring — False breakdown below support with volume absorption (buy signal)
- Upthrust — False breakout above resistance with volume absorption (sell signal)
- LPS (Last Point of Support) — Low-volume pullback in markup (add to longs)
- BU (Back-Up) — Low-volume rally in markdown (add to shorts)
- Sign of Strength (SOS) — Volume surge breaking resistance in accumulation
- Sign of Weakness (SOW) — Volume surge breaking support in distribution
3. Trading Range Boundaries
- Automatic support/resistance detection via volume-weighted pivots
- Range extension projections (counting guide)
- Cause & effect measurement (horizontal count → vertical target)
Detection Logic (Objective, Rule-Based)
Phase Classification:
Accumulation: Range contracting + Volume on down > Volume on up + Spring detected Markup: HH/HL structure + Volume expanding on advances + SOS confirmed Distribution: Range contracting + Volume on up > Volume on down + Upthrust detected Markdown: LH/LL structure + Volume expanding on declines + SOW confirmed
Spring/Upthrust Criteria:
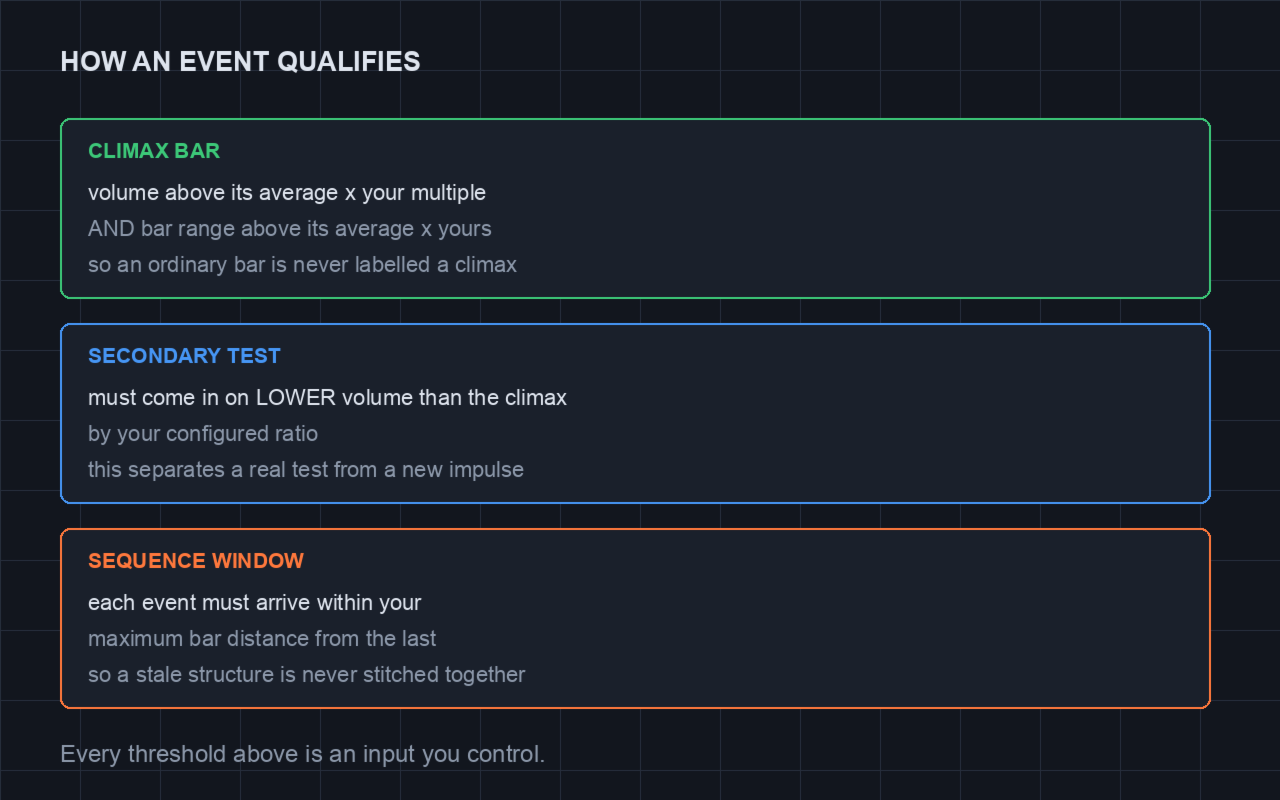
- Price pierces range boundary (support/resistance)
- Volume on pierce < 50% of average range volume (absorption)
- Price reclaims range within 3 bars
- Close back inside range = confirmed spring/upthrust
Volume Analysis:
- Compares up-volume vs down-volume per swing
- Uses tick volume (forex) or real volume (futures/stocks)
- Volume-weighted average price (VWAP) anchor for range
Input Parameters
input int LookbackBars = 500; // Bars to analyze for range detection input double VolumeThreshold = 1.5; // Volume ratio for absorption detection input int MinRangeBars = 20; // Minimum bars for valid trading range input bool ShowPhases = true; // Show phase labels (A/M/D/M) input bool ShowEvents = true; // Show spring/upthrust/LPS/BU markers input bool ShowRangeBox = true; // Draw trading range rectangle input bool ShowCountGuide = true; // Show cause/effect count guide input color AccumulationColor = clrLime; input color MarkupColor = clrDodgerBlue; input color DistributionColor = clrRed; input color MarkdownColor = clrOrange;
On-Chart Display
- Phase labels (A, M, D, M) at phase transitions
- Trading range box with support/resistance lines
- Spring/Upthrust markers with alert arrows
- LPS/BU markers for continuation entries
- Count guide — horizontal cause → vertical effect projection
- Volume histogram colored by up/down dominance
- Dashboard — current phase, range status, next key level
Alerts (Push / Email / Telegram)
- Phase transition (Accumulation → Markup, etc.)
- Spring detected (long setup)
- Upthrust detected (short setup)
- LPS/BU formed (continuation entry)
- Range breakout with volume confirmation
Compatibility
- MetaTrader 5 (build 4000+)
- Any symbol — Forex, Gold, Indices, Crypto, Stocks, Futures
- Any timeframe — M1 to MN (best on M15/H1/H4 for swing)
- Any broker — works with tick volume or real volume
- Non-repainting — all signals on closed bars only
- Works on VPS — no manual intervention
What You Get
- Clean, commented .mq5 source code
- Compiled .ex5 ready for MT5
- Full parameter documentation
- Wyckoff schematic quick-reference guide
- Installation guide
- Lifetime updates
How It Differs from "Pattern" Indicators
| Feature | Pattern Indicators | Wyckoff Schematic Detector |
|---|---|---|
| Basis | Price shape only | Volume + Range + Price |
| Repainting | Often yes | Never — closed bars only |
| Subjectivity | High (visual) | Zero (rule-based) |
| Spring/Upthrust | Manual only | Auto-detected |
| Phase logic | Not included | Full 4-phase detection |
| Count guide | No | Yes (cause/effect) |
Part of the Wyckoff Ecosystem
Pairs with:
- Session Countdown Panel ($30) — Know when institutional volume enters (London/NY)
- Global SL/TP Manager ($30) — Manage Wyckoff position SL/TP efficiently
- BoltIQ Gold EA ($59) — Trade Wyckoff phases automatically on XAUUSD
Learn more: Read Article 3 "Automating Wyckoff Phase Detection" (coming to MQL5 Articles)
Disclaimer
This indicator identifies Wyckoff structures algorithmically. It does not guarantee profitable trades. Wyckoff analysis requires context, experience, and risk management. Past performance of Wyckoff setups does not guarantee future results. Always use stop losses and position sizing.
Support
Post-delivery bug-fix support included. Feature requests and customization available via MQL5 Freelance.