iCustom MQ5 Drawing Tools - A Suggestion
I see you write a lot of suggestion in forum.
Sorry, I never use Gann, so I have to re-read and re-read you post again. However, can you give a simple example of your last request - the TimeToBarCount() option ?.
I see you write a lot of suggestion in forum.
Sorry, I never use Gann, so I have to re-read and re-read you post again. However, can you give a simple example of your last request - the TimeToBarCount() option ?.
Hi phi.nuts.
I actually only wrote 2 suggestions. I only used the Gann Grid as an example.
1. Make a system where the user can create and or edit the tools of Mt5.
John might like the way Mt4 did the Gann Grid, Paul might like the way Mt5 does the Gann Grid, Peter might want to make a different, new way to put Gann Grids on his charts. By making the tools modular and allowing the users access to that code (you can code it in mq5), you allow John to be John, Paul to be Paul.... you get the idea.
2. TimeToBar
Just like I can say:-
comment("My dog is ",DoubleToString(varDogsAge,2)," years old.");
I would like to be able to say:-
ObjectCreate("MyTrendLine",0,time[TimeToBar(2012.12.07 00:00)],varPrice1,time[TimeToBar(2012.12.09 04:00)],varPrice2);
It took me AGES to figure out that Time[5] in Mq4 = time[5] in mq5 because typing Time or time does not bring the popup to show it is a reserved word. These 'missing' bits of info are not obvious and are not mentioned in the help files. Just like Mt4 help shows a 1 or 2 line piece of code that shows LOTS about how the syntax works, but for some reason the mq5 help has no sample code.
In Mt4, the current Bar = 0, while in Mt5, the First bar = 0. This is a big difference, in a way it seems (to mt4 coders) backwards. I know it is actually better this way, each bar remains the same without having to change values each new bar, but the 'how' to work with this is not mentioned, or if it is, I have not found it in the help files.
If I want to know what the High of 20 Bars before the current Bar was, how do I do it?
If I want to calculate a ratio of Price up or Price down of a Trend Line, I need to know how many bars 'long' it is. Using date does not give me this if there is either a missing piece of time in my chart history, or if there was a public holiday. I can not simply say TimeStart (in seconds) - TimeEnd / period/60 = Barcount. If you think you can, then try it out, it works on some timeframes, and gives 2 or 3 bars wrong on others.
Using Time as the lateral axis is fine, but having a way to convert it without major calculations makes life far easier.
I hope this makes it more clear what I am trying to say.
1 . I meant "I see you write a lot of suggestion topics in forum." . Sorry for missing word "topics".
2. I'll re-read your suggestion on object later.
3. If you know the time, you don't need the bar number - but I think you already knows that.
ObjectCreate("MyTrendLine",0,time[TimeToBar(2012.12.07 00:00)],varPrice1,time[TimeToBar(2012.12.09 04:00)],varPrice2);

//--- is equal with

ObjectCreate("MyTrendLine",0,D'2012.12.07 00:00',varPrice1,D'2012.12.09 04:00',varPrice2);
4. Nope. Time[5] in mql4 is not equal with time[5] in mql5. I think you already answered that, when you said "In Mt4, the current Bar = 0, while in Mt5, the First bar = 0."
5. If you want to know what the High of 20 Bars before the current Bar was, you can use CopyHigh function in Timeseries and Indicators Access.
6. If you want to calculate ratio of price movement per bar then you can use CopyTime function also in Timeseries and Indicators Access.
Hope that's helps.
1 . I meant "I see you write a lot of suggestion topics in forum." . Sorry for missing word "topics".
2. I'll re-read your suggestion on object later.
3. If you know the time, you don't need the bar number - but I think you already knows that.
4. Nope. Time[5] in mql4 is not equal with time[5] in mql5. I think you already answered that, when you said "In Mt4, the current Bar = 0, while in Mt5, the First bar = 0."
5. If you want to know what the High of 20 Bars before the current Bar was, you can use CopyHigh function in Timeseries and Indicators Access.
6. If you want to calculate ratio of price movement per bar then you can use CopyTime function also in Timeseries and Indicators Access.
Hope that's helps.
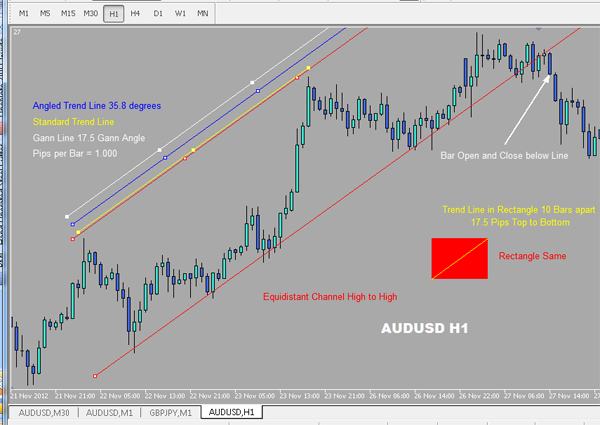
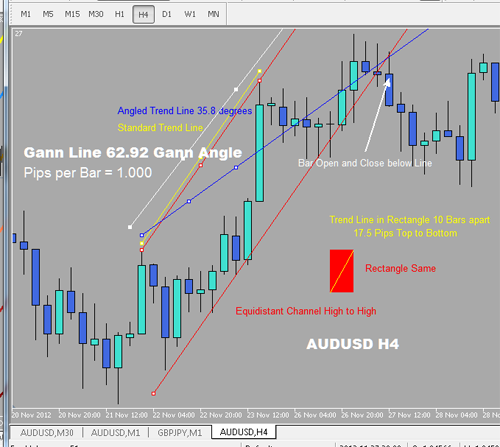
There are two pictures attached. The AUDUSD H1 is the one I set up the lines on, Then I changed the timeframe to H4. I did not change or move any of the lines when I did this.
The Equidistant Channel, the Standard Trendline's and the Rectangle remain at the correct angle. You will notice that The Gann Lines 'angle' (It is actually a ratio, not an angle) changed from 17.5:1 to 69.2:1 This is due to changing from H1 to H4. The 'conversion' should be 70:1 17.5 x 4 = 70 The conversion in fact should actually not occur at all, since the ratio is still 17.5 to one. The minutes per bar has been multiplied by 4, but the scale of the Gann Line should have been altered, not it's ratio, making it 17.5:4. If one changes (which is easy enough to do in code or on screen) the 'angle' to 70 OR the angle back to 17.5 and the scale to 4, then the Gann Line falls back into the same relationship (angle) as it was in H1.
The Angled Trendline, while remaining at 35.8 degrees, is set at that angle to the horizontal level of the screen, it ignores the scale of the chart, so in truth it is useless.
The Standard Trendline, and the Rectangle (as well as triangles and ellipses) keep the correct scale. It might LOOK like a wide rectangle stretched into a tall rectangle, but that is fitting with the H4 scale. It is in proportion. The Angled trendline is only in proportion to the eye.
So, after showing you this little bit, we get back to Time and Barcounts. I make an indicator. It has a Trendline. This Trendline can be placed anywhere at any angle by the user. It has a few options available in the properties section. These are related to what the user wants, if he wants the indicator to trigger the EA to buy,sell or close on touch, open and close beneath or above the line, he sets these options as he likes.
Now at any time, he can change timeframe, or move the trend to where he feels it is better to catch the trend reversal.
To calculated the angle of the line in relation to the current price, one needs a reliable method of calculation. Knowing that the timeframe is H4, and knowing (ObjectGet) the upper and lower prices of the trendline as well as the time, start and end. We have 4 simple values to work with. One can subtract closest time of the trendline from current time, divide it by 240 (in the case of the H4 timeframe)/60 then multiply the that 'distance' by the ratio of the trend line (calculated height/time/60 to work with the same unit) to calculate the relationship of the current price has with the ray of the trendline. In other words to calculate when it passes below (in this case) the trendline.
Now all that calculating has complications, I know this because I have had them. The different timeframes for some reason I do not truly know, CHANGE the bar to time ratio. Not always, and not by much, but 2 Bars is enough to change the calculated angle enough to mess up a trade.
The user might or might not attach the trendline to a high or low, so CopyHigh is not an option in this case. Even if the user DOES attach it to a high or low, it is not worth the effort to write the code to see if it is true or not because it makes no difference.
If however the x axis (time) and y axis (price) were easy to translate into bars (as has now been done with Gann Scale of pips per bar) then the calculations become simple and there is no room for 'missing' bars.
TrendLine Height = top_y-bottom-y
TrendLine 'Width' = end_x -start_x (converted by TimeToBarCount)
x_Distance = current_x(which I discovered is rates_total) - end_x
So all is done in the same unit with ease. Timeframe conversion calculations are not needed at all since the bar to bar ratio remains the same regardless of if the timeframe is changed.
One can go to visit his friend by walking to town, catching a bus, then getting on a plane, spend the night in a hotel, catch another plane, and another taxi and another walk and then knock on his friends door. Or he can just walk across the road in the first place because his friend is his neighbour.
And this does not helps ?
phi.nuts:
...
6. If you want to calculate ratio of price movement per bar then you can use CopyTime function also in Timeseries and Indicators Access.
Hope that's helps.
hi BlueMental , use CopyTime function is quite easy than TimeToBarCount() to get bars count. Just try it, pls.
How to use it? Help shows nothing, no code, no explanations of any kind.
Call by the first position and the number of required elements
|
int CopyTime( |
Call by the start date and the number of required elements
|
int CopyTime( |
Call by the start and end dates of a required time interval
|
int CopyTime( |
Parameters
symbol_name
[in] Symbol name.
timeframe
[in] Period.
start_pos
[in] The start position for the first element to copy.
count
[in] Data count to copy.
start_time
[in] The start time for the first element to copy.
stop_time
[in] Bar time corresponding to the last element to copy.
time_array[]
[out] Array of datetime type.
Return Value
Returns the copied data count or -1 in case of an error.
None of this tells me how to get either the sta required from a trendline (call it TrendLine001)
All of the mql5 help is written this way. No
Here is what the help file gives from Mt4 for IMA():- This is taken from the Navigator window, which offers Files\Dictionary\Search
Parameters:
Sample: AlligatorJawsBuffer[i]=iMA(NULL,0,13,8,MODE_SMMA,PRICE_MEDIAN,i); |
In the Mql5 MetaEditor, there is inly files in the Navigator. From the Help menu, when searching for 'CopyTime' I get "No Topics Found",
by typing the code "CopyTime" into the editor, and pressing F1, gets me to the help section, or after searching through the program, under the help section, one can find it under "MQL5 Reference".
MT4, everything there and easy to find, and once it is found, a simple line of code that SHOWS what the code is and does, and also what it needs.
MT5, Everything hidden, can't be found and isn't explained. Usually no code.
with iMA() there is code shown in the help file, an entire indicator.
An example, with Mt4, I create a new custom indicator. in the int start() section I type in one line of code :- Comment(iMA(NULL,0,13,0,MODE_EMA,PRICE_CLOSE,10));
I compile the file and attach the indicator and it tells me the value of an 13 bar EMA at bar 10 of whatever Timeframe it the chart is on.
In Mt5, I start a new custom indicator. in the OnCalculate() section I type in one line of code:-
iMA(NULL,0,13,10,MODE_EMA,PRICE_CLOSE);
The comment on the chart says '10'
The 'help' file does not explain that the iMA() has to have a handle, that I have to use the CopyBuffer procedure to get the data of the iMA() using the handle, that I then have to fill an array FROM the buffer I just copied, not to mention that I have to add all sorts of if then else sequences and failsafes to finally have access to :-
string comm=StringFormat("%s ==> Updated value in the indicator %s: %d",
TimeToString(TimeCurrent(),TIME_DATE|TIME_SECONDS),
short_name,
values_to_copy);
//--- display the service message on the chart
Comment(comm);
So yes, it is easy to say 'use CopyTime'.
Use CopyTime with what? How? with which of the 500 predefinitions which are not explained anywhere in the help files.
This new 'advanced' mql5 is the reason why right now I have Mt4 running, I have 6 Timeframes of AUDUSD open and each of these 6 timeframes have 3 indicators running. 1 indicator small and simple that tells me how many minutes and seconds to the next bar, the other 2 indicators having 8 EMA's each that have to be looped 3 times each for the complex calculations added to them. Mt4 is running fast as ever, no lags, no stress.
Mt5 however... has 5 AUDUSD timeframes with 1 indicator each, this indicator has 16 EMA's (the same as those in Mt4, with the same calculations), however if one changes the Base MA period (the other 15 are derived from that), the Mt5 one deviates and the 15 other ema's go south. not only that, the program hangs (not always but often) for +- 40 seconds before updating the ema's.
It is possible (in fact most likely) that there is code error in my mq5 that is causing the hangups. But it makes zero sense to have to do 500 things where a plain and simple 1 does it easily (as is the case with Mt4).
Occams Razor - If something is not needed in a system or it causes complications to that system, it is an infliction, eradicate it.
Less is more.
How to use it? Help shows nothing, no code, no explanations of any kind.
...
Occams Razor - If something is not needed in a system or it causes complications to that system, it is an infliction, eradicate it.
Less is more.
We - I repeat : we - can see that you like writing. Let me remind you, that you're not the only forumer around here. There's no need for you to copy the documentation and paste them in forum and so there's no need for the rest of us to read unnecessary repeated information, just gives a link.
If you like reading as much as like writing (which I doubt), then you will have no problem understanding CopyTime or other Copy... function without anyone help.
And you also should read (and do) what you have write : excessive writing is not needed, so eradicate the writing: less writing is more.
So please edit your comment first, and I'll help you to focus on using CopyTime function than focus on your writing.
And please do more reading (since you capable of reading English, read that CopyTime documentation again, it's already clear enough if you can focus on it).
You obviously missed the point in all the writing I have put from the beginning to the end and since it is so easy to give one line of code as an example, then why have you not done so with all your helpful ways?
- Free trading apps
- Over 8,000 signals for copying
- Economic news for exploring financial markets
You agree to website policy and terms of use
Greetings all.
I am BlueMental, and though I am familiar with mq4, mq5 is very new to me. It has enormous scope and I look forward to learning as I go.
As the Subject above states, I would like to make a suggestion to the Metaquotes coders/designers.
As a user of the Mt4/Mt5 trading platform, I wish to place (for example) a Gann Grid on my chart. So I use the drawing tool appropriate and do so. The way it works in Mt4 is simple and effective. You can easily adjust the angle (scale) by dragging the start and end of the main Grid Line. To change the 'width' of the grid, in other words how far apart each line is from the next, all one has to do is change the time placement of either the start or end time in the properties section. While in instrument form, for some reason (bug) if one changes the scale of the grid, it does not change on the chart, so one has to delete the object (in code of instrument) and then redraw it after changing scale. That places the 'new' grid at the Time/Price coordinates with the new scale intact.
Mt5 addressed this in a way, and gave us a different way of adjusting the Gann Grid. One can move it around and adjust the 'width' or time placement, but not the scale. To do that, one needs to put a new datum in the properties in number form. One other problem is that to place the start of the grid on a precise Price point, for example on High of Bar x, then one has to do this by number in the properties of the grid. The mouse drag, if used on the start position automatically changes the 'width' without changing the price level. To change the price level, one needs to drag the centre of the main grid line. This in turn means that one can not 'magnet click' the start price. It can only be done by eye.
So in Mt4, it was easy enough for me to write an indicator where I place a trend line, called 'ScalePriceLine' at a fixed start position. It started on Time [5],Low[5] and ended on Time[1],High[1] while a second line called 'WidthLine' was placed at Time[5],Low[5] and ended on Time[1],Low[5]. With a bit of calculating to convert Price change:time into scale, one could use the ScalePriceLine to change the Gann Grid Start Point, End Point and Scale. While the width of the Grid is changed by altering the Time width of the WidthLine (regardless of price change). This means that if the user moves or changes the ScalePriceLine, the indicator would move the WidthLine to be at the Start coordinates of the ScalePriceLine, and if the user changes the Width, then the ScalePriceLine end coordinate is changed while keeping the same angle(scale).
The way that Mt4 works is that the indicator only responds or acts with a new tick or chart change. The other thing that the indicator allows is for the minutes per bar ratio to be taken into account so that regardless of if the grid is on m5 or H4, the angle remains the same and the Grid starts on the same low and goes through the same high regardless of the timeframe. There were problems of minutes/period=bars moved, specially on the longer timeframes, because the weekends and public holidays showing no trade had to be accounted for. Never the less, it was solvable (yes a for loop count of bars from 0 to end of ScalePriceLine's Time).
So my suggestion is this, it would be great if the Mt5 program allowed the user to create 'custom' drawing tools. This is probably already achievable via script since one can 'activate' Mt5 without having to wait for a tick. But what I am proposing is an substructure that allows us users to write code that gives us wysiwyg drag and place of lines/ellipses/user defined grids or whatever just as the Mt5 drawing tools operate.
Let us say that I would like to see vertical and horizontal crosshairs on my trendlines while I drag them because it makes it easier for me. I would like to be able to open the existing trendline code and just add a few lines to achieve this. Or let us say that I would like to use Blue on up angled lines and Red on down angled lines, I would like to be able to access and edit the code and to create my own if I wished.
This in turn could allow us users to offer 'JohnsEllipseWithFibRayLinesInPinkAndBlue.q5t' (.q5t -q5 tool- being the file type for example) to the other MQL users and abusers.
Please feel free to comment. Since I am new with Mt5 it might easily already be possible to do what I am suggesting but not in a formal 'Click Tools/Design on menu' kind of way with a file type of its own. If it is, then just slap me upside the head and tell me to stop wasting everyones time and energy :).
The Metaquotes coders/designers have put an incredible amount of effort and energy into producing a seriously brilliant trading architecture. In a way, Metaquotes is responsible for getting Forex Trading from the 'Elite Institution' structure that it used to be to the 'Open to the Public' trading structure it now is. Without them there would be no 'us' to sit and talk shop about coding EA's or Indicators.
MT4 is like the Traders foundation with an infrastructure so well entrenched that if one were to say, "I trade Forex," his living dictionary would include 'indicator, EA, mq4'.
I thank whoever the person/people whoever they are who first came up with the idea of creating the Mt1 (most of us have never seen anything other than Mt3,Mt4 and Mt5) in the first place.
BlueMental, over and out.
<edit> Something else I realised I left out. It would also be great to have a TimeToBarCount() option.</edit>