EURUSD Technical Analysis 2016, 21.08 - 28.08: Fibo resistance with ascending triangle to be broken for the daily bullish to be resumed
Forum on trading, automated trading systems and testing trading strategies
EURUSD Technical Analysis 2016, 14.08 - 21.08: daily ranging inside Ichimoku cloud for direction
Sergey Golubev, 2016.08.14 07:39
Daily price broke one of the 'reversal' Senkou Span line of Ichimoku indicator together with trendline to above: the price broke this line to be located inside Ichimoku cloud in the bearish ranging area of the chart waiting for the direction. Absolute Strength indicator is estimating the trend to be on ranging waiting for breakout/breakdown, and Trend Strength inticator is evaluating the future possible trend as the possible daily bullish reversal.
If D1 price breaks 1.1045
support level on close bar together with descending triangle pattern to below so the primary bearish trend will be resumed.
If D1 price breaks 1.1233
resistance level on close bar from below to above so the bullish
reversal will be started.
If not so the price will be on bearish ranging within the levels.
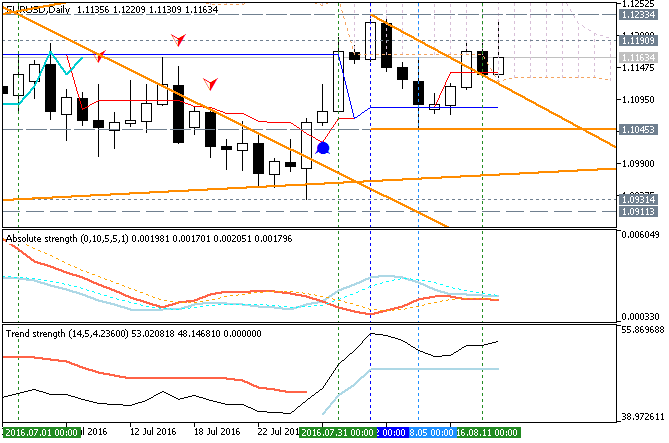
- Recommendation for long: watch close D1 price to break 1.1233 for possible buy trade
- Recommendation
to go short: watch D1 price to break 1.1045 support level for possible sell trade
- Trading Summary: ranging
| Resistance | Support |
|---|---|
| 1.1233 | 1.1072 |
| N/A | 1.0931 |
SUMMARY : ranging bearish
hi. can you please have a technical analysis by your below method .
It may be tomorrow (when market will be opened).
By Ichimoku indicator?
It may be tomorrow (when market will be opened).
EUR/USD Intra-Day Technical Analysis - breaking key support level for the correction to be continuing
H4 price is located to be above Ichimoku cloud in the bullish area of the chart: the price was started with the local downtrend as the secondary correction within the primary bullish market condition by 1.1270 support level to be breaking for the correction to be continuing.
If H4 price breaks 1.1366 resistance level on close bar from below to above so the bullish trend will be resumed.
If not so the price will be on bullish ranging within the levels.
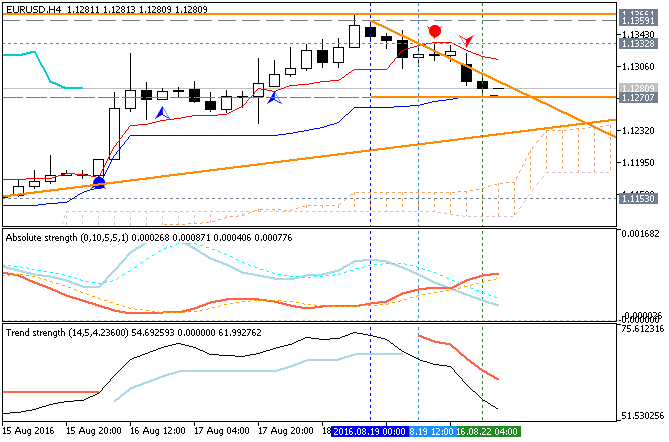
- Recommendation for long: watch close H4 price to break 1.1366 for possible buy trade
- Recommendation
to go short: watch H4 price to break 1.1270 support level for possible sell trade
- Trading Summary: ranging
| Resistance | Support |
|---|---|
| 1.1332 | 1.1270 |
| 1.1366 | 1.1153 |
SUMMARY : bullish
EUR/USD Intra-Day Technical Analysis - breaking key support level for the correction to be continuing
H4 price is located to be above Ichimoku cloud in the bullish area of the chart: the price was started with the local downtrend as the secondary correction within the primary bullish market condition by 1.1270 support level to be breaking for the correction to be continuing.
If H4 price breaks 1.1366 resistance level on close bar from below to above so the bullish trend will be resumed.
If not so the price will be on bullish ranging within the levels.
- Recommendation for long: watch close H4 price to break 1.1366 for possible buy trade
- Recommendation
to go short: watch H4 price to break 1.1270 support level for possible sell trade
- Trading Summary: ranging
| Resistance | Support |
|---|---|
| 1.1332 | 1.1270 |
| 1.1366 | 1.1153 |
SUMMARY : bullish
The situation was not changed since this morning: the price broke trendline for 1.1330 resistance level to be testing, but it is still on ranging market condition within 1.1366/1.1270 support/resistance levels. So, nothing was changed so much.
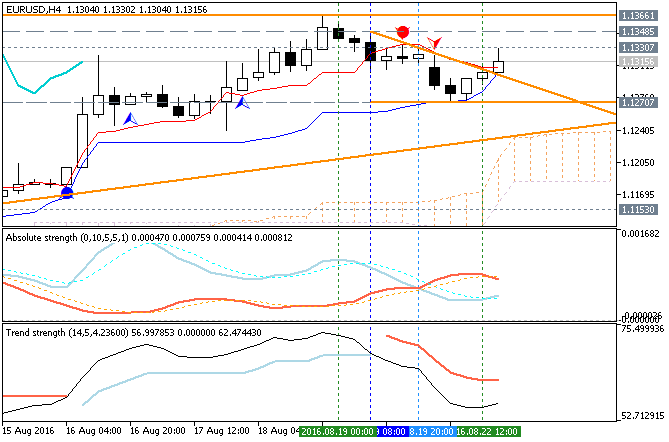
There will be some medium impacted fundamental news events related to EUR/USD tomorrow: (Euro/German PMI news events) so we can expect some more movement.
Forum on trading, automated trading systems and testing trading strategies
Sergey Golubev, 2016.08.23 14:26
Technical Targets for EUR/USD by United Overseas Bank (based on the article)
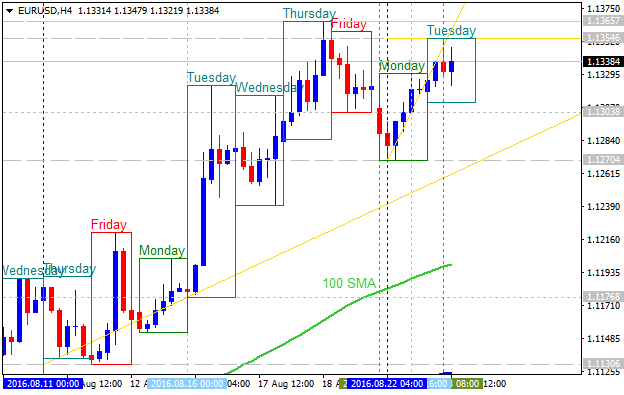
H4 price
is located above 100 SMA/200 SMA for the bullish market condition: the
price is on ranging within
the following support/resistance
levels:
- 1.1354 resistance level located above 100 SMA/100 SMA in the bullish area of the chart, and
- 1.1270 support level located near and above 100 SMA in the beginning of the secondary correction to be started.
Daily
price. United Overseas Bank is expecting for EUR/USD to be continuing with the bullish market condition:
"While stops for s/t bullish view is still intact at 1.1240, the recent price action is lackluster and the odds for extension to the 1.1430 high seen on the day of Brexit are not very high. EUR has to clear the recent 1.1365 peak in an ‘impulsive manner’ before a sustained up-move can be expected."
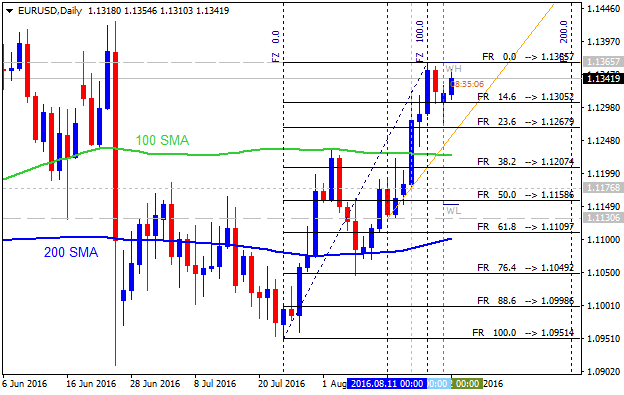
- If daily price breaks 1.1365 resistance level
on close bar so the bullish trend will be continuing.
- If daily price breaks 1.1109 support level on close bar so the reversal of the price movement to the primary bearish market condition will be started.
- If not so the price will be on bullish ranging within the levels.
EURUSD Technical Analysis: daily correction with 1.1240 as a key level
Daily price is located above Ichimoku cloud in the bullish area of the chart: the price is started with the secondary correction with 1.1240 support level to be tested for the correction to be continuing.
- Chinkou Span line of Ichimoku indicator is above the price indicating the correction to be continuing in the near future.
- Absolute Strength indicator is estimating the correction within the primary bullish trend.
- Trend Strength indicator is forecasting the trend as the ranging bullish.
If D1 price breaks 1.1240 support level to below on daily close bar so the local downtrend as the correction within the bullish market condition will be started.
If D1 price breaks 1.1130 support level to below on close bar so we may see the bearish reversal to be started on this timeframe.
If not so the price will be bullish ranging within the levels.
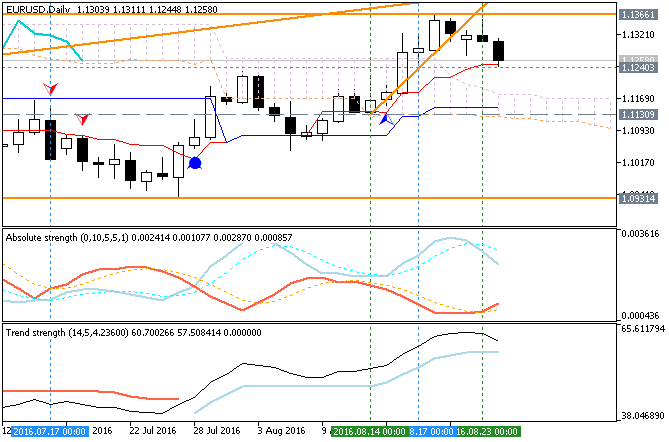
- Recommendation for long: watch close D1 price to break 1.1366 for possible buy trade
- Recommendation
to go short: watch D1 price to break 1.1240 support level for possible sell trade
- Trading Summary: correction
| Resistance | Support |
|---|---|
| 1.1366 | 1.1240 |
| N/A | 1.1130 |
SUMMARY : bullish
Forum on trading, automated trading systems and testing trading strategies
Sergey Golubev, 2016.08.25 10:12
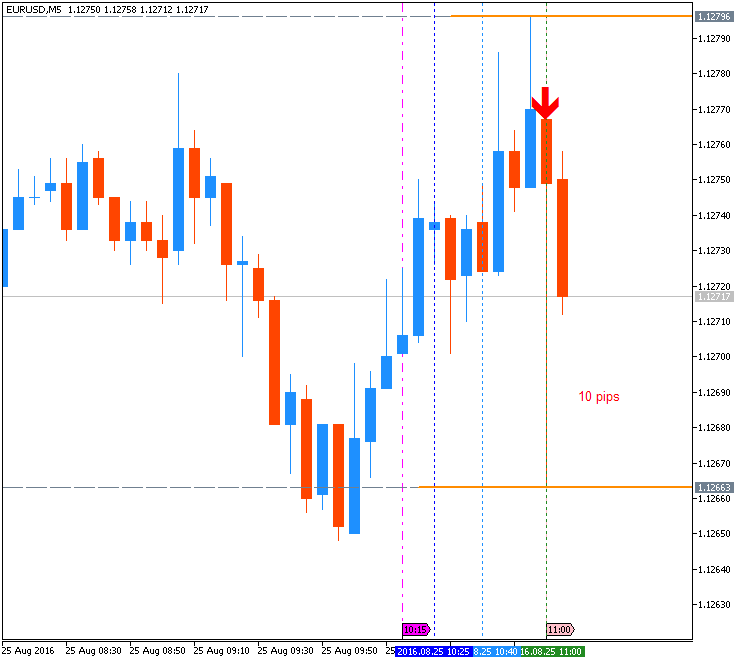
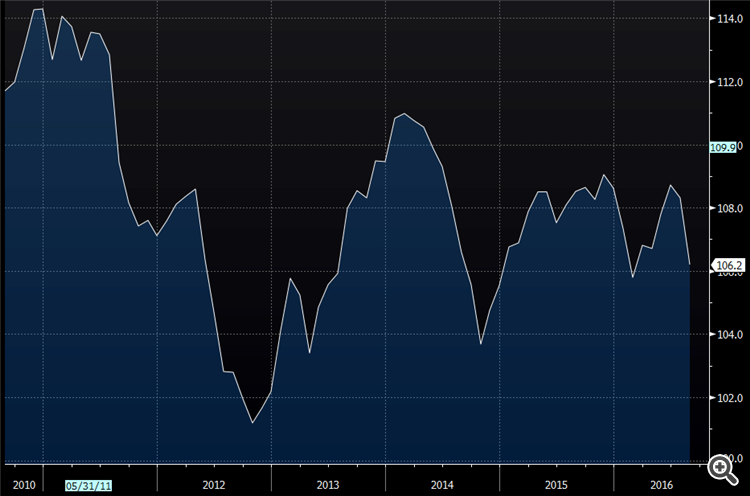
EUR/USD Intra-Day Fundamentals: German Ifo Business Climate and 10 pips price movement
2016-08-25 08:00 GMT | [EUR - German Ifo Business Climate]
- past data is 108.3
- forecast data is 108.5
- actual data is 106.2 according to the latest press release
if actual > forecast (or previous one) = good for currency (for EUR in our case)
[EUR - German Ifo Business Climate] = Level of a composite index based on surveyed manufacturers, builders, wholesalers, and retailers.
==========
==========
EUR/USD M5: 10 pips price movement by German Ifo Business Climate news event
Forum on trading, automated trading systems and testing trading strategies
Sergey Golubev, 2016.08.22 18:29
The situation was not changed since this morning: the price broke trendline for 1.1330 resistance level to be testing, but it is still on ranging market condition within 1.1366/1.1270 support/resistance levels. So, nothing was changed so much.

There will be some medium impacted fundamental news events related to EUR/USD tomorrow: (Euro/German PMI news events) so we can expect some more movement.
The H4 price broke trendline to above with 1.1290 resistance level to be testing for 1.1366 target for the bullish trend to be continuing. Alternative, if the price breaks 1.1244 support to below so the local downtrend as the secondary correction within the primary bullish trend will be started.

By the way, the bearish reversal level for this H4 timeframe is 1.1153, and if the price breaks this level to below so the bearish reversal will be started.
- Free trading apps
- Over 8,000 signals for copying
- Economic news for exploring financial markets
You agree to website policy and terms of use
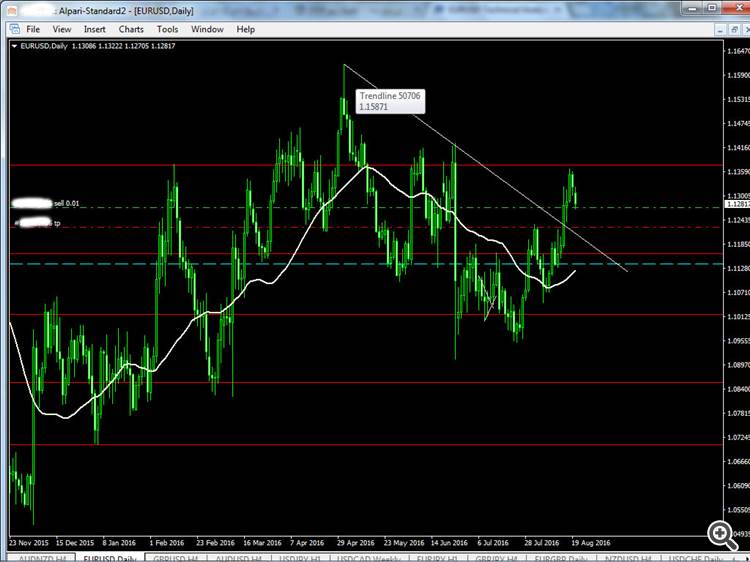
Daily price broke 100 SMA/200 SMA ranging reversal area for the primary bullish market condition:
- The price is on testing with Fibo resistance level at 1.1366 to above for the bullish trend to be continuing.
- RSI indicator is estimating the bullish ranging to be started.
- Ascending triangle pattern was formed by the price to be crossed from below for the bullish condition to be resumed.
If D1 price breaks Fibo resistance level at 1.1366 to above on close bar so the primary bullish trend will be resumed.If D1 price breaks Fibo support level at 1.1084 from above to below so the reversal of the price movement from the primary bullish to the primary bearish market condition will be started.
If not so the price will be bullish ranging within the levels.
SUMMARY : bullish
TREND : ranging