Forecast for Q3'16 - levels for DAX Index
Forum on trading, automated trading systems and testing trading strategies
Sergey Golubev, 2016.07.07 12:58
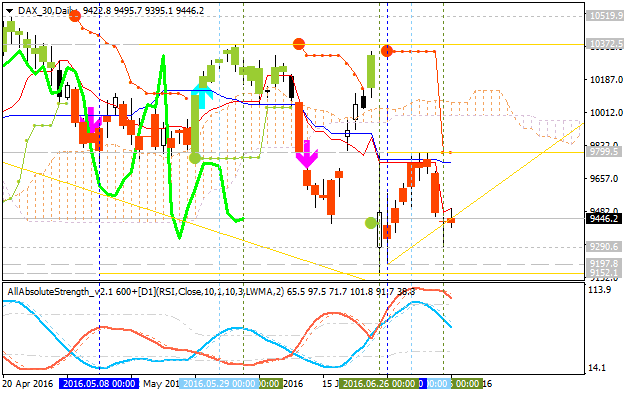
DAX Index Technical Analysis: bearish ranging within key narrow levels (adapted from the article)
Daily price is located below Ichimoku cloud on the bearish area of the chart for the ranging within 9799.5 resistance level and 9152.1 support level:
- "While the trend structure in recent months isn’t very clean, there is a series of lower highs and lower lows continuing to develop. With a little more weakness that price sequence could further mature itself in the not-too-distance future. As long as the DAX remains below the recent swing high at 9812 (another lower high), the next lower low would arrive on a drop below the 6/24 low at 9161."
- "For now, we will continue to view the DAX through a bearish lens given its poor technical posturing and relative weakness. If a lower low from here can develop, there isn’t much preventing it from picking up momentum towards the February low at 8695. This would certainly be consistent with the downward trend in place since the record highs set in April 2015. On the flip side, if the DAX turns higher from here, indicating a successful retest of the recent lows, and can hurdle the recent swing high then we would need to consider bullish alternatives."
Chinkou Span line is below the price indicating the ranging condition by direction.
If D1 price will break 9152.1
support level on close bar so the bearish trend will be continuing.
If D1 price will break 9799.5
resistance level on close bar from below to above so the local uptrend as the bear market rally will be started.
If not so the price will be on ranging within the levels.
| Resistance | Support |
|---|---|
| 9799.5 | 9290.6 |
| 10372.5 | 9152.1 |
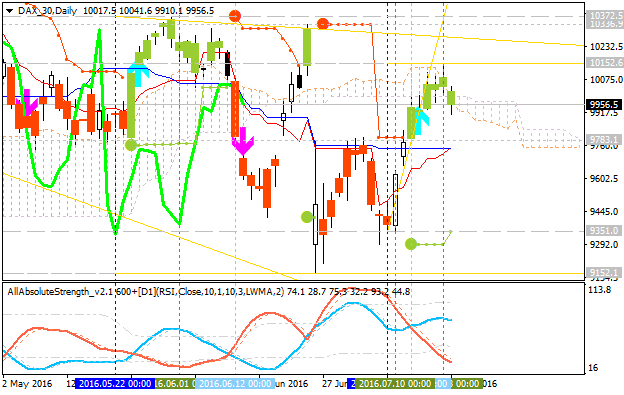
DAX Index Technical Analysis: daily ranging inside Ichimoku cloud waiting for direction of the trend
Daily price is on ranging inside Ichimoku cloud waiting for the direction of the trend to be started within the following key reversal support/resistance levels:
- 10152.6 resistance level located above Ichimoku cloud in the beginning of the primary bullish trend on the chart, and
- 9783.1 support level located below Ichimoku cloud in the beginning of the primary bearish trend.
If D1 price breaks 9783.1
support level on close bar so the primary bearish trend will be resumed with 9351.0 possible bearish target.
If D1 price breaks 10152.6
resistance level on close bar so the reversal of the price movement to the primary bullish market condition will be started with 10372.5 possible bullish target to re-enter.
If not so the price will be on ranging within the levels.
| Resistance | Support |
|---|---|
| 10152.6 | 9783.1 |
| 10372.5 | 9351.0 |
SUMMARY : ranging
Forum on trading, automated trading systems and testing trading strategies
Sergey Golubev, 2016.07.25 13:23
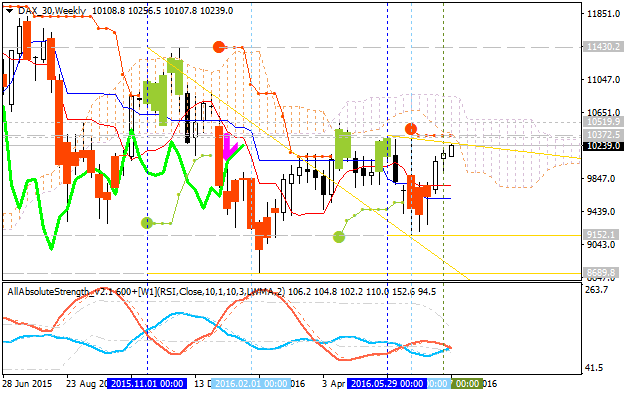
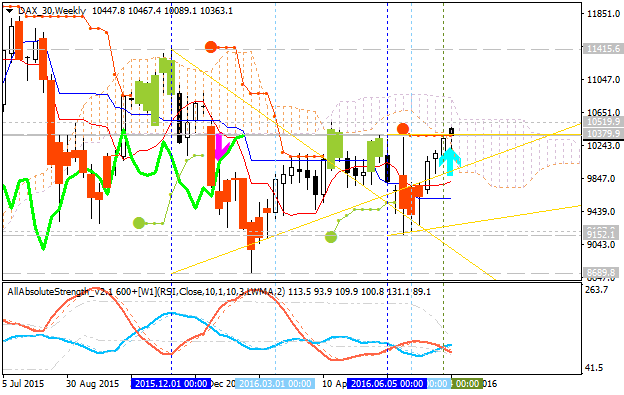
Dax Index Weekly Outlook - possible weekly bullish reversal (adapted from the article)
"Germany’s DAX Index climbed 1 percent, with 28 of its 30 companies advancing. It was one of the biggest gainers in western Europe. France’s CAC 40 Index added 0.7 percent, while the U.K.’s FTSE 100 Index gained 0.1 percent."
Weekly price
is on bear market rally for resistance level at 10,372.5 to be testing for the 10,519.9 level as a nearest target to re-enter. If the price breaks this 10,519.9 resistance level to above so the reversal of the price movement from the bearish to the primary bullish condition will be started, otherwise - the price will be on bearish ranging within the levels near 'reversal' Senkou Span line and Ichimoku cloud.
- If the price breaks 10,519.9 resistance level on close W1 bar so the bullish reversal will be started.
- If the weekly price breaks 9,152.1 support so the bearish trend will be continuing.
- If not so the price will be ranging within the levels.
| Resistance | Support |
|---|---|
| 10,372.5 | 9,152.1 |
| 10,519.9 | 8,689.8 |
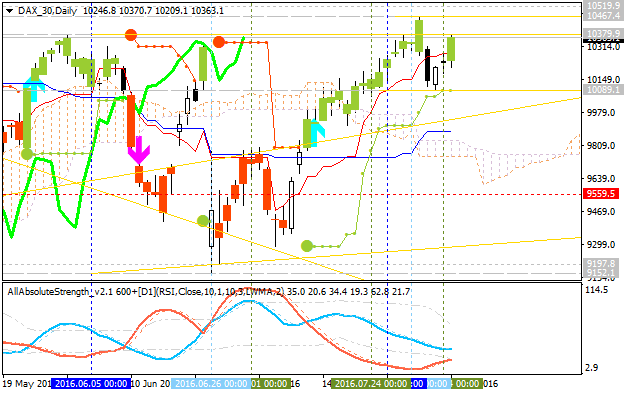
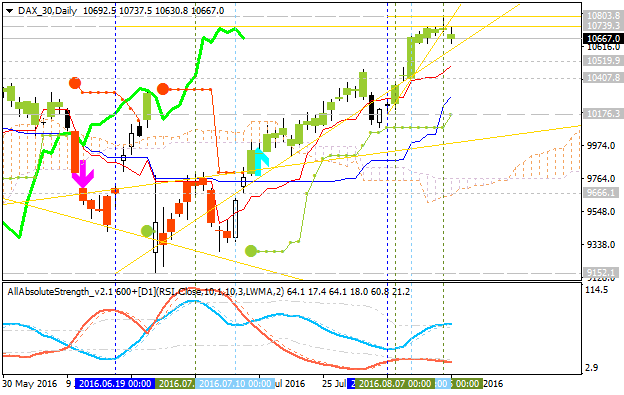
Dax Index Technical Analysis 2016, 07.08 - 14.08: daily bullish ranging within key narrow s/r levels; weekly bullish reversal
Daily price is located above Ichimoku cloud in the bullish area of the chart for the ranging within key narrow support/resistance levels:
- 10,467.4 resistance level located above Ichimoku cloud in the bullish area of the chart, and
- 10,089.1 support level located above Ichimoku cloud in the beginning of the secondary correction to be started.
Absolute Strength indicator is evaluating the ranging condition to be continuing.
If D1 price breaks 10,467.4 resistance level on close bar from below to above so the bullish trend will be continuing.
If not so the price will be on bullish ranging within the levels.
| Resistance | Support |
|---|---|
| 10,467.4 | 10,089.1 |
| N/A | 9,559.5 |
SUMMARY : ranging bullish
Forum on trading, automated trading systems and testing trading strategies
Sergey Golubev, 2016.08.16 14:40
DAX Index Technical Analysis: daily bullish ranging within narrow levels waiting for breakout/breakdown (adapted from the article)
Daily price is on primary bullish market condition: price is testing 10,739.3/10,803.8 support levels to above for the bullish trend to be continuing.
- "The mutli-week rally in the DAX is showing signs of momentum slowing, with the net change amounting to basically zero since shooting higher by 2.5% last Tuesday. Yesterday’s small reversal day created a little doubt heading into today, but no significant resistance has yet been met, so the minor decline off yesterday’s highs looks likely to be short-lived before another push higher takes shape."
- "The area around 10900 is targeted before a more meaningful decline may set in; 10876 represents the 12/29 high, while not far above lies the upper parallel to the trend-line extending off the 2/11 low under the 6/24 ‘Brexit’ mini-crash low. Trend-line support below 10600 is viewed as the next best spot to look for the DAX to turn higher. If it doesn’t, then support should come in around the April peak just beneath 10500. If the advance is to continue towards the next objective surrounding 10900, then the DAX shouldn’t fall much beneath the April high."
If the price breaks 9,666.1 support level to below so the reversal of the price movement from the primary bullish to the primary bearish market condition will be started.
If the price breaks 10,803.8 resistance level so the price bullish trend will be resumed.
If not so the price will be ranging within the levels.
| Resistance | Support |
|---|---|
| 10,739.3 | 10,407.8 |
| 10,803.8 | 9,666.1 |
SUMMARY : bullish
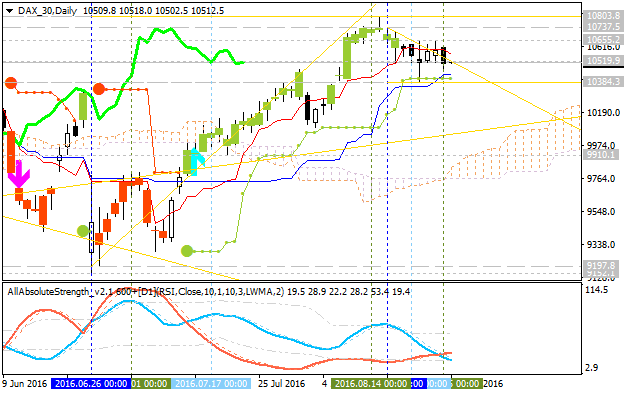
DAX Index: End Of Week Technicals - Daily Correction
Daily price is above Ichimoku cloud in the bullish area of the chart for the ranging within the following support/resistance levels:
- 10,803.8 resistance level located far above Ichimoku cloud in the bullish area, and
- 10,384.3 support level located in the beginning of the secondary correction to be started.
Chinkou Span line of Ichimoku indicator is located above the price for the possible correction in the near future, and Absolute Strength indicator is estimating the the trend as the local downtrend to be started.
If D1 price breaks 9,197.8 support level on close bar so we may see the reversal of the price movement to the primary bearish market condition.
If D1 price breaks 10,803.8 resistance level on close bar from below to above so the bullish trend will be resumed.
If not so the price will be on bullish ranging within the levels.
| Resistance | Support |
|---|---|
| 10,737.5 | 10,384.3 |
| 10,803.8 | 9,197.8 |
SUMMARY : correction
Dax Index Technical Analysis 2016, September: bullish breakout to be continuing or ranging for direction
Daily price is located above Ichimoku cloud in the bullish area of the chart: the price is testing 10,686.2 resistance level together with ascending triangle pattern to above for the bullish trend to be continuing with 10,803.8 resistance as a nearest bullish target to re-enter. Absolute Strength indicator is evaluating the bullish trend to be continuing in the near future.
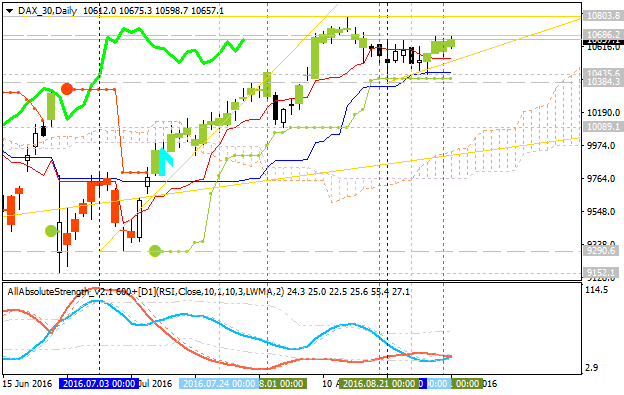
Weekly price is on the breakout with the bullish reversal since the beginning of July this year: price is testing 10,803.8 level to above for the bullish trend to be continuing.
If W1 price breaks 10,803.8 resistance level on close bar from below to above so the bullish breakout will be continuing.If W1 price breaks 10,089.1 resistance level on close bar from above to below so the bearish reversal of the weekly price movement will be started.
If not so the price will be on ranging within the levels waiting for direction.
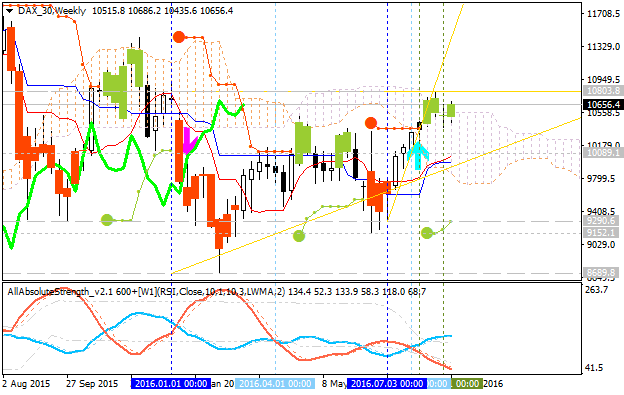
| Resistance | Support |
|---|---|
| 10,686.2 | 10,089.1 |
| 10,803.8 | 9,290.6 |
SUMMARY : bullish
Forum on trading, automated trading systems and testing trading strategies
Sergey Golubev, 2016.09.01 16:19
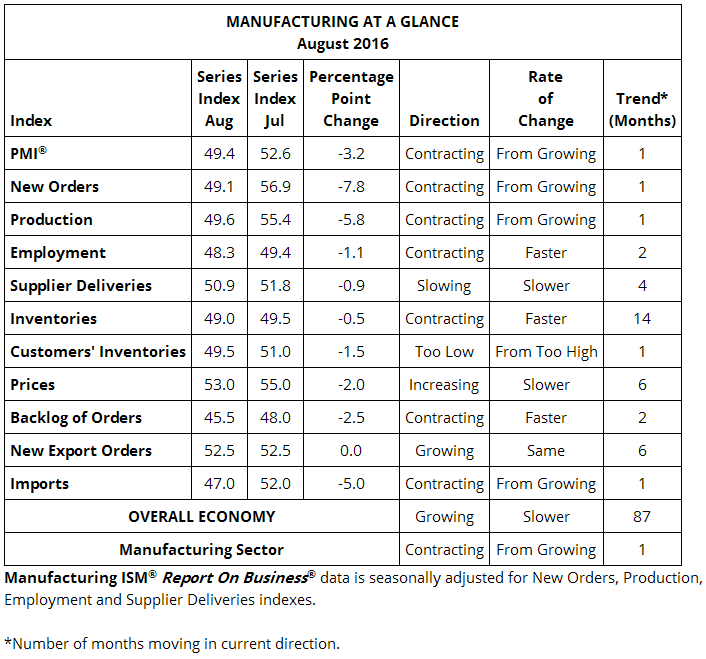
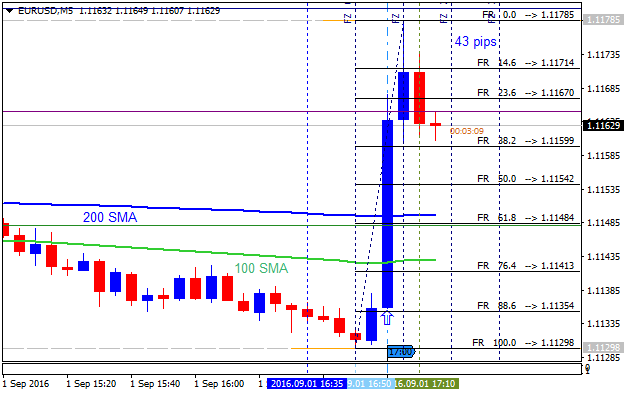
EUR/USD Intra-Day Fundamentals: ISM Manufacturing PMI and 43 pips range price movement
2016-09-01 14:00 GMT | [USD - ISM Manufacturing PMI]
- past data is 52.6
- forecast data is 52.0
- actual data is 49.4 according to the latest press release
if actual > forecast (or previous one) = good for currency (for USD in our case)
[USD - ISM Manufacturing PMI] = Level of a diffusion index based on surveyed purchasing managers in the manufacturing industry.
==========
==========
EUR/USD M5: 43 pips range price movement by ISM Manufacturing PMI news event
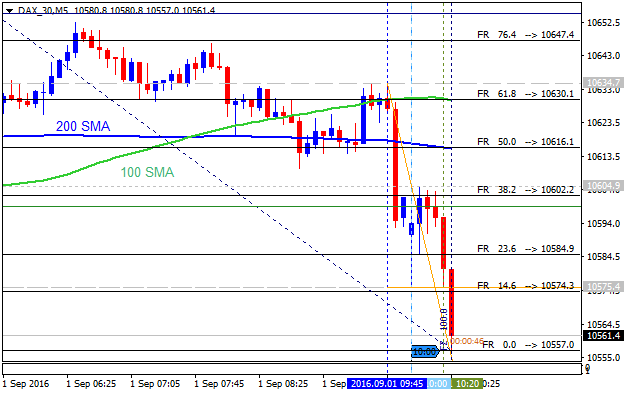
Dax Index intra-day chart (M5 timeframe) is continuing with the bearish trend based on ISM Manufacturing PMI news event for now: the price is testing 10,555.0 support ot below for the bearish trend to be continuing:
Forum on trading, automated trading systems and testing trading strategies
Sergey Golubev, 2016.09.12 13:42
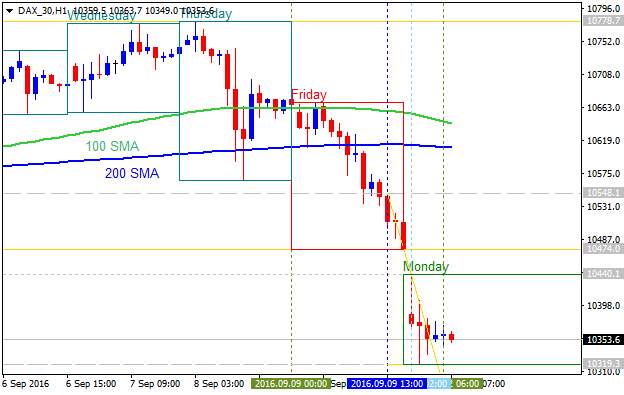
DAX Index: Levels to watch - intra-day bearish breakdown (based on the article)
Hi price broke 100 SMA/200 SMA reversal area to berlow for the bearish market condition. The price is on ranging within 10,440 resistance and 10,319 support level for this morning.
- "The DAX has attempted to regain ground this morning, following the dramatic deterioration we saw Since Friday. The first major resistance level of note here is the key swing low of 10,438, which price has failed to regain."
- "Given the long upper wicks evident on the hourly chart, it seems relatively likely we will see this market start to weaken once more. However, be aware that any failure to fall below 10,311 could set us up for a rebound, given the higher lower scenario."
If H1 price breaks 10,319 support level to below on close bar so the primary bearish trend will be resumed.
If not so the price will be on bearish ranging within the levels
- Free trading apps
- Over 8,000 signals for copying
- Economic news for exploring financial markets
You agree to website policy and terms of use
Quick Technical Overview: Technical Targets for DAX Index - psy level at 10,000.0 to be tested for the bullish reversal
H4 price is on slowly recovering mode after Brexit breakdown: the secondary bear market rally was started with 9.794.1 resistance level to be tested to above for the next bullish reversal target at 9.977.7
If the price breaks 9.977.7 resistance level to above so the intra-day bullish reversal will be started, if the price breaks 9,499.9 support to below so the primary bearish trend will be resumed with 9,152.1 nearest bearish target, otherwise - the price will be on bearish ranging within the levels.
Daily price is on secondary rally with 9,783.3 resistance level to be broken, and the nearest next target is 10,000.0 psy level to be broken to above for the price to be reversed to the primary bullish market condition.