Forecast for Q3'16 - levels for S&P 500
Forum on trading, automated trading systems and testing trading strategies
Sergey Golubev, 2016.07.12 08:14
S&P 500 Sets New Record (adapted from the article)
Analysts at Goldman Sachs estimated that S&P 500 is expected to fall by 3% year over year, but anyway - the daily price is making new high now at 2,137 by bullish breakout for example:
- "U.S. stocks delivered another strong performance Monday, with the S&P 500 climbing to a fresh record high."
- "The benchmark S&P index closed at 2,137.16, up 0.3% for the day, and above its previous record finish, 2,130.82 on May 21, 2015. At the day’s best levels, the S&P hit a new all-time high of 2,143.16."
Technical Analysis - S&P 500 daily bullish breakout with 2,136.50 resistance level to be broken for the bullish breakout to be continuing
Daily price is on bullish breakout which was started last Friday: the price was bounced from Senkou Span reversal line to above together with Chinkou Span line to be crossed the price on close daily bar for the bullish breakout. The price is btesting 2,136.50 resistance level for the breakout to be continuing. Alternative, if the price breaks 2,065.50 support level to below so the reversal of the daily price movement to the primary bearish market condition will be started.
If D1 price will break 2,065.50
support level on close bar so the reversal of the price movement from
the ranging bullish to the primary bearish market condition will be
started.
If D1 price will break 2,136.50
resistance level on close bar so the bullish trend will be continuing without ranging.
If not so the price will be on ranging within the levels.
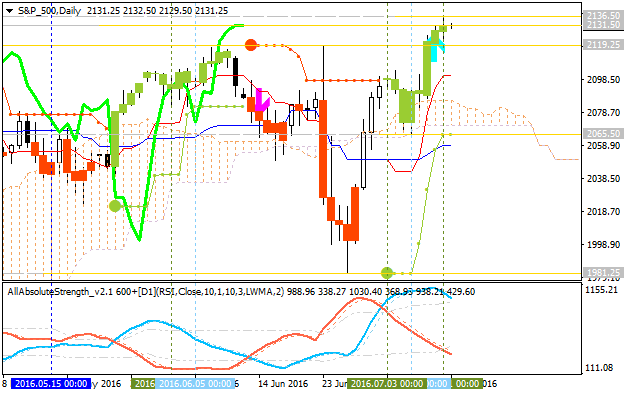
| Resistance | Support |
|---|---|
| 2,136.50 | 2,065.50 |
| N/A | 1,981.25 |
SUMMARY : breakdout
Forum on trading, automated trading systems and testing trading strategies
Sergey Golubev, 2016.07.12 18:51
S&P 500 Short-Term Technical Analysis: watch for key support to be broken for possible sell trade (adapted from the article)
The one hour price is located above 100 period SMA (100 SMA) and 200 period SMA on the bullish area of the chart. The price is breaking 2147.25 resistance level to above for the bullish trend to be continuing.
- "Let’s take a look at the hourly chart: At this time, with the market trading in record territory there is no actual horizontal price levels which act as resistance, obviously. There is a top-side trend-line at this immediate moment extending back to the 7/4 peak which could help contain further momentum today. Just below, is the parallel of the top-side trend-line which crosses under lows made yesterday and today. This small channel will be used as a short-term guide. Stay within or above, then market will remain firm to higher."
- "A break below the channel will put the ‘Brexit’ high at 2127 into focus and not too far below there, the rising trend-line off the 6/27 low. The two angles of influence could very well collide with another, strengthening the 2127 level. A decline below both technical markers would open the door up for a move to the 7/4 high at 2112 (highly unlikely we see this level today without a major catalyst)."
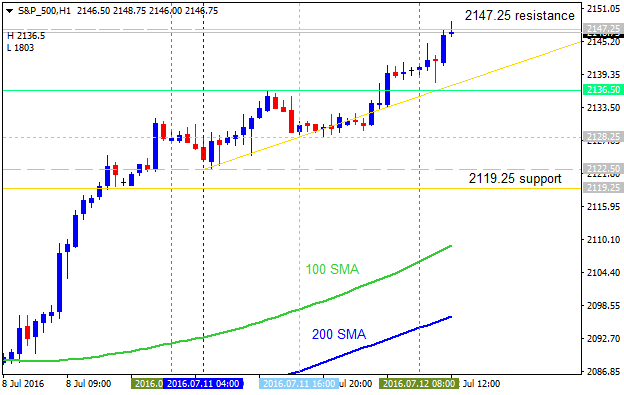
Alternative, breaking 2119.25 level to below will lead to the secondary correction, and if the price breaks support level at 2065.50 so the bearish reversal will be started.
The 4 hour price is breaking 2147.25 resistance together with ascending triangle pattern to above for the bullish trend to be continuing.
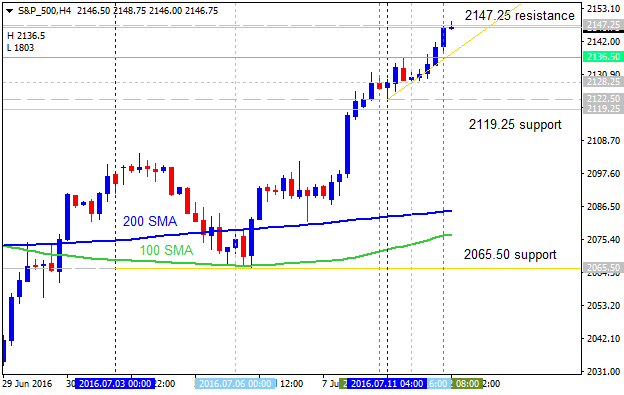
- If H4 price breaks 2147.25
resistance level so the bullish trend will be continuing reversal will be started.
- If H4 price breaks 2119.25 support so the local downtrend as the secondary correction within the primary bullish market condition will be started.
- If H4 price breaks 2065.50 support so we may see the reversal of the price movement from the bullish to the primary bearish condition.
- If not so the price will be ranging within the levels.
| Resistance | Support |
|---|---|
| 2147.25 | 2119.25 |
| N/A | 2065.50 |
S&P 500 Intra-Day Technical Analysis - daily correction to be started
H4 price is located above Ichimoku cloud in the bullish area of the chart. The price was bounced from 2169.50 resistance level to below for the possible correction to be started. Chinkou Span line is crossing the price on open H4 bar to below for the good possible breakdown, and Absolute Strength indicator is estimating the correction within the bullish in the near future.
If H4 price breaks 2148.75
support level on close bar so the local downtrend as the secondary correction will be started.
If H4 price breaks 2169.50
resistance level on close bar so the bullish trend will be continuing.
If not so the price will be on ranging within the levels.
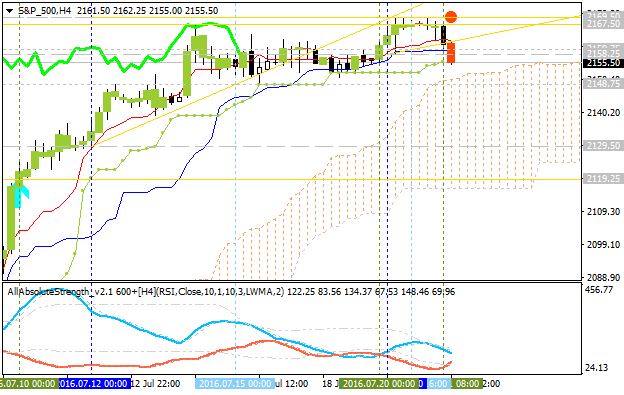
| Resistance | Support |
|---|---|
| 2169.50 | 2148.75 |
| N/A | 2119.25 |
SUMMARY : bullish
Forum on trading, automated trading systems and testing trading strategies
Sergey Golubev, 2016.07.26 16:07
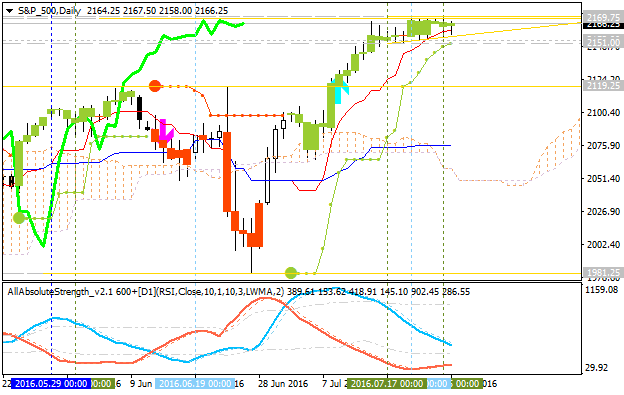
S&P 500 Daily Technicals: correction to be started or the bullish trend to be continuing (adapted from the article)
Sharply Unchanged, Consolidating or Topping?"There are no expectations of the Fed moving away from 0.50%, so the market’s attention will be on any language changes in the statement. It would seem likely this will be a low volatility meeting, however, we should always be on our toes just in case."
D1 price is located above Ichimoku cloud within very narrow support/resistance levels:
- 2169.75 resistance level for the bullish trend continuation, and
- 2151.00 support level for the secondary correction to be started.
Ascending triangle pattern was formed by the price to be crossed to above for the bullish trend to be continuing. And Absolute Strength indicator is estimating the ranging correction to be started in the near future.
If D1 price breaks 2151.00
support level on close bar so the local downtrend as the secondary correction will be started.
If D1 price breaks 2169.75
resistance level on close bar so the bullish trend will be continuing.
If not so the price will be on ranging within the levels.
| Resistance | Support |
|---|---|
| 2169.75 | 2151.00 |
| N/A | 2119.25 |
SUMMARY : bullish
Forum on trading, automated trading systems and testing trading strategies
Sergey Golubev, 2016.08.01 18:21
S&P 500 August 2016 Forecast: high volatility to be expected (adapted from the article)
Weekly
price is located above Ichimoku cloud for the bullish market consdition
with 2177.00 resistance level to be testing for the bullish trend to be
continuing. The bearish reversal level is 1981.25, and if the price
breaks this support level to below so the medium term bearish reversal
will be started. Thus, the price is located within 2177/1981 ranging
area with high volatility to be expected in August for example.
- "Trading in August can be difficult, because just as volatility is set to begin rising, volume tends to slump during the month as summer unwinds and people enjoy the last of the summer vacation months. This is generally the case barring a major catalyst, such as last summer’s swoon on fears stemming from China. So keep in mind, while volatility is on the verge of rising, we will want to reserve our excitement if the market doesn’t have a good reason to move. But, with that said, if you are in front of your screens then you need to stay alert and ready to act even if the market action at the immediate moment is ‘boring’."
- "Be mindful the market could whipsaw as it breaks the extended range, and shakes off the rust. Traders may want to wait until the market clearly extends away from the range with momentum before becoming involved at this time."
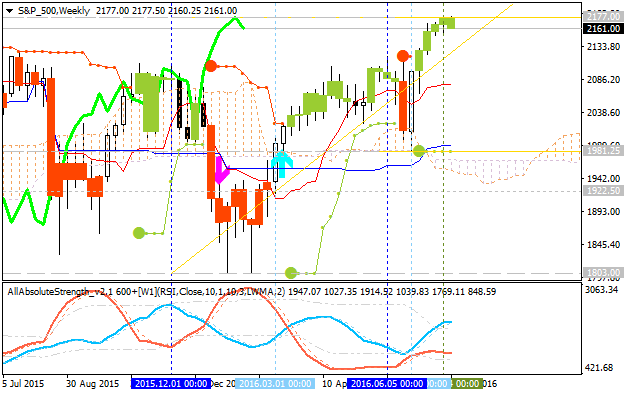
If W1 price breaks 1981.25
support level on close weekly bar so the primary bearish reversal will be started.
If W1 price breaks 2177.00 resistance level to above so the primary bullish trend will be continuing.
If not so the price will be on bullish ranging within 2177/1981 levels
| Resistance | Support |
|---|---|
| 2177.00 | 1981.25 |
| N/A | 1922.50 |
Trend: bullish
Forum on trading, automated trading systems and testing trading strategies
Sergey Golubev, 2016.08.08 17:06
Most likely scenario for S&P 500 H4 intra-day price (based on the article)
S&P 500 H4 intra-day price is located above Ichimoku cloud for the bullish breakout which was started in the beginning of this month for example: price broke Ichimoku cloud to above for the bullish reversal.
"The S&P 500 opened at a record high on Monday as oil prices rose and after Friday's stellar jobs report suggested strength in the U.S. economy, boosting appetite for risk."
"Oil rose 1.8 percent after a report in the Wall Street Journal last week that some OPEC members had called for a freeze in production."
"Seven of the 10 major S&P 500 indexes were higher, led by a 0.96 percent rise in the energy sector."
"Oil majors Exxon Mobil (XOM.N) and Chevron (CVX.N) rose about 0.6 percent and were the top drivers of the S&P."
The price was bounced from 2,182.50 resistance level to below for the ranging to be started within key narrow support/resistance levels:
- 2,182.50 resistance level located far about Ichimoku cloud in the bullish area of the chart, and
- 2,174.75 support level located above Ichimoku cloud in the beginning of the secondary correction to be started.
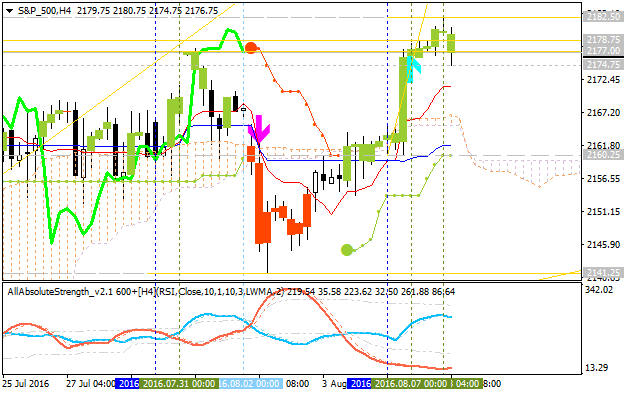
Bearish reversal level at this timeframe is 2,160.25, and if the price breaks this level to below so the bearish reversal of the intra-day price movement will be started.
Most likely scenario for S&P 500 H4 intra-day price: 2,174.75 level will be broken to below and the correction will be started; if not so the price will be on bullish condition ranging within the levels.
Forum on trading, automated trading systems and testing trading strategies
Sergey Golubev, 2016.08.09 21:43
Quick Intra-Day Overview - S&P 500: bullish ranging within narrow levels for direction (adapted from the article)
H4 price is located babove Ichimoku cloud in the bullish
area of the chart: price is on ranging within the narrow s/r levels waiting for the bullish trend to be continuing or to the secondary correction to be started.
- "The S&P 500 pulled back from a top-side trend-line running off the 7/14 peak, and is currently trying to make its way back higher off the 2174/78 support zone. Can the breakout following Friday’s big NFP print hold, or will it fold, leading to a false breakout? It certainly could and it would be consistent with how markets often act coming out of tight ranges like the one we saw to end July into August. A drop back below 2174 confirms a false breakout and a decline back towards the low-end of the range becomes the risk. Should support hold, then so does the market’s current upward bias."
- If H4 price breaks 2172.75 support level on close bar so the correction will be started.
- If H4 price breaks 2183.25 resistance level on close bar from below to above so the bullish trend will be continuing.
- If not so the price will be on bullish ranging within the levels.

| Resistance | Support |
|---|---|
| 2183.25 | 2172.75 |
| N/A | 2159.38 |
Forum on trading, automated trading systems and testing trading strategies
Sergey Golubev, 2016.08.21 08:05
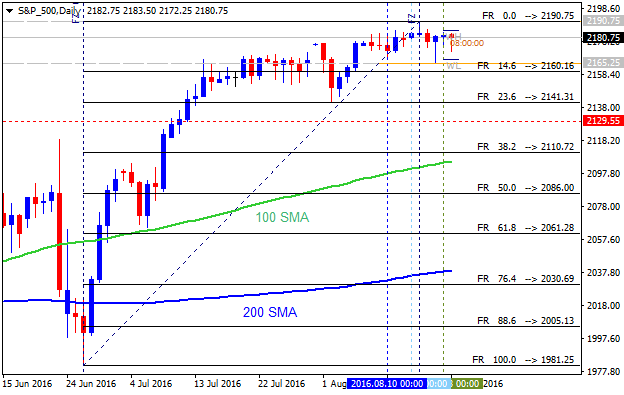
S&P 500 Weekly: daily bullish ranging within narrow s/r levels for direction (adapted from the article)
Daily price is on bullish ranging within the narrow support/resistance levels.
- The price is located above Ichimoku cloud in the bullish area of the chart.
- Chinkou Span line of Ichimoku indicator is above the price for the ranging condition to be continuing.
- Absolute Strength indicator is estimating the flat condition for the near future.
- "The rally remains in place as rotating market leadership is a positive."
- "Look to the sectors that will show earnings driven improvement: Energy and Technology."
- "Investors need to ignore the “low volume” arguments during the recent rally. The skeptics spinning that yarn have been wrong for years."
- "The trends in crude oil and the USD remain favorable for the market "melt up" to continue."
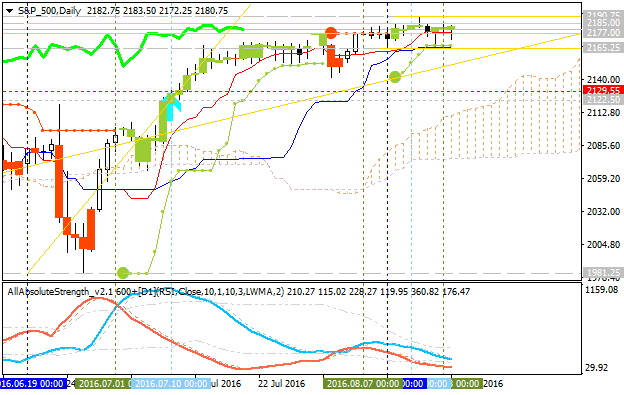
If D1 price breaks 2165.25
support level on close bar so the local downtrend as the secondary correction will be started.
If D1 price breaks 2190.75
resistance level on close bar from below to above so the bullish
trend will be continuing.
If not so the price will be on bearish ranging within the levels.
| Resistance | Support |
|---|---|
| 2190.75 | 2165.25 |
| N/A | 2129.55 |
SUMMARY : bullish
I like the charts you are posting Sergey.
Looks to me that the S&P 500 has just about topped out. The question is will it stay at current levels for a week or two and then move sharply and in which direction ?
I tend to favour up barring some crisis or other happening. A tiger waiting to spring maybe.
If we are talking about daily chart so there are two most likely scenarios:
- bullish trend will be continuing by 2190.75 resistance level to be crossed, or
- correction will be started if the price breaks 2165.25 support level to below.
The bearish reversal (the reversal of the price movement to the primary bearish market condition) is very unlikely in this year because the reversal level at 2030.69 is too far from the market price for now.
- Free trading apps
- Over 8,000 signals for copying
- Economic news for exploring financial markets
You agree to website policy and terms of use
Quick Technical Overview: Technical Targets for S&P 500 - after Friday's brexit recoverying
H4 price is recovering after Friday's 'brexit breakdown' - the price broke 100 SMA/200 SMA area to above to be reversed back to the primary bullish area of the chart. The price is testing 2090.75 resistance for the bullish trend to be continuing.
If the price breaks 2056.00 level to below so the intra-day bearish reversal will be started, if the price breaks 2090.75 resistance level to above so the primary bullish trend will be continuing up to 2119.25 level as a nearest target, otherwise - the price will be ranging waiting for direction.
Daily price recovered after Brexit breakdown: price broke 200 SMA to above for the bullish trend to be started and with 2090.75 resistance level to be tested for 2119.25 possible target.