
You are missing trading opportunities:
- Free trading apps
- Over 8,000 signals for copying
- Economic news for exploring financial markets
Registration
Log in
You agree to website policy and terms of use
If you do not have an account, please register
Forum on trading, automated trading systems and testing trading strategies
Something Interesting in Financial Video December 2013
Sergey Golubev, 2013.12.02 13:31
Candlestick Charting - Vol 13 - Bearish Engulfing Pattern
Forum on trading, automated trading systems and testing trading strategies
Libraries: MQL5 Wizard - Candlestick Patterns Class
Sergey Golubev, 2013.09.11 16:21
Bearish Engulfing PatternThe Bearish Engulfing Candlestick Pattern is a bearish reversal pattern, usually occuring at the top of an uptrend. The pattern consists of two Candlesticks:
Generally, the bullish candle real body of Day 1 is contained within the real body of the bearish candle of Day 2.
The market gaps up (bullish sign) on Day 2; but, the bulls do not push very far higher before bears take over and push prices further down, not only filling in the gap down from the morning's open but also pushing prices below the previous day's open.
With the Bullish Engulfing Pattern, there is an incredible change of sentiment from the bullish gap up at the open, to the large bearish real body candle that closed at the lows of the day. Bears have successfully overtaken bulls for the day and possibly for the next few periods.
The chart below of Verizon (VZ) stock shows an example two Bearish Engulfing Patterns occuring at the end of uptrends:
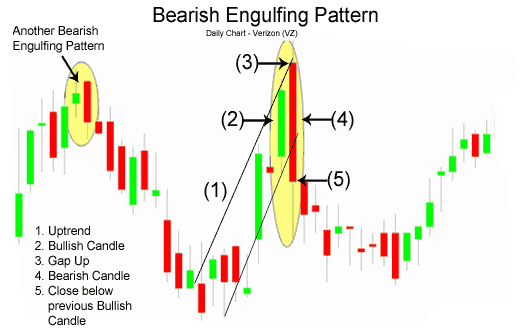
Bearish Engulfing Sell SignalThree methodologies for selling using the Bearish Engulfing Pattern are listed below in order of most aggressive to most conservative:
An example of what usually occurs intra-day during a Bearish Engulfing Pattern is presented next.
Intra-day Bearish Engulfing PatternThe following 15-minute chart of Verizon (VZ) is of the 2-day period comprising the Bearish Engulfing Pattern example on the prior page:
- Day 1: As is seen in the chart above, Day 1 was an up day, closing
near the day's high (bullish sentiment).
- Day 2: The open was a gap up, a very bullish sign; nevertheless,
the bulls ran out of buying pressure and prices fell the rest of the day,
closing near the day's lows (bearish sentiment) and lower than Day 1's lows.
The Bearish Engulfing Pattern is one of the strongest candlestick reversal patterns. Its opposite is the Bullish Engulfing PatternEconomic Calendar Of The Week - May 16-20, 2016
The US dollar had another positive week, enjoying some good data. UK and US inflation data, housing figures and most importantly the FOMC Meeting Minutes stand out. These are the highlights of this week. Join us as we explore the market movers on Forex calendar.
US jobless claims posted a higher than expected reading of 294,000. The 20,000 addition reached the highest level since February 2015. However, the positive trend that began early in May continued for the dollar, especially as retail sales beat expectations, something that doesn’t usually happen. The fear of a Brexit, highlighted by the BOE, is one possible reason to wait.
This week’s crop of economic data manages to strike a pleasing balance between volume and importance. Almost every day there is enough of sufficient importance to warrant investor’s attention, without overwhelming them in frequency.
US data includes Fed minutes and CPI numbers, with the former particularly interesting. If the doves on the FOMC were in the ascendancy at the last meeting, then subsequent US data will only have emboldened them to keep on warning about the dangers of higher rates. U.S. consumer prices barely moved in March rising 0.1% showing little reason for interest rate hikes in the near future. The lukewarm inflation figures do not reflect the ongoing improvement in the job market. The CPI declined 0.2% in February. CPI is forecasted to rise 0.4% while core prices are estimated to climb 0.2% this time.
UK data also comes into focus, including CPI numbers and employment figures; Brexit dominated last week, but with the UK economy still lackluster, the focus will be on whether there is any improvement in underlying data. Employment numbers will keep trader’s attention in the UK this week. The number of people receiving jobless benefits increased by 6,700 in March, missing predictions for an 11,900 cut. The jobless-claims rate remained at 2.1%. BOE said recruitment in April was nearly unchanged showing muted employment growth. Meanwhile, U.K. unemployment edged up for the first time in seven months and employers added fewer jobs than forecast, suggesting the labor market is losing momentum. The number of people looking for work climbed by 21,000 to 1.7 million in the three months through February. In light of these figures, the Bank of England is in no hurry to raise interest rates anytime soon and the June 23 EU vote is starting to weigh on UK economic growth. The amount of people receiving jobless benefits is expected to rise by 4,100 in April.
With no Federal Reserve meeting until late June Fed speaker’s hawkish tones have helped the US dollar rally. This week all eyes will focus on the Fed minutes. These are the meeting minutes from the April decision, in which the Fed left policy unchanged, acknowledged some improvement but did provide any hike hints. The chances for a rate hike in June dropped after that meeting but since then, data has improved. So, this is an opportunity for the Fed to hint about raising rates in June, if this is indeed the case, and it’s quite unclear that this a real option for the doves that control the Fed. It is important to remember that the minutes are edited until the last moment, allowing the Fed to sharpen any message.
Renko Bars can be viewed as merely a different way to reflect price on a chart; in my opinion, I feel they paint the clearest picture of price available.
Here are my top 6 reasons of why I choose Renko Bars and charts:
Forum on trading, automated trading systems and testing trading strategies
Something Interesting in Financial Video January 2014
Sergey Golubev, 2014.01.08 15:48
Renko Bar |Day Trading | What are Renko Bars | How do Renko Bars Work | Part 1
Forum on trading, automated trading systems and testing trading strategies
Something Interesting in Forex Video May 2013
Sergey Golubev, 2013.05.12 15:23
This is the video of 3 minutes with very basic information about market condition: Market conditions -- where will the price move? This is strongly recommended :) to watch for everyone just to remind this basic knowledge for example.
This is just an example of the market analysis for S&P 500
Forum on trading, automated trading systems and testing trading strategies
Something Interesting in Financial Video September 2015
Sergey Golubev, 2015.08.31 04:25
Neural Networks Explained in Plain English with Ron Leplae
The goal of the webinar is to demystify neural networks, explain neural networks in plain English, and share easy to understand code examples how NN can be used.
Forum on trading, automated trading systems and testing trading strategies
Something Interesting in Financial Video June 2013
Sergey Golubev, 2013.06.11 06:55
Scalping the forex market
All the ins and outs on scalping the Forex market. May Chris dives into the world of Scalping where he explains in great detail how this style of trading can be accomplished in the Forex market. This live webinar not only clarifies how a trader can scalp but also provides every Forex trader with a great guidance and extra tips.
Forum on trading, automated trading systems and testing trading strategies
Something Interesting in Financial Video April 2015
Sergey Golubev, 2015.04.20 08:13
Order Flow Scalping with John Grady
Reducing trading to it's most basic fundamental levelWhat is happening? Why do prices fluctuate? Why should order flow play a critical role in your methodology? It's an auction. When buyers overwhelm sellers, the market goes up. When sellers overwhelm buyers, the market goes down. This is why size matters. What we're trying to do is ride the coattails of guys who move size and ride the wave created by all the small traders who pile on board and help create the domino effect.
The importance of a good DOM
Most people do not understand why order flow is important because they have never seen a good DOM.
An inside look into the world of proprietary trading firms
Technical analysis vs. reading the tapeExplanation of how prop firms work and how they train traders.
Charts only show you the past price. They do not show you how the market traded at that price. How much volume changed hands and the way that exchange affected price makes a difference if you are contemplating getting involved in that area.
Predicting the future
Believing I know where the market will be an hour from now, let alone three days from now, is believing that I know something the rest of the world does not know. If large institutions, speculators and high frequency trading programs who move thousands of contracts and actually move the market are not currently involved and showing no signs of playing the game (i.e. a slow market with very little volatility), why would I want to be involved?
Video samples showing different types of action
Would like to show a few samples of prices being hit during fast action vs. dead action. Not going to show any actual trades as I do not want it to look like I'm pitching myself or cherry picking winners. Just want to demonstrate how sometimes it's obvious that you should probably be going one way if you're contemplating an entry and other times there's simply no educated guess to be made. This is clearly seen in the order flow.
Methodology vs. psychology
Developing a winning methodology is only the first part. The next part, which is equally important, is developing a proper risk methodology and understanding your own psychology when it comes to adhering to this risk methodology.
How Much Money is There on Earth?
A broker-dealer who is prepared to buy or sell a specific security — such as a bond or at least one round lot of a stock — at a publicly quoted price, is called a market maker in that security. Other brokers buy or sell specific securities through market makers, who may maintain inventories of those securities. There is often more than one market maker in a particular security, and they bid against each other, helping to keep the marketplace liquid. The Stock Market and the corporate and municipal bond markets are market maker markets. In contrast, on the floor of the New York Stock Exchange there's a single specialist to handle transactions in each security.
Market Makers must be compensated for the risk they take; what if he buys your shares in IBM then IBM's stock price begins to fall before a willing buyer has purchased the shares? To prevent this, the market maker maintains a spread on each stock he covers. The market maker may purchase your shares of IBM from you for $100 each the ask price and then offer to sell them to a buyer at $100.05 the bid price. The difference between the ask and bid price is only $.05, but by trading millions of shares a day, he's managed to pocket a significant chunk of change to offset his risk.
In contrast to conventional brokers, marker makers assume a high level of risk because of the high number of units they hold their inventory. Market makers are entrusted with promoting market efficiency by keeping markets liquid. To ensure impartiality for the benefit of their clients, brokerage houses who act as market makers are legally required to separate their market making activities from their brokerage sales operations.