Indicators: Japanese Candlestick Patterns
Forum on trading, automated trading systems and testing trading strategies
Something Interesting to Read February 2014
newdigital, 2014.02.02 08:57
High Profit Candlestick Patterns : Stephen Bigalow
High profit trading patterns, revealed by utilizing time-honored Japanese candlestick signals. A straight-forward approach to understanding and exploiting market opportunities. Practical applications to predict stock price movements consistently and profitably, a winning system in good times or bad! All detailed in: "High Profit Candlestick Patterns: Turning Investor Sentiment into Profits" By Stephen W. Bigalow
Don’t play the market, Beat the Market! Stephen W. Bigalow’s first book "Profitable Candlestick Trading" taught the novice investor how to quickly identify the best trading opportunities. Now his new book, "High Profit Candlestick Patterns" takes his teaching to the next level. Combining the proven results of Japanese Candlestick charting with effective Western technical analysis, produces even higher profit wealth-building stock selection techniques. Learn the key to profitable stock selection with this safer approach to investing and avoid expensive trading mistakes. Quickly learn the simplest, yet most intelligent, approach to stock selection. Candlestick signals visually produce compelling results. Japanese candlestick charting techniques, integrated with statistically proven Western technical analysis, produces an even more powerful investment platform. The ability to recognize trading patterns in their very early stages empowers an investor with high profit trading strategies.
For the technical investor, the combined analysis provides potent trading programs. The fundamental investor gains tremendous insights into the timing of positions. The introduction of cutting-edge computer generated technical analysis, with the world's most proven trading technique, becomes a powerful tool for understanding the movements of the markets. Discover simple techniques that put the probabilities highly in your favor.
Japanese candlestick signals provide an immense amount of information. They graphically depict what is occurring in investor sentiment. This alone provides a huge advantage for the investor. Having the ability to identify reversals in price trends, utilizing statistically proven and utilized signals, allows an investor to develop high profit trading strategies. The psychological elements not only reveal trend reversals, but they provide the insights for understanding why that reversal is occurring. This becomes a very powerful investment tool.
The graphic illustrations in this book are simple common sense revelations. Utilizing candlestick signals in conjunction with Western technical patterns produces two strong investment elements. First, it allows for the recognition of the optimal times for entering a trade. Second, the candlestick signals revealed immediately when the trend pattern is not performing correctly, allowing for quick exits.
You will receive a whole new perspective for profitably investing in the markets. You do not have to learn formulas nor develop investing talents. The combination of candlestick signals with easy-to-identify trading patterns will vastly expand your investment confidence. The self-mastery of profitable investing is greatly simplified with quick visual evaluations.
Forum on trading, automated trading systems and testing trading strategies
Something Interesting to Read February 2014
newdigital, 2014.02.06 20:25
Candlestick charting Explained : Gregory L. Morris
Empower your trading with Japanese candlestick charting
Japanese candlestick charts dramatically improve your understanding of short-term (less than a week) market sentiment, making you a much more informed and focused trader of stocks, futures, and indices. The bestselling Candlestick Charting Explained focuses on the patterns themselves and highlights the key facts you need to know to apply each pattern to your trading. For each of 89 distinctive candle patterns, its standardized format provides you with:
- Commentary--Description of pattern and significance of its name, insights into unique features, and other concise explanation
- Rules of Recognition--Simple rules for quick, accurate identification along with precise, day-by-day descriptions of pattern development
- Scenarios and Psychology Behind the Pattern--Trading scenarios that could have led to the pattern's development, with general discussion of the psychology of each
- day's action
- Pattern Flexibility--Situations that change the pattern's effectiveness with explanations of allowable deviations from the classic pattern
- Pattern Breakdown--Instructions for reducing the pattern to a single candle line and whether or not outside confirmation is suggested or unnecessary
- Related Patterns--Patterns that have similar formations, could be considered variations, or are a part of this pattern
- Example--A graphic example of the pattern to both aid in recognition and eliminate costly confusion in pattern identification
Additional information and insights present different interpretations of candlesticks based on intraday instead of end-of-day events and action, improving signal reliability. The author's unique candle pattern filtering concept, instrumental in answering the "how" question, is updated to utilize today's larger universe of stock data. An all-new chapter provides practical application and perspective traders need to view candles in the context of today's computer-driven marketplace.
For millions of traders, candlesticks have become a key tool in creating and verifying trading signals. Candlestick Charting Explained is the only book you need to start integrating their proven versatility and effectiveness into your technical trading program.
=============
- Description on the forum : Libraries: MQL5 Wizard - Candlestick Patterns Class (many mini-articles with images)
- MQL5 Article : Analyzing Candlestick Patterns
Forum on trading, automated trading systems and testing trading strategies
Libraries: MQL5 Wizard - Candlestick Patterns Class
newdigital, 2013.09.10 15:21
Just some basic for traders -
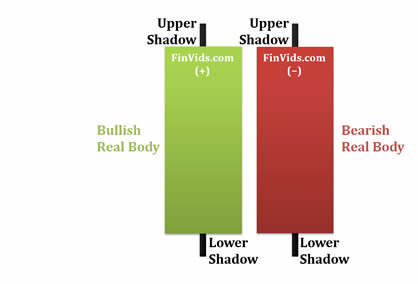
Candlestick charts are an effective way of visualizing price movements. There are two basic candlesticks:
- Bullish Candle: When the close is higher than the open (usually green or white)
- Bearish Candle: When the close is lower than the open (usually red or black)
Candlestick Parts
There are three main parts to a candlestick:
- Upper Shadow: The vertical line between the high of the day and the close (bullish candle) or open (bearish candle)
- Real Body: The difference between the open and close; colored portion of the candlestick
- Lower Shadow: The vertical line between the low of the day and the open (bullish candle) or close (bearish candle)
The power of Candlestick Charts is with multiple candlesticks forming reversal and continuation patterns:
- Bullish Engulfing Pattern
- Bearish Engulfing Pattern
- Dark Cloud Cover
- Doji
- Dragonfly Doji
- Evening Star
- Gravestone Doji
- Hammer
- Hanging Man
- Harami
- Inverted Hammer
- Morning Star
- Piercing Pattern
- Shooting Star
- Tweezer Tops & Bottoms
- Windows
Forum on trading, automated trading systems and testing trading strategies
Libraries: MQL5 Wizard - Candlestick Patterns Class
newdigital, 2013.09.10 19:03
Real Body and Upper and Lower Shadows
The rectangular area between the opening and the close of a session of trading is called the real body. The thin lines that look like candle wicks above and below the real body are called shadows. The shadow above the real body is called the upper shadow, the top end of the upper shadow corresponding to the high of the session of trading, and the shadow below the real body is called the lower shadow, where the bottom end of the lower shadow corresponds to the low of the session of trading.
Bullish Candlestick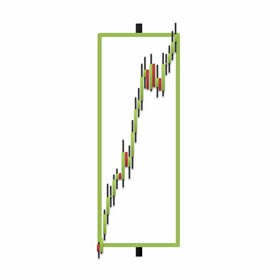
When discussing trading sessions based on a trading day (morning to afternoon), generally speaking the two most significant times of the trading day are the opening and the close. The opening and the close create the real body of the candlestick; hence, the most important part of a candlestick is the real body. By looking at a candlestick, a person can quickly tell whether traders were eagerly buying throughout the day (bulls were in charge for the trading day) - the candlestick is green, or whether traders were eagerly selling throughout the day (bears dominated the trading day) - the candlestick is red. By looking at the size of the real body of the candlestick, a trader can tell if the bulls were significantly in charge of the trading day (a tall green candlestick) or only moderately in charge of the trading day (a small green candlestick). Similarly, if a trader sees a large red candle, he or she can assume that the selling pressure of the bears overpowered the bulls for the day; however, if the candlestick is very small and red, then the trader can see that the bears were only slightly more powerful that day than the bulls. In summary, the real body of a candlestick can summarize the outcome of a period of trading in an easy to see way – green = bulls win the trading session, red = bears win the trading session; and the height of the candle equals the margin of victory for the bulls or the bears.
Steve Nison (1994) states that “for a [bullish] candle to have meaning, some Japanese candlestick traders believe that the real body should be at least three times as long as the previous day’s real body.” (p. 20). Roads (2008) suggests the following: “determine the area covered by the difference between the close and the open. If it’s at least 90 percent of the area covered by the difference between the high and low, you have a long white candle” (p. 76). An example of a computer charting package’s definition is: “Its Close price is higher than the Open price; Its body is longer than each shadow; Its body is longer than the average body size calculated for the specified number of preceding candles” (ThinkorSwim, 2011).
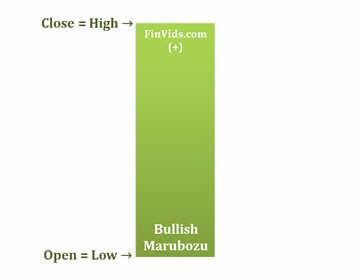
There are specific versions of the bullish candle. The first is a very bullish candlestick called the bullish marubozu. The rough translation of marubozu is “bald or little hair” (Rhoads, 2008, p. 74). A marubozu is bald or has little hair because a marubozu has no upper or lower shadow, or at least a very small upper and/or lower shadow. This is the most extreme form of the bullish candlestick because bulls were in charge from the opening to the close; bears were unable to push prices below the opening price and the trading session ended with bulls still buying pushing prices upward until the close.
Forum on trading, automated trading systems and testing trading strategies
Libraries: MQL5 Wizard - Candlestick Patterns Class
newdigital, 2013.09.11 16:10
The Bullish Engulfing Candlestick Pattern is a bullish reversal pattern, usually occuring at the bottom of a downtrend. The pattern consists of two Candlesticks:
- Smaller Bearish Candle (Day 1)
- Larger Bullish Candle (Day 2)
The bearish candle real body of Day 1 is usually contained within the real body of the bullish candle of Day 2.
On Day 2, the market gaps down; however, the bears do not get very far before bulls take over and push prices higher, filling in the gap down from the morning's open and pushing prices past the previous day's open.
The power of the Bullish Engulfing Pattern comes from the incredible change of sentiment from a bearish gap down in the morning, to a large bullish real body candle that closes at the highs of the day. Bears have overstayed their welcome and bulls have taken control of the market.
The chart below of the S&P 500 Depository Receipts Exchange Traded Fund (SPY) shows an example of a Bullish Engulfing Pattern occuring at the end of a downtrend:
There are three main times to buy using the Bullish Engulfing Pattern; the buy signals that are presented below are ordered from the most aggressive to most conservative:
- Buy at the close of Day 2 when prices rallied upwards from the gap down in the morning. A strong indication that the rally on Day 2 was significant and truly a reversal of market sentiment, is if there was a substantial increase in volume that accompanied the large move upward in price.
- Buy on the day after the Bullish Engulfing Pattern occurs; by waiting until the next day to buy, a trader is making sure that the bullish reversal and enthusiasm of the prior day is continuing and was not just a one day occurance like a short covering rally. In the chart above of the SPY's, a trader would likely not enter the market long on the day after the Bullish Engulfing Pattern because the market gapped down significantly and even made new lows. A trader using methodology #2, would likely wait for a more concrete buy signals such as the one presented in method #3 next.
- After a trader sees the Bullish Engulfing Pattern, the trader would wait for another signal, mainly a price break above the downward resistance line, before entering a buy order.
An example of what usually occurs intra-day during a Bullish Engulfing Pattern is presented next.
Intra-day Bullish Engulfing PatternThe following 15-minute chart of the S&P 500 exchange traded fund (SPY) is of the 2-day period comprising the Bullish Engulfing Pattern example on the prior page:
- Day 1: As is seen in the chart above, Day 1 was a down day, even closing the day at the low (bearish sentiment).
- Day 2: The open was a gap down, very bearish sign; but the bulls appeared to have had enough because the price of the SPY's went up the rest of the day, closing near the day's highs (bullish sentiment) and higher than Day 1's high.
Forum on trading, automated trading systems and testing trading strategies
Libraries: MQL5 Wizard - Candlestick Patterns Class
newdigital, 2013.09.11 16:21
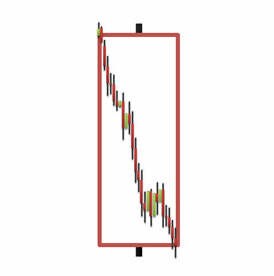
Bearish Engulfing Pattern
The Bearish Engulfing Candlestick Pattern is a bearish reversal pattern, usually occuring at the top of an uptrend. The pattern consists of two Candlesticks:
- Smaller Bullish Candle (Day 1)
- Larger Bearish Candle (Day 2)
Generally, the bullish candle real body of Day 1 is contained within the real body of the bearish candle of Day 2.
The market gaps up (bullish sign) on Day 2; but, the bulls do not push very far higher before bears take over and push prices further down, not only filling in the gap down from the morning's open but also pushing prices below the previous day's open.
With the Bullish Engulfing Pattern, there is an incredible change of sentiment from the bullish gap up at the open, to the large bearish real body candle that closed at the lows of the day. Bears have successfully overtaken bulls for the day and possibly for the next few periods.
The chart below of Verizon (VZ) stock shows an example two Bearish Engulfing Patterns occuring at the end of uptrends:
Three methodologies for selling using the Bearish Engulfing Pattern are listed below in order of most aggressive to most conservative:
- Sell at the close of Day 2. An even stronger indication to sell is given when there is a substantial increase in volume that accompanies the large move downward in price.
- Sell on the day after the Bearish Engulfing Pattern occurs; by waiting until the next day to sell, a trader is making sure that the bearish reversal pattern is for real and was not just a one day occurance. In the chart above of Verizon, a trader would probably entered on the day after the Bearish Engulfing Pattern because the selling continued.
- Usually trader's wait for other signals, such as a price break below the upward support line, before entering a sell order. However, in the case of Verizon above, the Bearish Engulfing Pattern occured at the same time as the trendline break below support.
An example of what usually occurs intra-day during a Bearish Engulfing Pattern is presented next.
Intra-day Bearish Engulfing PatternThe following 15-minute chart of Verizon (VZ) is of the 2-day period comprising the Bearish Engulfing Pattern example on the prior page:
- Day 1: As is seen in the chart above, Day 1 was an up day, closing near the day's high (bullish sentiment).
- Day 2: The open was a gap up, a very bullish sign; nevertheless, the bulls ran out of buying pressure and prices fell the rest of the day, closing near the day's lows (bearish sentiment) and lower than Day 1's lows.
Forum on trading, automated trading systems and testing trading strategies
Libraries: MQL5 Wizard - Candlestick Patterns Class
newdigital, 2013.09.13 12:10
Dark Cloud Cover is a bearish candlestick reversal pattern, similar to the Bearish Engulfing Pattern (see: Bearish Engulfing Pattern). There are two components of a Dark Cloud Cover formation:
- Bullish Candle (Day 1)
- Bearish Candle (Day 2)
A Dark Cloud Cover Pattern occurs when a bearish candle on Day 2 closes below the middle of Day 1's candle.
In addition, price gaps up on Day 2 only to fill the gap and close significantly into the gains made by Day 1's bullish candlestick.
The rejection of the gap up is a bearish sign in and of itself, but the retracement into the gains of the previous day's gains adds even more bearish sentiment. Bulls are unable to hold prices higher, demand is unable to keep up with the building supply.
Dark Cloud Cover Candlestick Chart ExampleThe chart below of Boeing (BA) stock illustrates an example of the Dark Cloud Cover Pattern:
Traders usually suggest not selling exactly when one sees the Dark Cloud Cover Pattern (Day 1 & Day 2) until other confirming signals are given such as a break of an upward trendline or other technical indicators. One reason for waiting for confirmation is that the Dark Cloud Cover Pattern is a bearish pattern, but not as bearish as it could be: part of the gains from Day 1 have still been preserved.
A more bearish reversal pattern is the Bearish Engulfing Pattern that completely rejects the gains of Day 1 and usually closes below the lows of Day 1.
Forum on trading, automated trading systems and testing trading strategies
Libraries: MQL5 Wizard - Candlestick Patterns Class
newdigital, 2013.09.13 15:57
The Dragonfly Doji is a significant bullish reversal candlestick pattern that mainly occurs at the bottom of downtrends.
The Dragonfly Doji is created when the open, high, and close are the same or about the same price (Where the open, high, and close are exactly the same price is quite rare). The most important part of the Dragonfly Doji is the long lower shadow.
The long lower shadow implies that the market tested to find where demand was located and found it. Bears were able to press prices downward, but an area of support was found at the low of the day and buying pressure was able to push prices back up to the opening price. Thus, the bearish advance downward was entirely rejected by the bulls.
Dragonfly Doji Candlestick Chart ExampleThe chart below of the mini-Dow Futures contract illustrates a Dragonfly Doji occuring at the bottom of a downtrend:
In the chart above of the mini-Dow, the market began the day testing to find where demand would enter the market. The mini-Dow eventually found support at the low of the day, so much support and subsequent buying pressure, that prices were able to close the day approximately where they started the day.
The Dragonfly Doji is an extremely helpful Candlestick pattern to help traders visually see where support and demand is located. After a downtrend, the Dragonfly Doji can signal to traders that the downtrend could be over and that short positions should probably be covered. Other indicators should be used in conjunction with the Dragonfly Doji pattern to determine buy signals, for example, a break of a downward trendline.
The bearish version of the Dragonfly Doji is the Gravestone DojiForum on trading, automated trading systems and testing trading strategies
Libraries: MQL5 Wizard - Candlestick Patterns Class
newdigital, 2013.09.14 19:53
The Evening Star Pattern is a bearish reversal pattern, usually occuring at the top of an uptrend. The pattern consists of three candlesticks:
- Large Bullish Candle (Day 1)
- Small Bullish or Bearish Candle (Day 2)
- Large Bearish Candle (Day 3)
The first part of an Evening Star reversal pattern is a large bullish green candle. On the first day, bulls are definitely in charge, usually new highs were made.
The second day begins with a bullish gap up. It is clear from the opening of Day 2 that bulls are in control. However, bulls do not push prices much higher. The candlestick on Day 2 is quite small and can be bullish, bearish, or neutral.
Generally speaking, a bearish candle on Day 2 is a stronger sign of an impending reversal. But it is Day 3 that is the most significant candlestick.
Day 3 begins with a gap down, (a bearish signal) and bears are able to press prices even further downward, often eliminating the gains seen on Day 1.
Evening Star Candlestick Chart ExampleThe chart below of Exxon-Mobil (XOM) stock shows an example a Evening Star bearish reversal pattern that occured at the end of an uptrend:
Day 1 of the Evening Star pattern for Exxon-Mobil (XOM) stock above was a strong bullish candle, in fact it was so strong that the close was the same as the high (very bullish sign). Day 2 continued Day 1's bullish sentiment by gapping up. However, Day 2 was a Doji, which is a candlestick signifying indecision. Bulls were unable to continue the large rally of the previous day; they were only able to close slightly higher than the open.
Day 3 began with a bearish gap down. In fact, bears took hold of Exxon-Mobil stock the entire day, the open was the same as the high and the close was the same as the low (a sign of very bearish sentiment). Also, Day 3 powerfully broke below the upward trendline that had served as support for XOM for the past week. Both the trendline break and the classic Evening Star pattern gave traders a signal to sell short Exxon-Mobil stock.
The Evening Star pattern is a very powerful three candlestick bearish reversal pattern. The bullish equivalent of the Evening Star is the Morning Star pattern- Free trading apps
- Over 8,000 signals for copying
- Economic news for exploring financial markets
You agree to website policy and terms of use
Japanese Candlestick Patterns:
Bearish:
Bullish:
Author: Ronnie Mansolillo