Long and short term position sizes
To me, the thing to do would be use a combination of things. First, do not put too much of your account % into 1 or 2 trades, unless you are ok with a higher risk. Some people go as low as 1 to 2% per trade, depends on your acceptable level more than anything.
As far as the 2% / 4% example, I think you need to do the 4% calculation based on the trade itself, not the 4% of your account balance, because that is going to change all the time. If you just stick with the 2% of your trade as your calculation, the rest will just follow from that, and base the rest of your numbers from your potential trade, like 10pips up or down, or whatever.
One thing I have seen suggested, here and elsewhere, and it makes sense to me, is your Risk/Reward Ratio (RRR). If you are making trades that are any lower than 1:1, it could get hairy. The only way this low ratio would work is if you had a system that won 51% or better of your trades. While it might not be obvious, it does need to be said here that the 1:1 ratio includes the "risk" of a lost trade including the costs per trade, such as broker fees, slippage, and spread. If you can get a system that increases your RRR to 1:2 or 1:5 (or even better) than your 51% trade win isn't as important, as long as you have a system in place to cut the losing trades off and let your winning trades ride.
There is not really a "this solution will work 100% of the time" answer to a question like this. You need to adjust and tweak it to fit your trading style, acceptable risk numbers, and market condition. Some systems will not work with some markets.
Thanks JD4 for your inputs.
Let me give one more example for clarifying more.
Let's say ... I'm trading both short term signals and long term signals at the same time.
And, my stop loss ... is 10 pip for a short term trade and 20 pip for a long term trade.
I have 1.000$ on my account ... and let's say that I'm following the rule that my maximum percentage loss is %2 of my balance per trade for short trades.
In this case, my position size for per short term signal is (let's also say that it is USD based pair) 0,2 lot.
For a long term trade ...
1. Should my position size 0,1 lot for equalizing per trade percentage loss between short and long trades.
2. Or ... should my position size not change and remain at 0,2 lot ... but my percentage loss for per long term trade be %4?
In summary ... for trades for different terms, should I decide different maximum percentage losses per trade ... or should I fix them for all the terms?
If it were me in that situation, and I had decided on the arbitrary percentage of 2% max risk of my account per trade, I would calculate the lot size to reflect that, even if that was on a different trading style (long instead of short term) . However, there is nothing saying that if you get a good system, set up specifically for longer term trades, that if you feel comfortable keeping the same lot size (which as you know would increase your risk) you should shy away from it. Again, it depends on your preferences.
I am of the mind set that my "acceptable risk level" is good enough to run across the board, but that also depends on the market being traded as well and how you set up your system to limit that risk. I am sure that if you ask 100 different traders the same question, you are likely to get 100 different answers, and they are not all wrong or all right. That might be what works for that trader and their style. Doesn't mean it has to be exact the same for you. If you want, and have not yet done so, and I recommend this anyway, get a demo account, and practice and tweak your system so that it works for you before you go live. Try both of these methods in real time trading, and see if one way or the other works better for you. I wish you well finding a style that works for you, and can make you a good income on trading.
You could consider this, there exists what i call 'the looser' zone, this is an area where your trading style will automatically drain your account because the right calculations have not been made, and things are way off.
People often put it too close to the price, either out of fear, or based on some calculations that show how many times they can 'gamble' for an X amount of Balance.
What they do not understand is that the margin for error is so small i will give you an example.
Trader A uses the ten pip method like yourself, he didn't do the correct calculations, and he places his stop ten pips below price.
Now Trader B has done his homework, he knows the statistical values of the results of a ten pip stop.
Let's take for example EURUSD.
Trader A has not calculated anything except his max loss and how many times he can enter the market.
Trader B has done his homework and made calculations on EURUSD he knows several values for example like these:
10 pips= 16426 Hits or, once every 3 Minutes.
20 pips= 12128 Hits or, once every 5 Minutes.
30 pips= 8314 Hits or, once every 7 Minutes.
40 pips= 5250 Hits or, once every 12 Minutes.
50 pips= 3035 Hits or, once every 21 Minutes.
60 pips= 1706 Hits or, once every 38 Minutes.
70 pips= 985 Hits or, once every 65 Minutes.
80 pips= 638 Hits or, once every 101 Minutes.
90 pips= 385 Hits or, once every 168 Minutes.
100 pips= 282 Hits or, once every 230 Minutes.
As you can see large differences exist in such a small area.
This separates the winners from the losers some will gamble, and some will know exactly what to do.
Trader B knows where to put his stoploss, Trader A only knows how many times he can gamble before he is out.
It is mathematically predictable, that trader A will lose all of his money over time, and it is mathematically predictable that trader B will make a small fortune.
For trader A has got one leg stuck in the loser zone, while trader B is dead on the money, most of the time.
If Trader A knew he only has to adjust it just a little bit..., gamble less, make sure he knows more, he'd be on his way to make a small fortune ,too.
This goes on, trader B also knows how and when to exit the market, he has done the MATH.
Marco vd Heijden:
...This goes on, trader B also knows how and when to exit the market, he has done the MATH.
This example above is based on M1 because it is about placing a stop loss.
These calculations are extracted from, in this case 65000 bars, that's 65000 minutes, they represent a good averaged outcome.
Of course, there will be fluctuations, there will always be, However these are calculated results for the long run, and if you stick to the plan, and run through the same amount of market time, results should be as close as you can get to the calculated outcome, the goal here is to expose 'The Edge'.
Now this was only a stop loss calculation i can also show you what happens when you do the math for example a calculation on H1 Time Frame.
So i like to ask you, is there anything particular, of interest, you see in this graph ? can you identify a possible edge ? maybe more ?
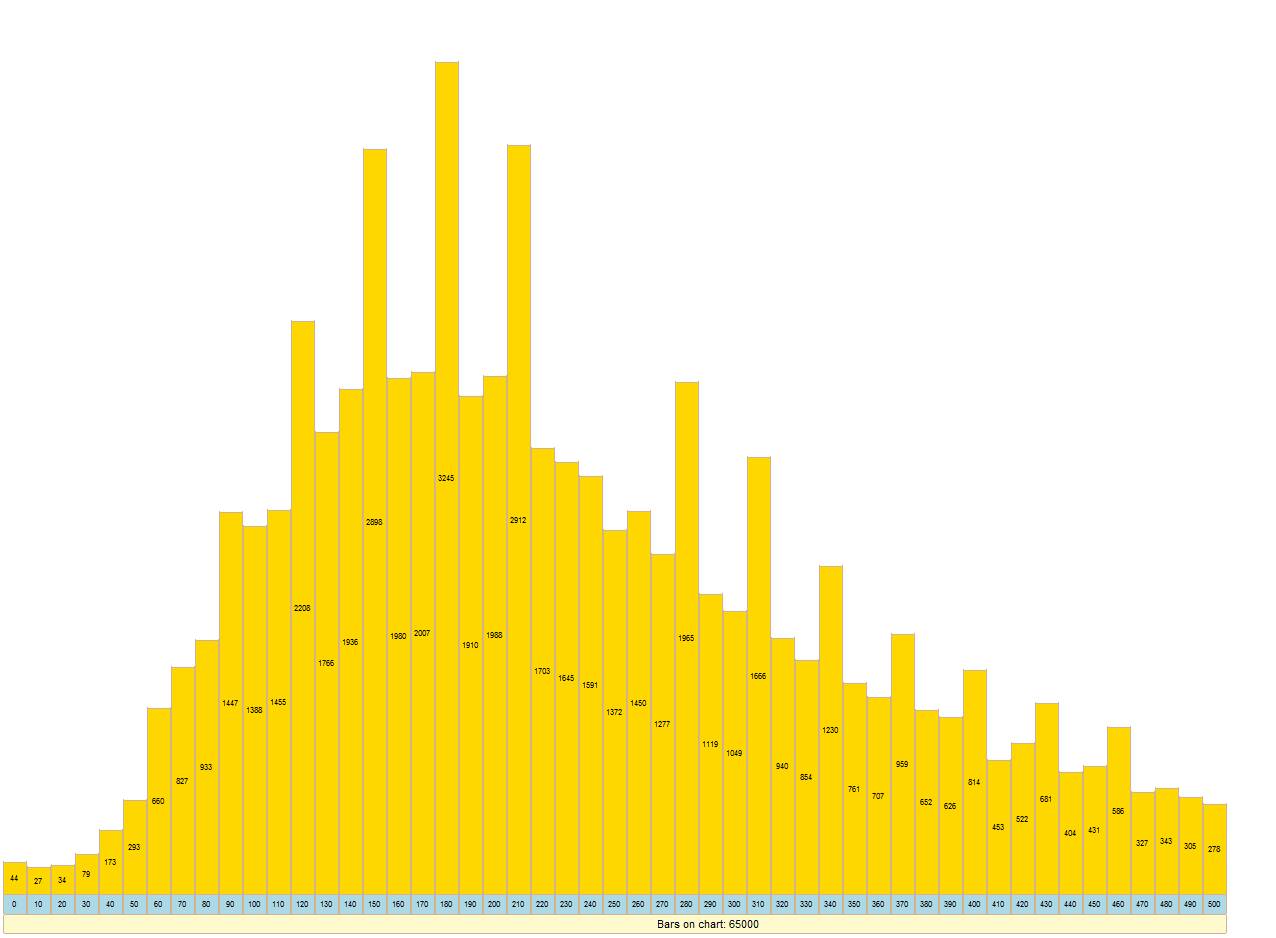
How about this one ? from another pair, as you can see the results are very symbol sensitive, they are very different between one another..
The real questions are, What do we observe ?, is it the massive triggering of stop losses, or take profits ? or is it something else ? do we want to be there, when it happens ?
Because the calculations certainly tell how often, and when it is expected to happen.
For this you only need to do the correct calculations, then the result is something to wait for, we do not predict, we just calculate, so we know what to expect, when it should happen, and then wait for it to happen, like a hunter, who does not lose, nor win anything until he fires his shot.
This example above is based on M1 because it is about placing a stop loss.
These calculations are extracted from, in this case 65000 bars, that's 65000 minutes, they represent a good averaged outcome.
Of course, there will be fluctuations, there will always be, However these are calculated results for the long run, and if you stick to the plan, and run through the same amount of market time, results should be as close as you can get to the calculated outcome, the goal here is to expose 'The Edge'.
Now this was only a stop loss calculation i can also show you what happens when you do the math for example a calculation on H1 Time Frame.
So i like to ask you, is there anything particular, of interest, you see in this graph ? can you identify a possible edge ? maybe more ?
Yes of course,
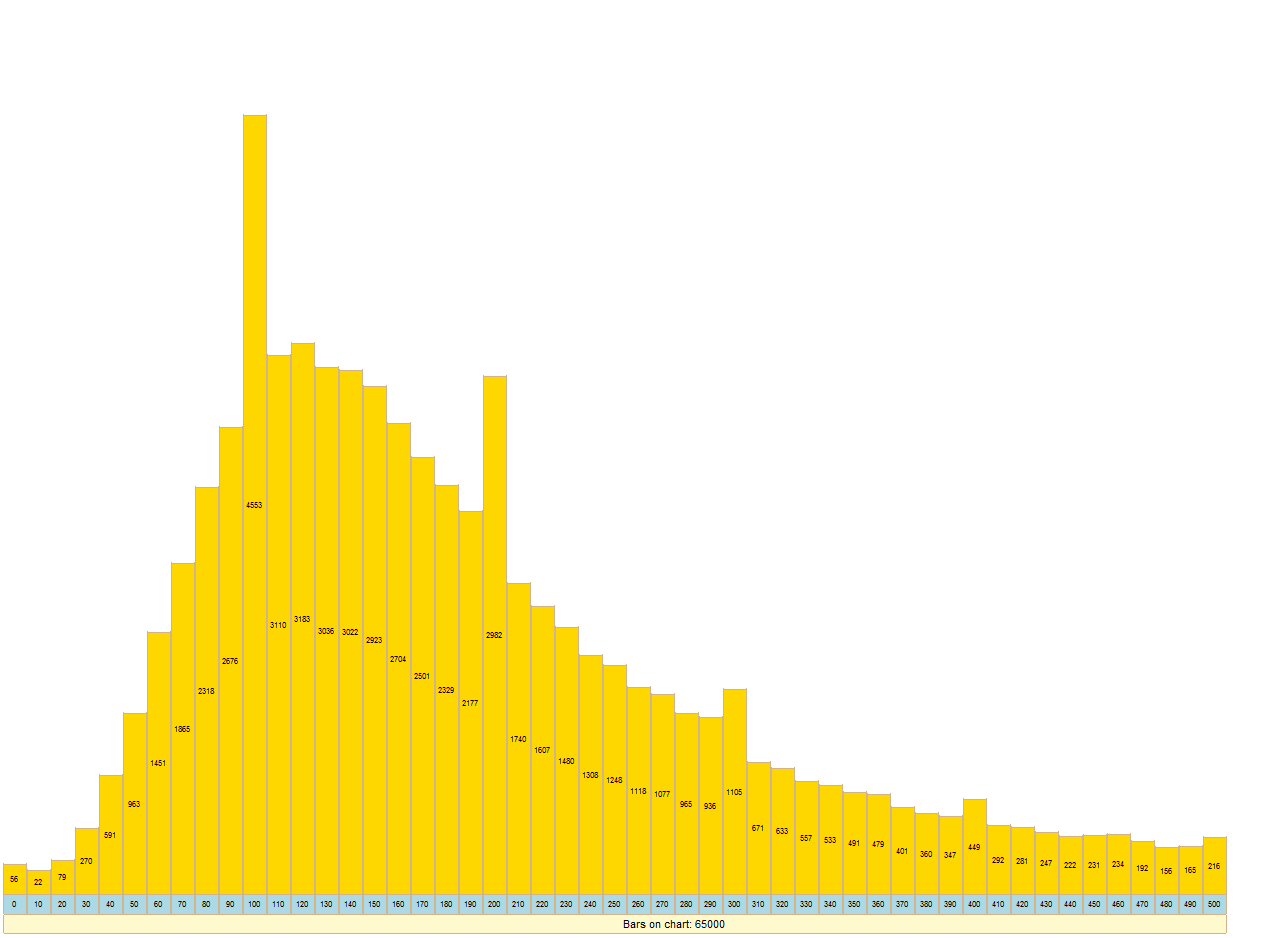
At the bottom, from left to right in the boxes are the number of pips, usually starts at 0 and takes steps like 10 or so up until 500 pips , or even more for H4 and up..
Then the numbers on the bars themselves, represent the amount of triggers, out of the total number of bars (65000).
The height, is there to give a visual, if that was not there, it would only be numbers, the peaks would be invisible without it.
So this means that for example, in the first graph, the highest count is at 100 pips, triggered 4553 times, out of 65000 bars, H1, so one hour bars.
It means that a 100 pip bar, on H1, is to be expected, 65000 / 4553 = once every 14 Hours.
The next one, which i think is typically, is at 200 pips, 65000/2982 = once every 21 Hours.
For the other chart there are some more calculations to be done.
I am by no means, saying that these numbers should be traded by anyone, these are just examples, and there are higher extremes, that happen less often, that can be more useful.
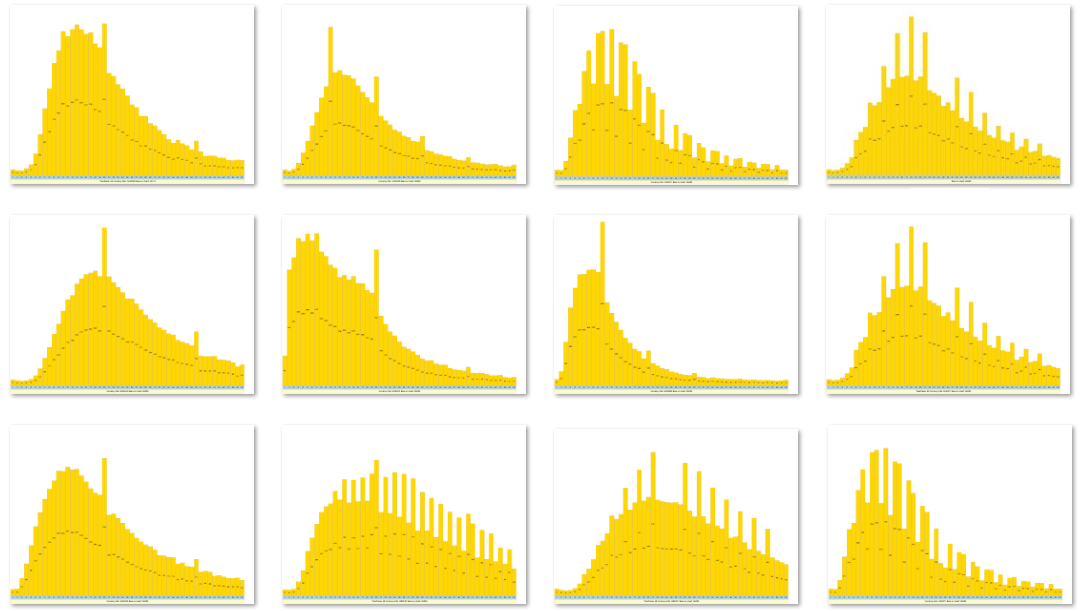
But the most important thing, is to not just calculate a few things, and apply them to all of your trades, like i said these things differ between currency pair's, and they differ quite a lot actually,
So the one that uses the same style and fixed set on any trade is assumed to have, limited success, if you do not want to gamble, or depend on luck, you do the math.
Here's a good visual on how these things differ.
Yes of course,
Very clear, thank you. Just a little question the number of pips is from high/low ? or open/close, or ?
Did you compare between brokers ?
Its High - Low so the product always becomes the entire move, but then it is still hard to sort,
because the products are very irregular so you can't just use == is equal to a fixed number, so instead you use > is higher then, && < lower then so all xxx.xxxxx fall in between,
and every time that happens ++; then it will give you the results in > < steps.
I have not tried it on several brokers it is an interesting thought..
That's for sure on my to do list, the results should be about the same, and if they are not, i will have to find out why..
- Free trading apps
- Over 8,000 signals for copying
- Economic news for exploring financial markets
You agree to website policy and terms of use
I would like to ask about ... how to decide the relationship between long and short term position sizes?
Long term positions naturally have larger stops ...
1. So ... should I reduce the position size for long term trades for equalizing the maximum loss percentages with short term positions?
2. Or ... should I trade the same size for both terms and should I take more risk per trade as percentages for long term positions ... for example, if my maximum loss for a short term trade is %2, then the maximum loss for a long term should be more than this, %4 for example.
I would be very grateful, if a person who has enough knowledge about money management helps me here ... thanks.