Libraries: MT4Orders QuickReport - page 3
You are missing trading opportunities:
- Free trading apps
- Over 8,000 signals for copying
- Economic news for exploring financial markets
Registration
Log in
You agree to website policy and terms of use
If you do not have an account, please register
What browser? How many transactions? I have 100,000 and it takes about 10 seconds to think, but it shows.
Chrome. 40K lines. From the second click sometimes the chart appears. Turnover-graphics formation loads CPU the most.
.
It will be difficult.
Chrome. 40K lines. From the second click sometimes the chart appears. Turnover-graphics formation loads CPU the most.
.
Here it is done through a file. There are no problems with automatic opening.
It will take a couple of days. I will postpone it if 5 million is not enough. Not relevant for now.
It's gonna be tough.
Also in the drawer. Add a line
#include <MT4Orders.mqh>easier)if 5 million isn't enough.
Why work with html-statements like this?
By the way, the library is 90% cross-platform - it works on MT4 and MT5. There is a little work to make it work on MT4.
.
Here it is done through a file. There are no problems with automatic opening.
You create a JavaScript text file, which is called from the HTML page (by the way, you can not save it to a separate file, but add it to the page code, as in my version).
I described a variant of saving data not to a text file, but to a binary file. It cannot be automatically loaded as a JavaScript file, because it is not JS code, you will have to select this file on the disc to start reading it. Perhaps then it will be possible to read more than 5.6 million lines.
Why work with html stats like this?
Didn't realise. Unfortunately, very slow this google.charts and inconvenient when compared to highcharts.
I changed it to highchart. It turned out to be better: google.charts froze at 700,000 deals, while highchart displayed them without special brakes and was able to zoom in to individual deals.
You can choose Ordinal - uniform step (as in MetaQuotes tester reports), or Logarithmic - logarithmic scale (it can be useful if you have exponential balance growth). After changing these items, you need to click again on the desired chart to apply the selected option.If someone finalises it - I'll update the code to be available to everyone.
I changed to highchart. It turned out to be better: google.charts froze at 700,000 deals, while highchart displayed them without special brakes and was able to zoom in to individual deals.
It's cool!
You can choose Ordinal - uniform step (as in MetaQuotes tester reports), or Logarithmic - logarithmic scale (it can be useful if you have exponential balance growth). After changing these items, you need to click again on the desired chart to apply the selected option.
Useful.
The chronology seems to be broken.
.
The chronology seems to be broken.
Only the MQ tester report had this. The virtual one did not have it.
I put all operations, including limit operations, into the array for charting. They do not change the balance, so they did not interfere much.
It turned out that the MQ tester transfers the deleted limit orders to the archive with a delay:
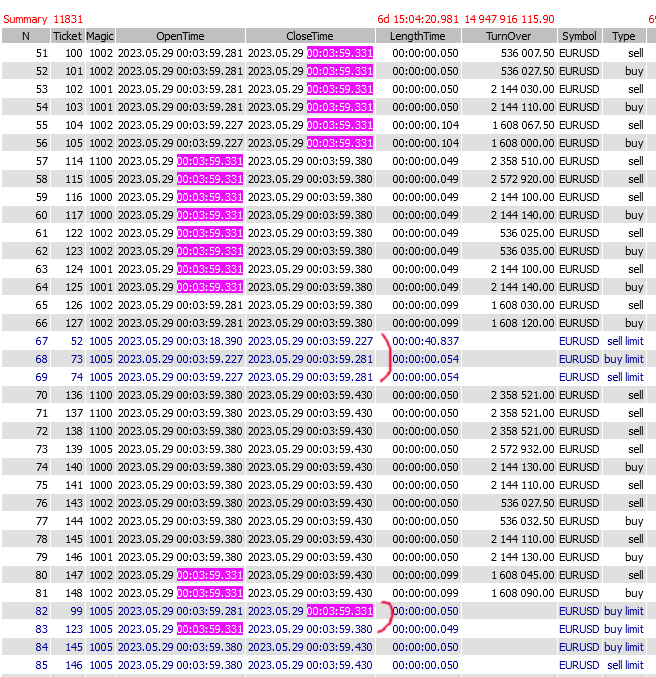
Order
got into the story 2 ticks later. Should have been after 00:03:59.331, tick 00:03:59.380 missed, moved to history at 00:03:59.430 tick.
Order
.
Closing time is correct, but apparently they have limit ones in a separate array and transfer to history is not processed on every tick.
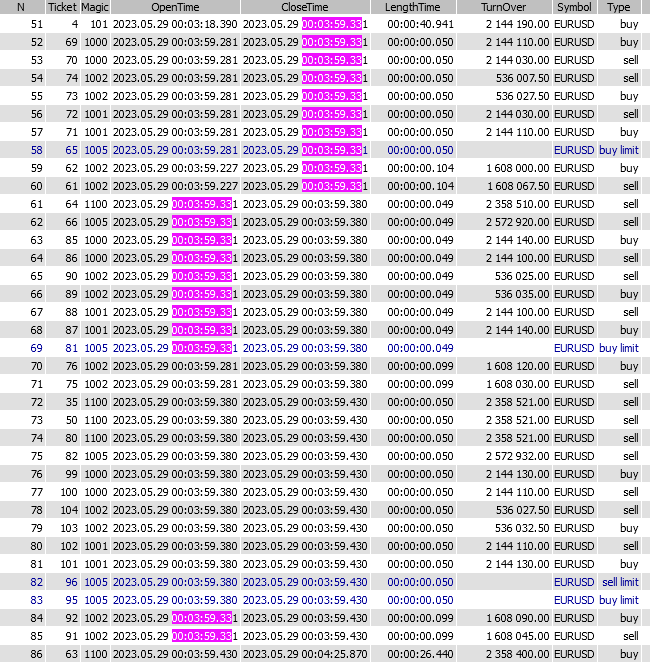
In your virtual tester, everything is clear: (the array is shared and is sent to history on its own tick)
I have removed the output of limits on charts, now these bars with wrong time are not there.