Libraries: MT4Orders QuickReport
How did the kodobase validator let the mq5 through without all the mqh files?
The author has done a great job! It looks great.
Since JS went JS, I suggest to improve in this direction.

Инструменты для анализа HTML-файлов MT4
- 2016.11.18
- www.mql5.com
Довольно часто возникает необходимость проанализировать html-документы, генерируемые МТ4. В частности, из-за того, что тестер стратегий МТ4 является одновалютным, при тестировании мультивалютных
Run it on a trading account.
#define  MT4ORDERS_BYPASS_MAXTIME 1000000 // Maximum time (in µs) to wait for synchronisation of the trading environment

#define  REPORT_BROWSER            // Open report in browswer automatically. Require DLL.
#include <MT4Orders_QuickReport.mqh> // https://www.mql5.com/ru/code/47816

void OnStart()
{
  QuickReport("QuickReport", true);
}
Comments.
- The browser did not start.
- Total commission did not match (CustomReport shows correctly).
графики отображают сделки во временном масштабе, а не в равномерном по номеру сделки. Так мы можем увидеть, что эксперт сделал 1000 сделок на 1-й неделе, а еще 52 недели бездействовал.
I use such a solution inside Report for this. Be friends with JS, so you can make any beauty from HighCharts-library and similar.
Highcharts Demos and Examples | Highcharts
- www.highcharts.com
Check out Highcharts demos and examples to learn how to create interactive charts with Highcharts core, Highcharts Stock, Highcharts Maps, Highcharts Gantt, and Highcharts Dashboards.
fxsaber #:
Run it on a trading account.
There was an opening only for the tester. I did the same for trading accounts. Now it will not open only in optimisation.Run it on a trading account.
Comments.
- The browser did not start.
- Total commission did not match (CustomReport shows correctly).
Commission - just adds up the column data with the commission.
I got the same:
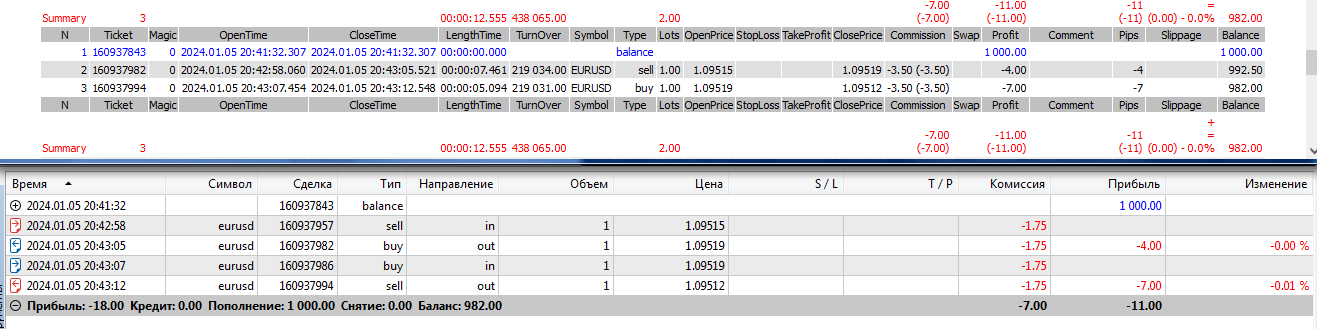
Maybe you have some commission operations there not from transactions (I saw in the Report code that you transfer them from balance to commission), but I have nothing to check this.
fxsaber #:
I use such a solution inside Report for this. You are friends with JS, so you can make any beauty from HighCharts-library and similar.
I wrote the code for charts myself about 2 years ago. The format of arrays passed to form a chart is the same as google.charts, because I originally used it. I use such a solution inside Report for this. You are friends with JS, so you can make any beauty from HighCharts-library and similar.
When there are a lot of deals, google.charts slows down. I am afraid that from 5 million and it will hang.....
That's why I made a quick version. Without additional functionality such as zoom and drag right to left, grid, etc., for quick evaluation of the chart.
.
So it was beautifully done, but I gave up in favour of speed.
Personally, I do zoom often, it would be a shame to give it up.
You are missing trading opportunities:
- Free trading apps
- Over 8,000 signals for copying
- Economic news for exploring financial markets
Registration
Log in
You agree to website policy and terms of use
If you do not have an account, please register
MT4Orders QuickReport:
Fast JavaScript version of Report library from fxsaber for MT4-style trading commands implemented via MT4Orders or Virtual. Works up to 10 times faster, NTML file size is smaller, can upload and display up to 5.4 million report lines.
Author: Forester