Discussing the article: "USD and EUR index charts — example of a MetaTrader 5 service"
Thank you for the article. I see something interesting and new for me actual appeared on the site.....
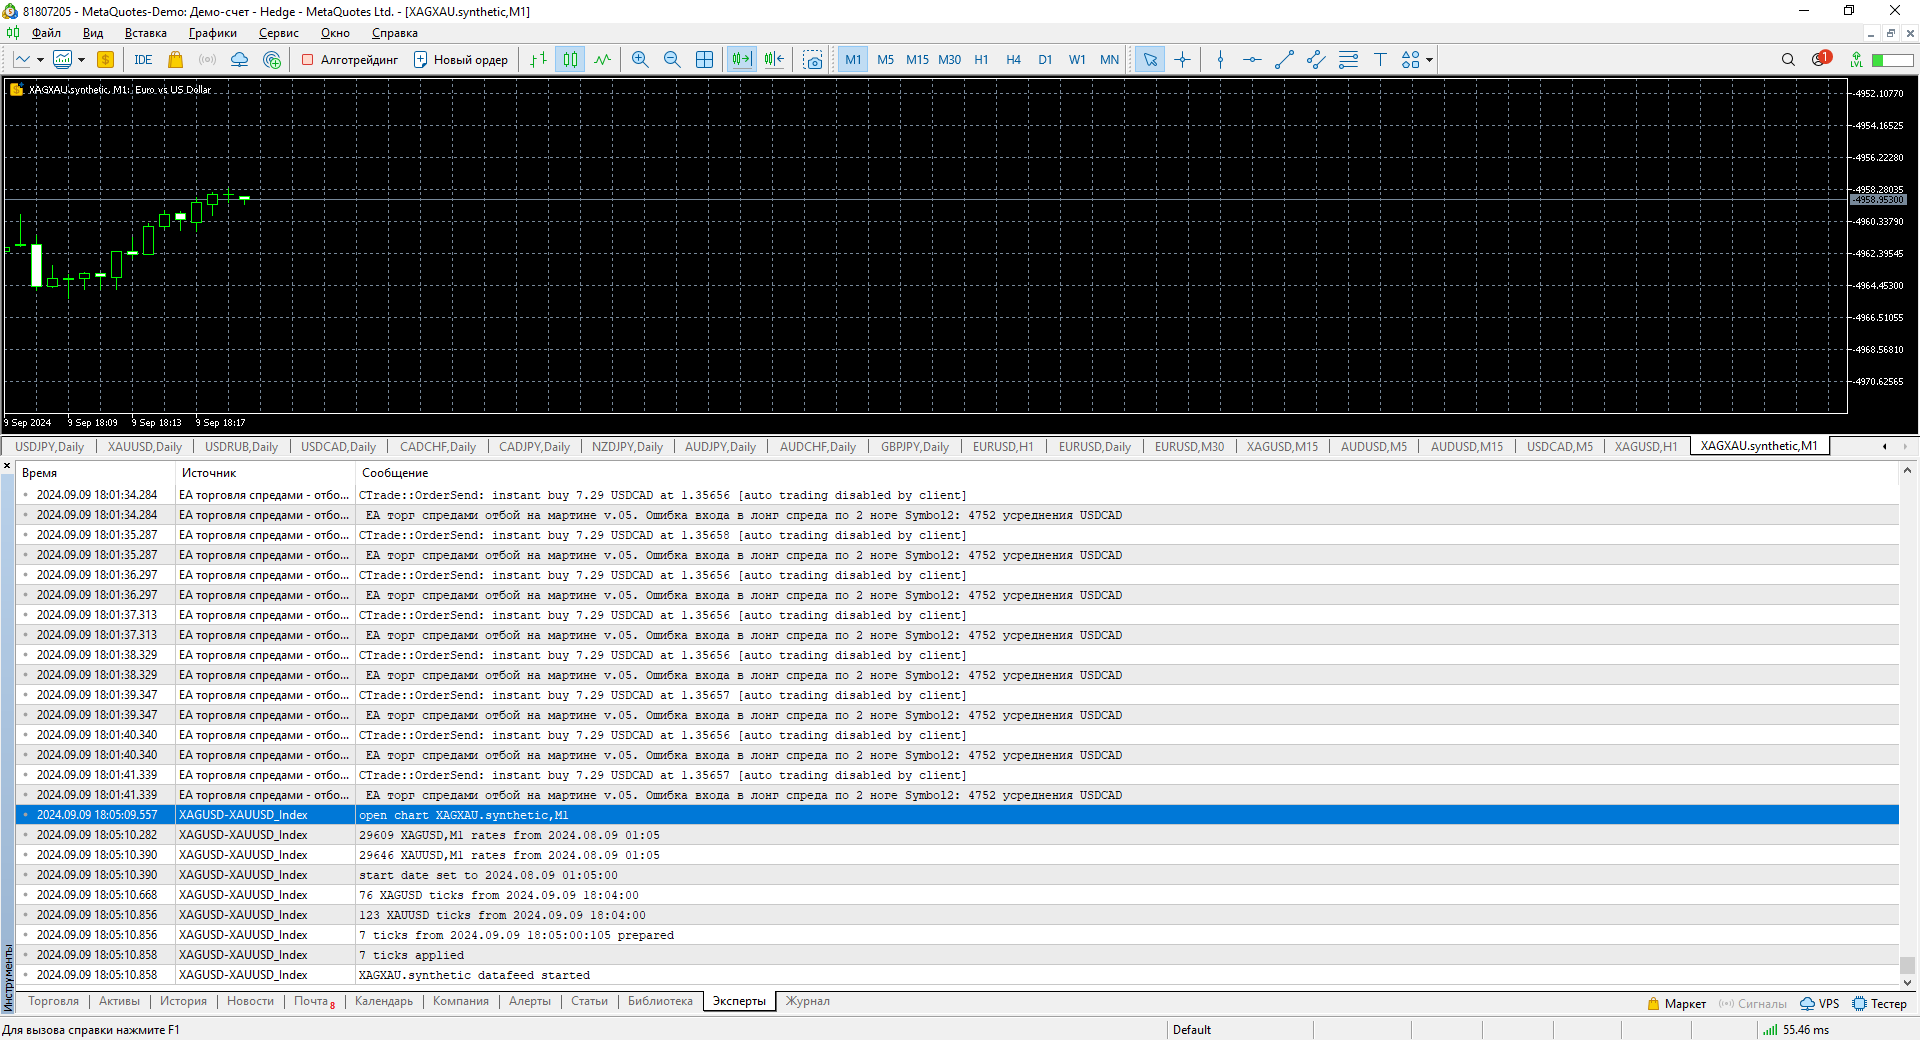
I myself make synthetics on trades in currency baskets. I took it for trading experience - I will review it again and make my synthetics by analogy.....
thank you very much to the author for opening new opportunities in index trading. I am currently forming synthetics on silver-gold metals....
as I understood from the material of the article at the present time by - candlestick is forming the chart of synthetic spread!!!!.
so far the flight is ok, if anything - with the author's permission I will additionally inquire about a variant of synthetics formation, where one or more of its symbols are reversed ... according to the edits in the f-ii. The optimal variant I already have an idea how to realise for trading.... and observations!!!
thank you very much to the author for opening new opportunities in index trading. I am currently forming synthetics on silver-gold metals....
as I understood from the material of the article at the moment by - candlestick formation of the chart of spread synthetics!!!!
so far the flight is ok, if anything - with the author's permission I will additionally inquire about a variant of synthetics formation, where one or more of its symbols are reversed ... according to the edits in the f-ii. The optimal variant I already have an idea how to realise for trading.... and observations!!!
You are welcome (from Slava, as the author of the code - also). Experiment on your health. One of the tasks of the articles is for the reader to think and do something for himself based on the materials.
Thanks for the article!
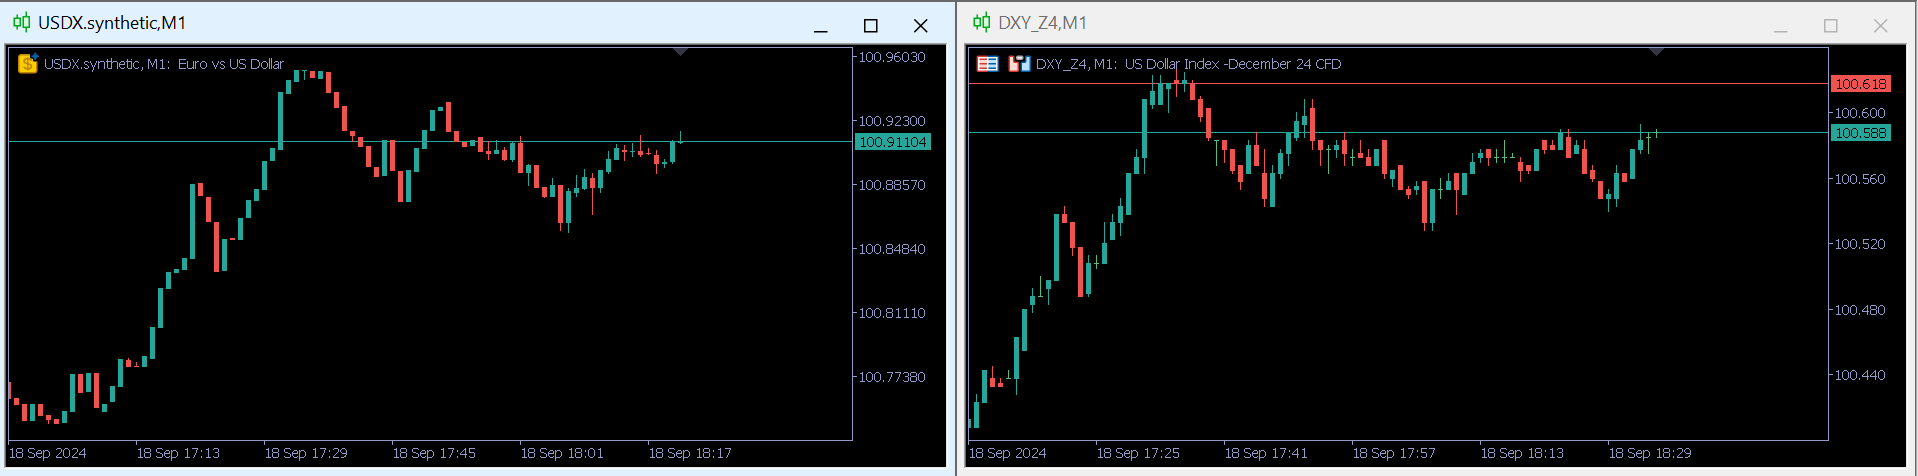
It turned out to be a great alternative for testing strategies using the dollar index,
Personally, I faced the problem that the broker does not have a single history of the dollar index, only CFD contracts with a certain maturity date.
The only thing is that in the proposed solution, the spread differs from the real symbol, but in my case it is not important, as the index itself is not traded in fact
Good afternoon!
Could you tell me how to get history for a larger period? For example, to get data for the last year....
I tried to figure it out myself, in the CurrencyIndex file in line 215 I replaced 31 with 365.
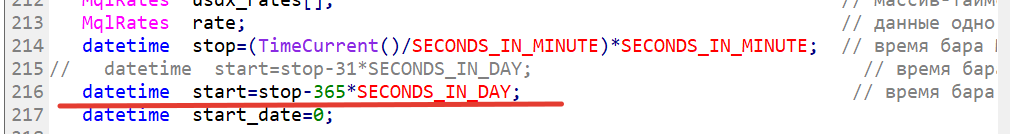
Alas I couldn't figure it out myself, please advise me.
Good afternoon!
How can I get the history for a longer period? For example, to get data for the last year...?
I tried to figure it out myself, in the CurrencyIndex file in line 215 I replaced 31 with 365
Alas I couldn't figure it out myself, please advise me.
Try gradually increasing the number of story days
Tried it,
I can't get the indexes from the examples earlier than 1 July...
I tried to make an index from 2 instruments, it swung a little deeper - up to 26th of June....
Tick history for the last year is available.
In any case, thanks for a useful tool )
thank you very much to the author for opening new opportunities in index trading. I'm currently forming synthetics on silver-gold metals....
Thanks for the tip, I did gold-silver a bit the other way round, essentially the same thing, and the interesting thing is that it can be traded ))) I need to check it out at least from the beginning of the year.
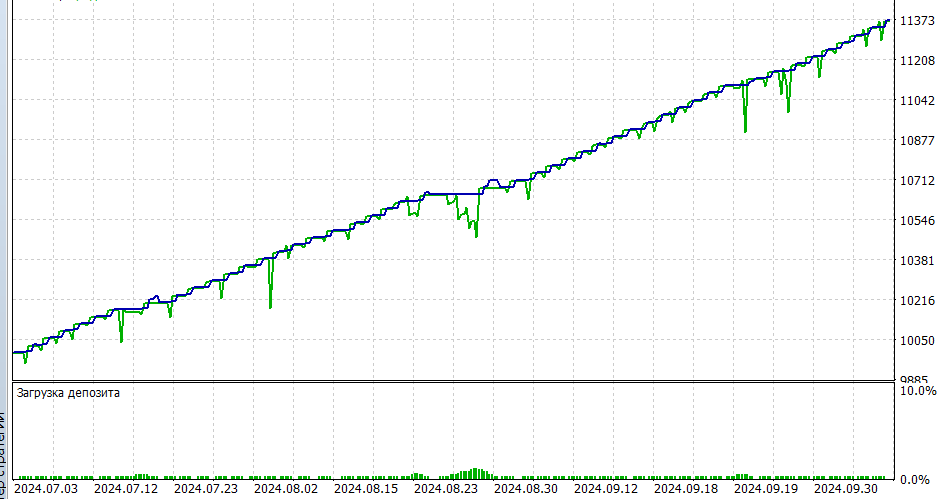
Thanks for the tip, I did gold-silver a bit the other way round, essentially the same thing, and the interesting thing is that it can be traded )))) need to check it out at least from the beginning of the year somehow
I want to add and see gold-silver-platinum to trade this portfolio.
Your chart - already - impressive.....)
- Free trading apps
- Over 8,000 signals for copying
- Economic news for exploring financial markets
You agree to website policy and terms of use
Check out the new article: USD and EUR index charts — example of a MetaTrader 5 service.
We will consider the creation and updating of USD index (USDX) and EUR index (EURX) charts using a MetaTrader 5 service as an example. When launching the service, we will check for the presence of the required synthetic instrument, create it if necessary, and place it in the Market Watch window. The minute and tick history of the synthetic instrument is to be created afterwards followed by the chart of the created instrument.
U.S. Dollar Index is the most popular index of the currency market. It allows us to predict the movement of exchange rates. This is an important indicator of the relative USD value. The US Dollar Index (USDX) was introduced in March 1973. Its base value was set at 100 points. In other words, the index equal to 90 points today would mean a 10% fall of USD relative to the 1973 figure, while the index equal to 110 points would mean a 10% rise.
Following the results of the Jamaica International Conference, floating rates for the currencies included in the index came into effect. Since then, the USD index has been calculated continuously based on currency trading data provided by the world's 500 largest banks. The method for calculating the US dollar index changed in 1999 after the introduction of EUR, which replaced the national currencies of a number of European countries.
Author: Artyom Trishkin