Problem with the loop of an indicator
Hey guys,
I will never understand how the loop of an indicator works. It's easy when I calculate the whole indicator with every tick but it should be a bit more efficient. Only the new bars should be calculated. I read many articles about prev_calculated , rates_total and so on. But obviously I am too stupid to understand this.
The following indicator should print a dot in the middle of a candle which has a higher high than the candle before and a lower low than the candle before. But only god knows why it doesn't work. Maybe anyone can help me? I am sure it has to do with the loop because the logic itself is just one line of code.
i+1 is the the next bar ,i-1 is the previous one
Also when testing arrow plots across compilations close the chart , compile then open a new chart and attach the indicator- Marbo: I will never understand how the loop of an indicator works.
See How to do your lookbacks correctly #9 — #14 & #19. (2016)
-
if (high[i]>high[i+1] && low[i]<low[i+1]) buffer[i]=(high[i]+low[i])/2;
In MT5, you must set the direction.
To define the indexing direction in the time[], open[], high[], low[], close[], tick_volume[], volume[] and spread[] and other arrays (copyXXXX functions), call the ArrayGetAsSeries() function. In order not to depend on defaults, call the ArraySetAsSeries() function for the arrays to work with.
Event Handling / OnCalculate - Reference on algorithmic/automated trading language for MetaTrader 5 -
If that is supposed to be non-series access, you are using future bars to calculate the current bar's value.
Hey guys,
I will never understand how the loop of an indicator works.
Please have a look
https://www.mql5.com/en/blogs/post/760917
I did my best to unveil the cryptic nature of indicator calculation loops in an easy to read format. I could have worded a few things better and fixed typos but I didn't have an edit option.

- www.mql5.com
Please have a look
https://www.mql5.com/en/blogs/post/760917
I did my best to unveil the cryptic nature of indicator calculation loops in an easy to read format. I could have worded a few things better and fixed typos but I didn't have an edit option.
Very helpful, thank you!
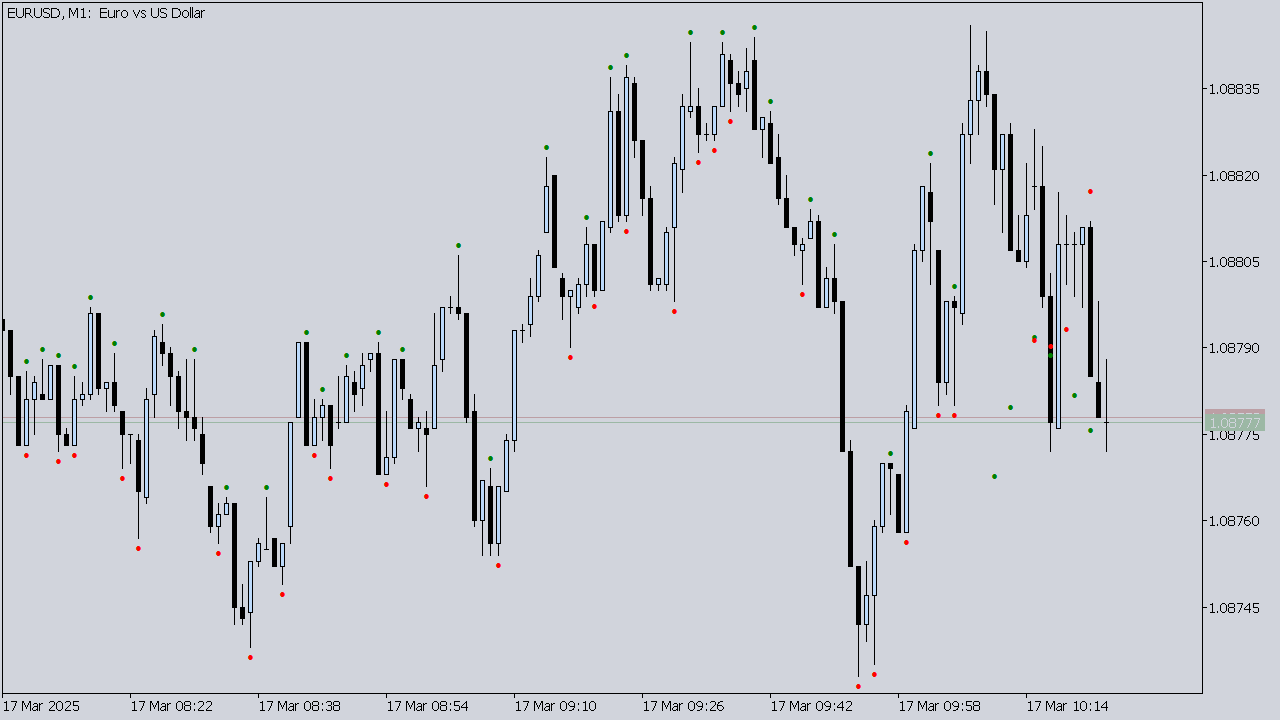
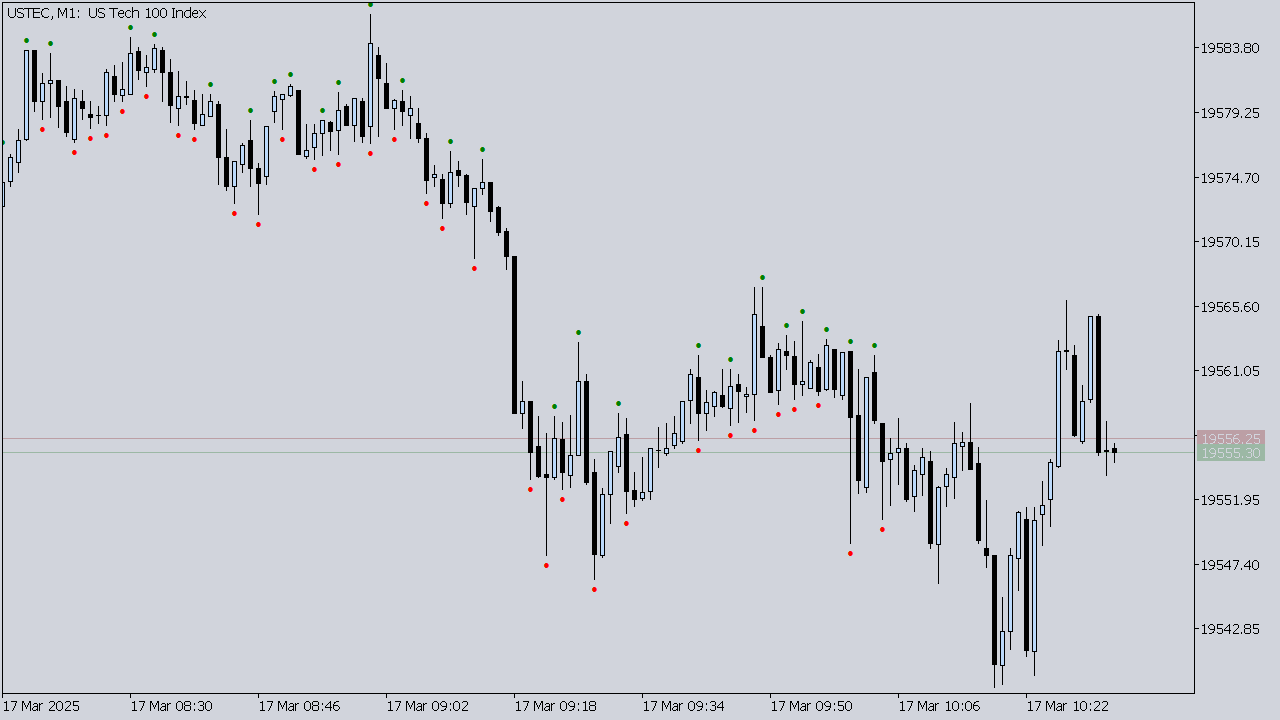
I have no idea what I am doing wrong here. Please have a look at the chart. The printed dots are a mess and as soon as I refresh the chart manually everything is correct.
When I attach the indicator to a new chart, everything is fine. When I change the timeframe, everything is fine. But when I don't work with the chart and only look at it the dots become a mess. And sometimes the indicator suddenly stops printing dots as you can see in the second chart.
#property indicator_chart_window
#property indicator_buffers   2
#property indicator_plots     2

#property indicator_type1   DRAW_ARROW
#property indicator_color1  clrGreen
#property indicator_width1  1

#property indicator_type2   DRAW_ARROW
#property indicator_color2  clrRed
#property indicator_width2  1

double bufUp[],bufDn[];

//+------------------------------------------------------------------+
//| Custom indicator initialization function                         |
//+------------------------------------------------------------------+
void OnInit() {
   IndicatorSetInteger(INDICATOR_DIGITS,_Digits);
   SetIndexBuffer(0,bufUp,INDICATOR_DATA);
   PlotIndexSetInteger(0,PLOT_ARROW,159);
   PlotIndexSetDouble(0,PLOT_EMPTY_VALUE,EMPTY_VALUE);
   PlotIndexSetInteger(0,PLOT_ARROW_SHIFT,-10);
   SetIndexBuffer(1,bufDn,INDICATOR_DATA);
   PlotIndexSetInteger(1,PLOT_ARROW,159);
   PlotIndexSetDouble(1,PLOT_EMPTY_VALUE,EMPTY_VALUE);
   PlotIndexSetInteger(1,PLOT_ARROW_SHIFT,10);
   ArrayInitialize(bufUp,EMPTY_VALUE);
   ArrayInitialize(bufDn,EMPTY_VALUE);
}
//+------------------------------------------------------------------+
//| Custom indicator iteration function                              |
//+------------------------------------------------------------------+
int OnCalculate(const int rates_total,
                const int prev_calculated,
                const datetime &time[],
                const double &open[],
                const double &high[],
                const double &low[],
                const double &close[],
                const long &tick_volume[],
                const long &volume[],
                const int &spread[]) {

   int start=(prev_calculated==0) ? 1 : prev_calculated-1;

   for (int i=start+2;i<rates_total-1 && !IsStopped();i++) {

      bool upFractal=high[i]>high[i+1] && high[i]>=high[i-1];
      bool dnFractal=low[i]<low[i+1] && low[i]<=low[i-1];

      if (upFractal) bufUp[i]=high[i];
      else bufUp[i]=EMPTY_VALUE;
      if (dnFractal) bufDn[i]=low[i];
      else bufDn[i]=EMPTY_VALUE;
   }
   return (rates_total);
}
Hey guys,
I have no idea what I am doing wrong here. Please have a look at the chart. The printed dots are a mess and as soon as I refresh the chart manually everything is correct.
When I attach the indicator to a new chart, everything is fine. When I change the timeframe, everything is fine. But when I don't work with the chart and only look at it the dots become a mess. And sometimes the indicator suddenly stops printing dots as you can see in the second chart.
I wrote this indicator a while ago to help another trader. It simply sets dots above and below every bar. You might find the loop in it useful.
//+------------------------------------------------------------------+
//|                                                    test_dots.mq5 |
//|                            Copyright 2024, Ryan Lawrence Johnson |
//|                     https://www.mql5.com/en/users/rjo/[REDACTED] |
//+------------------------------------------------------------------+

//--- store price, time, and volume data for access as in MQL4
#define SERIES(name,type)                               \
class C##name                                           \
{                                                       \
public:                                                 \
type operator[](const int i){return i##name(NULL,0,i);} \
}name;
SERIES(Open,double)
SERIES(Low,double)
SERIES(High,double)
SERIES(Close,double)
SERIES(Time,datetime)
SERIES(Volume,long)
SERIES(TickVolume,long)

#property copyright "© 2024, Ryan Lawrence Johnson"
#property link      "https://www.mql5.com/en/users/rjo/[REDACTED]"
#property version   "1.00"
#property indicator_chart_window

#property indicator_buffers 2
#property indicator_plots 2

#property indicator_type1 DRAW_ARROW
#property indicator_color1 clrAqua
#property indicator_width1 2

#property indicator_type2 DRAW_ARROW
#property indicator_color2 clrRed
#property indicator_width2 2

//--- settings
input int Padding = 30;

//--- variables on global scope
//int handle_indicator;

//--- arrays for indicator data buffers


//--- arrays for calculation buffers
double buff_up[];
double buff_down[];

//+------------------------------------------------------------------+
//| Custom indicator deinitialization function                       |
//+------------------------------------------------------------------+
void OnDeinit(const int reason)
  {
//--- remove indicator handles from memory
   //if(handle_indicator != INVALID_HANDLE) IndicatorRelease(handle_indicator);

//--- delete GlobalVariables
        //GlobalVariableDel("gvariable");

  }
//+------------------------------------------------------------------+
//| Custom indicator initialization function                         |
//+------------------------------------------------------------------+
int OnInit()
  {
//--- indicator buffers mapping
   SetIndexBuffer(0, buff_up, INDICATOR_DATA);
   SetIndexBuffer(1, buff_down, INDICATOR_DATA);
        //PlotIndexSetString(0, PLOT_LABEL, "indicator");
        PlotIndexSetInteger(0, PLOT_ARROW_SHIFT, -Padding);
        PlotIndexSetInteger(1, PLOT_ARROW_SHIFT, Padding);
//--- indicator handles
        //handle_indicator = iATR(NULL, 0, period); // or use iCustom if needed

//--- indicator short name
        //IndicatorSetString(INDICATOR_SHORTNAME, "indicator " + (string)period);

//---
   return(INIT_SUCCEEDED);
  }
//+------------------------------------------------------------------+
//| Custom indicator iteration function                              |
//+------------------------------------------------------------------+
int OnCalculate(const int rates_total,
                const int prev_calculated,
                const datetime &time[],
                const double &open[],
                const double &high[],
                const double &low[],
                const double &close[],
                const long &tick_volume[],
                const long &volume[],
                const int &spread[])
  {
//--- align indicator data direction with price data direction
        ArraySetAsSeries(buff_up, true);
        ArraySetAsSeries(buff_down, true);

   //int copyBars;
   int limit;
   int bar;

   //--- calculation of the starting bar index
   if (prev_calculated == 0) // check for the first call of OnCalculate function
    {
     limit = rates_total - 1;  // starting index for the calculation of all of the bars
     //copyBars = rates_total  - 1;
    }
   else
    {
     limit = rates_total - 1 - prev_calculated; // starting index for the calculation of new bars
     //copyBars = rates_total - 1 - prev_calculated;
    }

//--- fill the arrays for buffers with indicator data
        //if(CopyBuffer(handle_indicator, 0, 0, copyBars, buff_indicator) <= 0)
                 //return(0);

   //--- main loop
   for(bar = limit; bar >= 0; bar--)
    {
     //for(int i = 0; i < 1; i++)
      //{
       buff_up[bar] = High[bar];
       buff_down[bar] = Low[bar];
        //}
    }

//--- return value of prev_calculated for next call
   return(rates_total - 1);
  }
//+------------------------------------------------------------------+
sing the correct loop parameters is something I will probably never understan
It's OK, you don't have to feel stupid about it. It's hard to understand at first, but once you practice it, it all seems so elementary. I recommend you to familiarize yourself with the basic programming materials. Don't go deep right away , you will mess up your brain, nothing else. In the beginning write for example `how to use loops and arrays in c++` and you can get enough beginner material for example conveniently from youtube. Then you can delve deeper by experimenting yourself. Unfortunately, such knowledge is fundamental if you want to write something a bit more serious whatever the language.
- Free trading apps
- Over 8,000 signals for copying
- Economic news for exploring financial markets
You agree to website policy and terms of use
Hey guys,
I will never understand how the loop of an indicator works. It's easy when I calculate the whole indicator with every tick but it should be a bit more efficient. Only the new bars should be calculated. I read many articles about prev_calculated , rates_total and so on. But obviously I am too stupid to understand this.
The following indicator should print a dot in the middle of a candle which has a higher high than the candle before and a lower low than the candle before. But only god knows why it doesn't work. Maybe anyone can help me? I am sure it has to do with the loop because the logic itself is just one line of code.