Terminal slows down when using drawing type ZigZag
I did not try it, but I know that the Comment() function can significantly slow down a program.
So, I usually only execute it when I really need it and when the text needs to be updated.
There is a CodeBase publication about this, where they use a Graphical Object instead, specifically because Comment() is so slow.
Aleksandr Slavskii, 2024.11.14 17:29
A simple replacement for a comment. Works in the tester 50 times faster than the standard function.
I did not try it, but I know that the Comment() function can significantly slow down a program.
So, I usually only execute it when I really need it and when the text needs to be updated.
There is a CodeBase publication about this, where they use a Graphical Object instead, specifically because Comment() is so slow.
Thanks , i added the comment to check if it constantly accesses on calculate , it does not and still lags.
The chart becomes slow when you move it left and right , something in the display calculation perhaps due to it using 2 buffers
Setting both buffers of a ZigZag to the same value?
Why?
That has to definitely cause some conflicting internal calculation issues trying to render it.
At least set them to different values so that they can properly render.
Setting both buffers of a ZigZag to the same value?
Why?
That has to definitely cause some conflicting internal calculation issues trying to render it.
At least set them to different values so that they can properly render.
Still lagging.
Im basically trying to solve this :
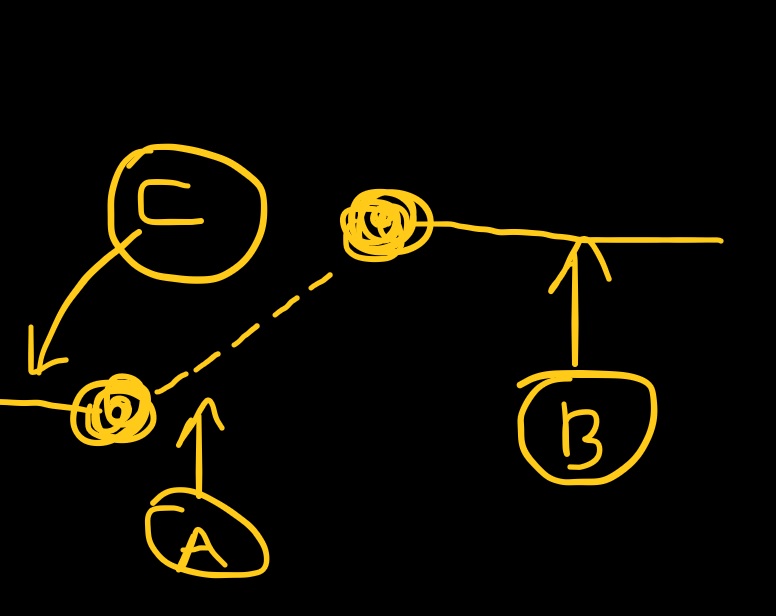
the line between two values of the displayed indicator line that is not horizontal is misleading because there is no way the user would have that data
if they were at the open time of the first bar (first full dot) so i want to not display the connection on A but keep the display on C and B
(doing it with the canvas works but im losing the tester as if a user pauses simulation to inspect ,the canvas wont have a way to update as they move the chart around to inspect performance)
In order to get a straight vertical line to connect the bottom and top (like a Kagi chart), requires that you keep switching/inverting the buffer values at the swing points.
This is because the ZigZag always connects between opposite prices (low to high, then high to low, and so on).
The example code in the documentation even shows this ...
One way to have zigazg interruptions (not displaying the connection), is to use two colour zigzags plots, but alternating between them, and using clrNONE for the unwanted connections.
So when you don't want a connection, you set it to the index of the clrNONE, and switch the data the secondary zigzag. And at the next "missing" connection, you do the same and switch back to the primary zigzag.
By alternating between the two you can have section gaps (which are actually still there but without any colour assigned to them).
Good idea, but the zig zag plot is making the chart sticky
prev_calculated index is sometimes negative, ensure that it is always greater or equal to zero. What kind of zigzag are you trying to use? the metaquotes one needs the most recent 100 bars for the algo to initialize properly
so a start index optimization could be:
int start = (prev_calculated < 0) ? 1 : prev_calculated - 100;
Even when it uses 100 bars of history, the terminal should not be slow, because if you load the normal zigzag, it's super fast when toggling between timeframes
-- Edit:
I assumed you were loading the metaquotes zigzag with iCustom and using zigzag drawing style with that
Eitherway, the start index should not be prev_calculated in any case
prev_calculated index is sometimes negative, ensure that it is always greater or equal to zero. What kind of zigzag are you trying to use? the metaquotes one needs the most recent 100 bars for the algo to initialize properly
so a start index optimization could be:
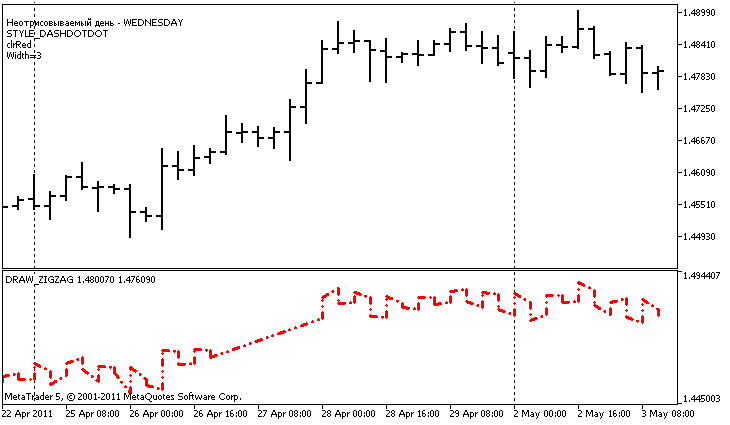
Even when it uses 100 bars of history, the terminal should not be slow, because if you load the normal zigzag, it's super fast when toggling between timeframesGood morning , not the zig zag as in the H/L algorithm , the DRAW_ZIGZAG draw type .
Not doing any complex calculation , just copying the high and the low.
What happens is the chart becomes laggy and slow when scrolled after it renders the DRAW_ZIGZAG draw type buffer.
Im suspecting its something within the render functions of the indicator stack of a chart.
The DRAW_ZIGZAG allows for 2 values within one bar so i'm trying to test how i can break the line connection between 2 levels.
As shown in the drawing i don't want the user to be able to see the connecting non horizontal lines simply because between the end of the previous "estimate" and the new "estimate" the user has no way of knowing where the new estimate will land. The connecting lines start existing after the destination point has been discovered.
Given its 100% certain users wont read the description (xD) and start analyzing based on the connecting lines ,i would rather obscure those lines completely.
So there is probably an error in MT5 in the indicator rendering code , if this is replicated on your terminals too , essentially.
Build 4755
As shown in the drawing i don't want the user to be able to see the connecting non horizontal lines simply because between the end of the previous "estimate" and the new "estimate" the user has no way of knowing where the new estimate will land. The connecting lines start existing after the destination point has been discovered.
I find it difficult to understand what you mean in saying "the connecting non horizontal lines"
Is it possible to see an actual chart screenshot of the undesired situation?
I made this before with the zigzag drawing style:
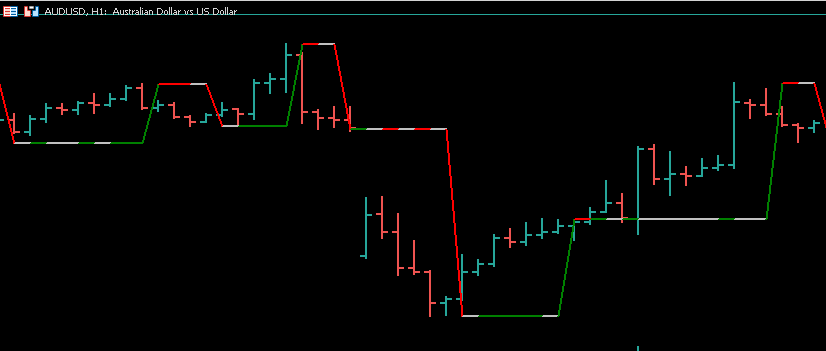
not sure if that is what you were going for
It doesn't lag when using a specific bar lookback
Edit:
Using this as the start index will make it non lagging and thread safe:
int start = (prev_calculated == 0) ? 1 : prev_calculated - 1;

for(int i = start; i < rates_total; i++)
 {

 }
- Free trading apps
- Over 8,000 signals for copying
- Economic news for exploring financial markets
You agree to website policy and terms of use
Hi
When i run the indicator below the chart becomes extremely laggy:
Let me know if it happens on your side too