I'm trying to build an indicator using multiple fractals in order to spot support and resistance levels. The thing is I want multiple consecutive fractals to be close to each other in order to form a valid level, like if we draw a line linking them; it needs to appear nearly horizontal.
But "close to each other" change a lot depending on the time frame; 0.5% difference can be considered close on the daily but it would be way too big for the M5 chart, you see the problem?
What can I use which would work across all time frames?
That's a good idea, is ATR better than StdDev or fractals clustering technique for defining accurate levels though?
If you like the idea of support and resistance with ATR like what was discussed here, you can check this indicator
https://www.mql5.com/en/code/47048
I changed the colours personally as I hate colorful shit. But the indicator itself...very very good, tried and tested

- www.mql5.com
I don't think consecutive fractals are going to be close to each other, and if they are, they're not decent fractals...it makes more sense to draw horizontal lines on timeframe candle extremums or highest/lowest price of the day
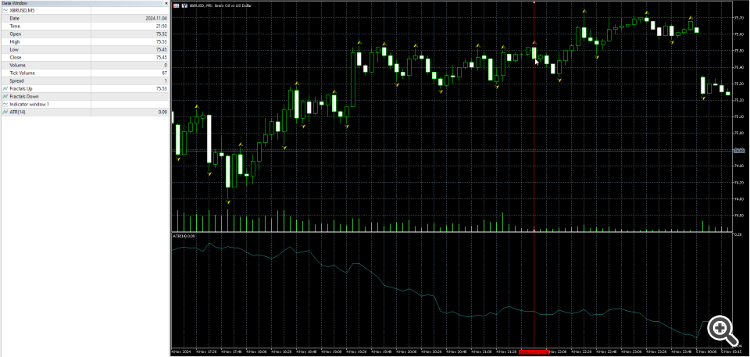
What do you mean? See example below
The highest is 75.53 while the lowest is 75.50 so max 0.03 difference.
Hence, the last 6 up fractals (from red line) are within 1/3*ATR from each other.
What do you mean? See example below
The highest is 75.53 while the lowest is 75.50 so max 0.03 difference.
Hence, the last 6 up fractals (from red line) are within 1/3*ATR from each other.
I mean too close to each other with time (not price). Because too many fractals isn't that good. A strong reliable fractal is better, for example, a price where a strong price divergence is more likely to occur (or is occurring)
It depends on your objective.
A lot of consecutive aligned fractals in the last 15 bars or so often shows that the price is about to break it.
- Free trading apps
- Over 8,000 signals for copying
- Economic news for exploring financial markets
You agree to website policy and terms of use

I'm trying to build an indicator using multiple fractals in order to spot support and resistance levels. The thing is I want multiple consecutive fractals to be close to each other in order to form a valid level, like if we draw a line linking them; it needs to appear nearly horizontal.
But "close to each other" change a lot depending on the time frame; 0.5% difference can be considered close on the daily but it would be way too big for the M5 chart, you see the problem?
What can I use which would work across all time frames?