What to feed to the input of the neural network? Your ideas... - page 80
You are missing trading opportunities:
- Free trading apps
- Over 8,000 signals for copying
- Economic news for exploring financial markets
Registration
Log in
You agree to website policy and terms of use
If you do not have an account, please register
The Problem of Numbers.
Samples, each of n numbers, fed to the inputs X[0 ... n-1] in the process of training, should be pre-trained (normalised) in such a way that they are EQUAL to each other, other things being equal.
In the context that the Y value at the output of a matched neuron is the sum of X[0]*W[0] + X[1]*W[1] + X[2]*W[2] + ... + X[n-1]*W[n-1], this equivalence can be achieved in only one way :
The sums of the values |X[0]| + |X[1]| + |X[2]| + ... + |X[n-1]| of all training samples should be equal.
Where W[n] is taken as "other equal condition" equal to X[n].
That is, already taking into account the "other equal condition", two samples are numerically equivalent if their sums X[0]^2 + X[1]^2 + X[2]^2 + ... + X[n-1]^2 are the same.
For example :
If some sections of price by its increments X[n][k]=close[n][k]-open[n][k], where n is the value number of X and k is the sample number, are used as a training sample bag,
then the sum of the values |X[0][k]| + |X[1][k]| + |X[2][k]| + ... + |X[n-1][k]| denotes the path length of the curve travelled by the price within a given sample k.
That is, the training samples k must be pre-normalised to each other, in the physical sense of this example, literally by their length of the price curve path.
And now it is possible (and necessary) to perform another normalisation for them, under the range not less / not more than -+1, by dividing all X[n][k] by max, where max is the maximum |X[n][k]| found from all X[n][k].
And then, in the learning process, these normalised samples X[0 ... n-1][k] are fed as training samples, each having its own score d[k], which determines the contribution of this sample to the aggregate learning result.
Again :
I suppose that training should not be done with all available samples k, but only with those that have a "decent" (I use such a word) score d[k].
However, in order to make a "worthy" sample, we still need to have all samples k with their d[k] scores.
However, this is another topic ...
Absolutely
I described the theory: the point of NS is to filter the rough TSs that show something. And not to search for the grail.
And I described the approach: manually search for any TS that shows at least some results.
And filter it with NS.
Here is the original TS.
Unfit for trading, but showing signs of life .
And here is the same one, only filtered by Python NS: LSTM-key.
Samples, each of n numbers, fed to the inputs X[0 ... n-1] during training, must be pre-trained (normalised) so that they are EQUAL to each other, other things being equal.
In the context that the Y value at the output of a matched neuron is the sum of X[0]*W[0] + X[1]*W[1] + X[2]*W[2] + ... + X[n-1]*W[n-1], this equivalence can be achieved in only one way :
The sums of the values |X[0]| + |X[1]| + |X[2]| + ... + |X[n-1]| must be the same for all training samples.
Where W[n] is taken as "other equal condition" equal to X[n].
That is, already taking into account the "other equal condition", two samples are numerically equivalent if their sums X[0]^2 + X[1]^2 + X[2]^2 + ... + X[n-1]^2 are the same.
For example :
If some sections of price by its increments X[n][k]=close[n][k]-open[n][k], where n is the value number of X and k is the sample number, are used as a training sample package,
then the sum of the values |X[0][k]| + |X[1][k]| + |X[2][k]| + ... + |X[n-1][k]| means the length of the path of the curve travelled by the price within a given sample k.
That is, training samples k must be pre-normalised to each other, in the physical sense of this example, literally by their path length of the price curve.
And now it is possible (and necessary) to perform another normalisation for them, under the range not less / not more than -+1, by dividing all X[n][k] by max, where max is the maximum |X[n][k]| found from all X[n][k].
And then, in the learning process, these normalised samples X[0 ... n-1][k] are fed as training samples, each having its own score d[k], which determines the contribution of this sample to the aggregate learning result.
Again :
I believe that training should not be performed with all available samples k, but only with those that have a "decent" (I use such a word) score d[k].
However, to make a sample of "worthy" ones, we still need to have all samples k with their d[k] scores.
However, this is another topic ...
You write interestingly
This is where the dissonance with problem number theory comes in:
After all, prescribing "strength" to a pattern is tantamount to finding a grail, roughly speaking. There is no need for NS, just take patterns with the highest power (numerical) index, combine them with another similar pattern and open a position, because according to this logic the probability of winning is supposedly higher.
That's why I wanted to get away from numbers, or to find a method that would somehow objectively (as objectively as possible) give a certain power to a pattern, which in some context (mixture with other patterns) gave a high probability of working out.
Then there is a sense of pre-processing.
The problem of numbers.
...
...
Samples, each of n numbers, fed to the inputs X[0 ... n-1] during training, should be pre-trained (normalised) in such a way that they are EQUAL to each other, other things being equal.
...
Again :
I believe that training should not be done with all available samples k, but only with those that have a "decent" (I use such a word) score d[k].
However, to make a sample of "worthy" ones, we still need to have all samples k with their d[k] scores.
...
One of the options (just an example) how to formalise information on a chart into some non-term number (endowing it with some objective force factor relative to other graphical information) is support and resistance levels. Let's assume that they are formalised. And the price bounces or breaks through them. It clings to them or ignores them.
In this case, the numbers denoting each successive price on the chart will be the same MinMax window, only the maximum value will be this very C/R level. If the price is near it - then 0.9 (-0.9) and closer to 1. If the price is far from it, it is closer to 0.
If one price is on one side of the level and the other is on the other side, then we change the polarity of each side: on the one side closer to the level - these are minus maxima, and on the other side - positive numerical maxima.
This is just a sketch, an example of what numbers should be. Not just a position relative to other numbers in the window, but a reflection of some market context.
Another option: we express patterns through numbers. And here we have a candlestick pattern A of one candle, after which the price goes up 55 times out of 100 on the history. The next pattern AB (candlestick combination of 2 candles) is followed by 48 up and 52 down. The third candlestick combination ABC (a combination of three candlesticks) works out 53 up and 47 down.
And here we have one pattern with a historical overweight up, the other overweight down, the third up: 5, -1, 3.
We combine into a window, normalise into the range of -1..1 and we will have numbers for the input of the NS: 1, -1 and0.4286.
This is an example of the fact that the quantitative factor, being decisive for the mathematical NS, carries objective information about the market and the task of the NS is to choose what of this objective information can be useful for stable trading.
And not to frantically extract something from the absolute rubbish, which is the average numerical set for the NS input.
L1, L2 normalisations. (regularisations) are described. Usually they are already built into the MO.
If there is much more rubbish than good examples (which is typical for a typical forex dataset), no approach will help.
It is obligatory
I described the theory: the point of NS is to filter rough TSs that show something. Not to search for the grail.
And I described the approach: manually search for any TS that shows results at least a little.
And filter it with NS.
Here is the original TS.
Unfit for trading, but showing signs of life .
And here is the same one, only filtered by Python NS: LSTM-key.
If it doesn't show in real life, but is taken from the tester, it is still overfit.
And here's how the convolution behaves (CNN)
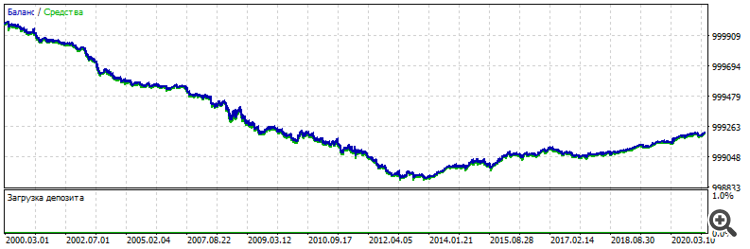
Backtest of the original crude simple TC:
2000-2021
Its forward is
Working method:
- look for some TS, check it on the forward: it should at least not drain. Subjectively evaluate its work.
- before opening a position, we record information from the chart (experimentally - any) - in the input set. (I did it with a script)
- we record the result of the deal in the target for the previously recorded input set.
- we go through the whole training period.
- submit to the NS and train it
- add "if (.... && out > Open_level)" to the position opening condition
- optimise in MT5: twist and turn the threshold relay (the only parameter to optimise in the optimiser of the MT5 tester)
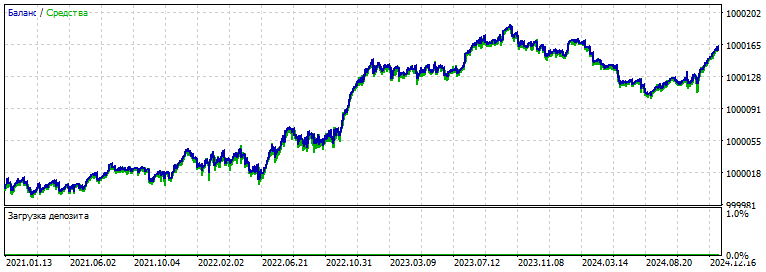
- choose the set you like, for example below - the same chart as the first one from above, but "filtered" by the NS.
- check forward 2021-2025
For comparison BiLSTM ( previous attempt)
As input: 1000 (!) normalised prices.
(I keep dreaming of the idea to formulate and design a market context for NS. And the first thing it should contain: a lot of units of information.)
Above was a simple method of exploiting NS until we figured out how to teach it to search for TCs onits own.
I guess we'll have to dive into the MOE section about learning without a teacher, datamining, and so on. The truth is buried in there somewhere.
Notes on NS: retraining is 99% of the work. That is, to arrive at this result (above), you had to sit around for half a day setting up the architecture. There is no voshleb stick on hyperparameter settings. And there are dozens and hundreds of ways to "tweak" something, you can't learn everything.
But in the process of picking you understand or feel the vector of thought direction. Where to poke and what to cook.
At the current moment, looking back at all the many years of effort with these networks, one thing I can say for sure: there is not enough functionality for selecting models.
1) Initialise weights randomly. Ok.
2) Training is started and here is the most interesting part:
3)Each set of weights should be checked on the forward by user-defined criteria: for example, by recovery factor.
4) As soon as the forward has improved - autosave (autosave) the model with the profit graph displayed on the screen. All saved graphs should be visible and scrollable so that the user can view the progress in parallel.
5) At the next iteration, if the model has deteriorated (overlearning has started or just an unsuccessful set of weights) - go back to the previous model and change the Learning rate. We continue until the learning rates improve.
6) If the learning rates do not improve or the user does not like the progress vector of the learning results - interrupt the training and start it again with a new initialisation of the weights.
7) We modify this basic process with additional functionality on demand: for example, we introduce auto-addition of neurons at new training, layers, change activation functions or loss functions, optimisation functions (Adam to BFG+momentum and others), and so on and so forth.
That is, we create a maximally useful search engine for finding a working model.
And we don't do it all by hand.
The space of weights is such a map of space, in which there is an infinite number of white dots. With each new weight the number of possible combinations of multiplication results on the same infinite combinations of input numbers exceeds the mark of the number of stars in the sky.
Each initialisation is a point on this map, a point of infinitely small size. And learning is a trek to neighbouring points. If a given cluster of points is far away from the "hail" point, it is better to knock it out immediately and start learning again. A new initialisation of scales is another, random point on this huge map. And a new training is a new "probing" of the space around.
An ideal formula (method) of finding the necessary set for NS (somehow analysing this map) is something from the fiction section. And as food for thought, how to solve or how to bypass these quantitative limitations.
And constant reinitialisation with a new start of training is at least the simplest and most accessible method to approach the best neural network setup.