Multi timeframe indicators, what do you think? - page 7
You are missing trading opportunities:
- Free trading apps
- Over 8,000 signals for copying
- Economic news for exploring financial markets
Registration
Log in
You agree to website policy and terms of use
If you do not have an account, please register
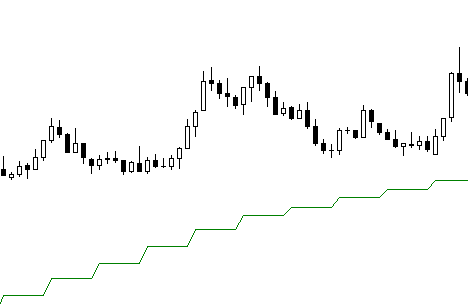
We should obtain a "dish" of 6 bars (6 * 5 = 30), as shown in this image.
In your icustom code there is a very good chance that you are asking for just one bar, as is very often done for all bars after initialization
Count will be equal to 1
and it's wrong.
Look in the tester what you are going to get.
We don't have a "dish" because the "dish" is made up in our case of 6 bars and copybuffer will only retrieve one.

In fact what the graph shows is the last value of the M30 average.
To get the correct representation, you have to go and find the 6 bars with the copybuffer, i.e.
The entire 6-bar "dish" is then updated as it goes along.
lets not make thing complicated.
This is not a desire to complicate things.
Personally, I don't do high frequency trading.
Even though algo trading can be very different from manual trading, I think you have to get closer to what they do.
If your comment was for my previous post, namely how to exit a trade, I think the complication is necessary.
Knowing and being able to tell an EA if the trade is poorly engaged and losses need to be tightened, I find that useful.
On the contrary, if the trade, the trades are well engaged and the period is prosperous, it would be a shame to exit on SL or too tight trailing stop.
Here again I think this is going in the right direction.
And for me these notions of trend cannot be found on the current timeframe but only on a higher timeframe.
Now all opinions are valid
So in the end something quite similar in the reasoning for varying the stop values.
Do you want the indicators presented above to do some tests?
sure. but I already have my indicators working on multiple timeframes; my eas doing that automaticly. I rarely add my indicators to the charts now as I prefer to let the ea do "its thing". When I am in dd then I just "cut and run"; close all trades, no matter how big the dd after. I know that I will make it up the following week.
But sure, I like the look of both the multi tf indicators; namely the multi tf rsi, was it? and the multi tf ma i have several, but i wll check out yours too.
⚠️ Please be advised that any forum discussions about Indicators or any other MQL program, should be accompanied by source code or be in reference to source code available in the CodeBase or Articles, or in other forum discussions.
If no code is provided or invitations are made to private discussions to obtain said code, then that will be considered advertising or self-promotion, which is not allowed.
If you wish to discuss these without public release of the source code, then please do so using you own personal blog and link them on your profile page.
Your topic has been renamed and moved to the section: Technical Indicators
When discussing custom indicators, please provide the source code with your post, or provide the reference link to its code, in the CodeBase, Article or another forum post.
Question for traders.
I am currently looking into the definition of supports and resistances.
That is to say the protocol for tracing them.
I'm staying on my MTF topic, because I think we can't have the same criteria for plotting R&S on the daily or even higher in the same way that we plot R&S on an M5 for example.
Thank you for your upcoming thoughts.
Good morning
Question for traders.
I am currently looking into the definition of supports and resistances.
That is to say the protocol for tracing them.
I'm staying on my MTF topic, because I think we can't have the same criteria for plotting R&S on the daily or even higher in the same way that we plot R&S on an M5 for example.
Thank you for your upcoming thoughts.