Discussing the article: "Brute force approach to patterns search (Part VI): Cyclic optimization"
формулы 2

Let's understand what is inside this formula:
- N - the number of fully opened and closed trading positions throughout the entire backtest or trading section.
- B(i) - the value of the balance line after the corresponding closed position "i".
- L(i) - the line drawn from zero to the most recent balance point (final balance).
It seems to be almost Sharpe:
//--- calculate logarithms of increments from the equity array
   for(int i = 1; i < m_bars_counter; i++)
     {
      //--- add only if equity has changed
      if(m_equities[i] != prev_equity)
        {
         log_return = MathLog(m_equities[i] / prev_equity); // logarithm of increment
         aver += log_return;            // average logarithm of increments
         AddReturn(log_return);         // fill the array of logarithms from increments
         counter++;                     // yield counter
        }
      prev_equity = m_equities[i];
     }
//--- if there are not enough values to calculate the Sharpe ratio, return 0
   if(counter <= 1)
      return(0);
//--- average value of the logarithm of the increment
   aver /= counter;
//--- calculate the standard deviation
   for(int i = 0; i < counter; i++)
      std += (m_returns[i] - aver) * (m_returns[i] - aver);
   std /= counter;
   std = MathSqrt(std);
//--- Sharpe Ratio on the current timeframe
   double sharpe = aver / std;

- www.mql5.com
There's something similar, but only at first glance. Everyone misses the balance sheet growth model. If the slope of the balance growth is constantly falling (the second derivative of the balance curve is negative), then such a model is not preferable, because soon it may go negative. The whole point is to select those curves that graphically look the most promising.
There are similarities, but only at first glance. Everyone misses the model of balance growth. If the slope of balance growth is constantly falling (the second derivative of the balance curve is negative), then such a model is not preferable, as it may soon go into negative territory. The whole point is to select those curves that graphically look the most promising.
The Sharpe algorithm for descending curves will give a negative value. I have given you only for analogy, there is no point in discussing Sharpe....
Examples from my experience.
- criterion "beautiful curve" - does not pass OOS.
- criterion "ugly curve" - passes OOS, while the curve itself turned out to be beautiful.
- Zero commission - does not pass OOS.
- Commission is set - passes OOS.
I.e. it turns out that when optimisation is for beauty, the fitting component is high. When something worthwhile is found, it looks beautiful.
That's why I don't look for beauty myself. I rely more on the number of deals and the algorithm of the TS core. The goal is to get beauty without beauty criteria. As a rule, this variant passes OOS.
ZY The variant with a commission is more interesting (but, as a rule, vice versa: less commission - more probability of finding a pattern). It actually reduces the number of transactions (statistical significance), but increases the probability of a successful search.
The Sharpe algorithm for downward curves will produce a negative value. This is just for analogy, there is no point in discussing Sharpe.....
Examples from my experience.
- The criterion "beautiful curve" - does not pass OOS.
- criterion "ugly curve" - passes OOS, but the curve itself turned out to be beautiful.
- Zero commission - does not pass OOS.
- Commission set - passes OOS.
I.e. it turns out that when optimisation is for beauty, the fitting component is high. When something worthwhile is found, it looks beautiful.
That's why I don't look for beauty myself. I rely more on the number of deals and the algorithm of the TS core. The goal is to get beauty without beauty criteria. As a rule, this variant passes OOS.
ZY The variant with a commission is more interesting (but, as a rule, vice versa: less commission - more probability of finding a pattern). It actually reduces the number of transactions (statistical significance), but increases the probability of a successful search.
Well, it is clear that there are still limitations there. For example, I act like this:
- I set the minimum required expectation in pips (just taking into account the spread, I also add the commission and swap, approximately).
- I set the minimum required number of trades, which I need taking into account the length of the considered section
- I adjust the curve matching factor
It's clear that there are still limits. This is how I operate:
- I set the minimum required mat expectation in points (just taking into account the spread, I also add the commission and swap, approximately).
I don't do that. Market regularities do not depend on broker's trading conditions. I am inclined to this.
Forum on trading, automated trading systems and testing trading strategies
Machine learning in trading: theory, patterns, practice and algo-trading
fxsaber, 2023.08.19 11:10 AM
Broker for historical data to choose by the highest potential profit. For example, the potential of EURUSD_Broker1 is higher than that of EURUSD_Broker2. Then take EURUSD_Broker1.
Both majors and crosses can be scalped. But not all of them. Just train on each of them and see the results. That's what I do, roughly speaking.
I.e. it is logical to search where the concentration of "gold in the rock" is higher.
- I set the minimum required number of trades that I need given the length of the area in question
- Adjusting the curve-fit factor.
I don't understand the connection of the TS to the spread.
- Например, можно обучить ТС, чтобы выдавал PF>2.5. При должном количестве сделок это почти автоматом выдаст красивую кривую
I agree with the rest.
.
- I don't understand the connection of the TS to the spread
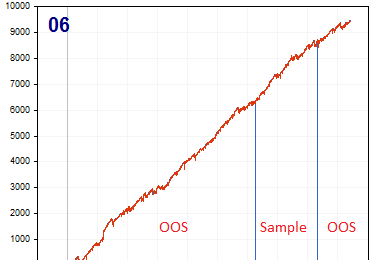
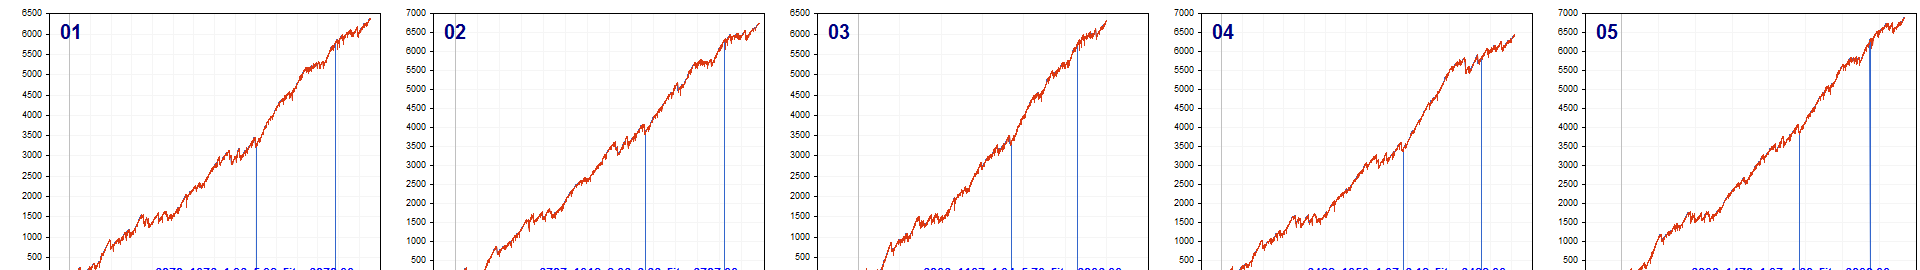
It would be interesting to see many curves selected in this way (MaxBalance criterion "not by prettiness").
This was the sixth result in the corresponding opt-file. The first five look worse.
I do a small number of GA passes so that the input parameter sets are not close to each other.
I have an impression that there are some approaches to building a TS, when MaxBalance criterion with a limit on the number of trades from below always gives a beautiful curve on Sample. In this case such a TS can be considered as something rational, even if there is a complete loss on OOS. But it seems doubtful to search for beauty by Sharpe, R^2 or criteria in this article. Perhaps I am wrong.
- Free trading apps
- Over 8,000 signals for copying
- Economic news for exploring financial markets
You agree to website policy and terms of use
Check out the new article: Brute force approach to patterns search (Part VI): Cyclic optimization.
In this article I will show the first part of the improvements that allowed me not only to close the entire automation chain for MetaTrader 4 and 5 trading, but also to do something much more interesting. From now on, this solution allows me to fully automate both creating EAs and optimization, as well as to minimize labor costs for finding effective trading configurations.
The most important element in the whole idea is the interaction system between the terminal and my program. In fact, it is a cyclic optimizer with advanced optimization criteria. The most important ones were covered in the previous section. In order for the entire system to function, we first need a source of quotes, which is one of the MetaTrader 5 terminals. As I already showed in the previous article, quotes are written to a file in a format that is convenient for me. This is done using an EA, which functions rather strangely at first glance:
I found it quite an interesting and beneficial experience to use my unique scheme for the EA functioning. Here is only a demonstration of the problems that I needed to solve, but all this can also be used for trading EAs:
Author: Evgeniy Ilin