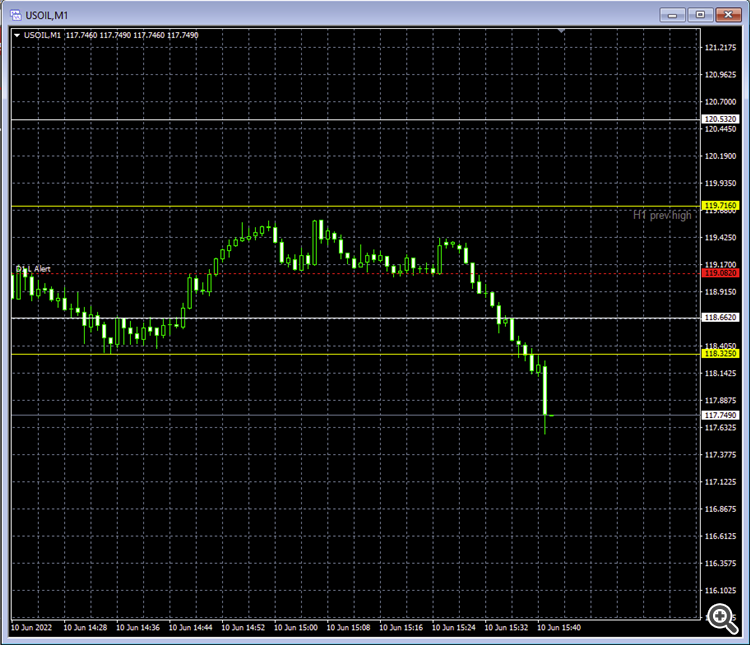
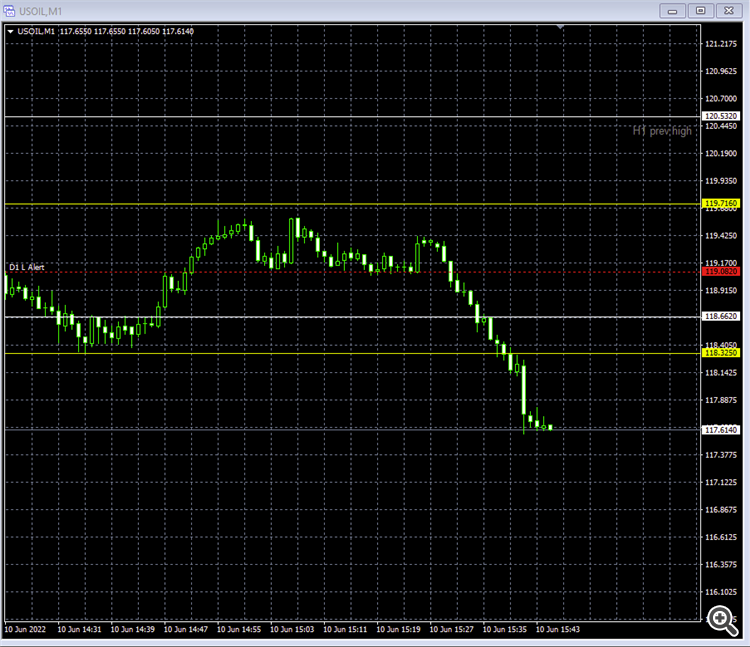
I resolved by using this:
   datetime text_placement = iTime(NULL,0,0)+12*100;
   ObjectCreate(0,"H1_label", OBJ_TEXT, 0, text_placement,0);
   ObjectSet("H1_label",OBJPROP_TIME1,text_placement);

- 2022.06.10
- www.mql5.com
Why do you keep calling it a label when it is a text object?
How To Ask Questions The Smart Way. (2004)
Be precise and informative about your problem
A label is different. It does not move as price shifts. The text will move, and that is not what you want.
Convert the price/time[0] coordinate to XY and position the label there.
Hi, sorry I’m a noob and found the difference only after submitting the question.
I also tried using a label and converting price value to x-axis value but with no success, I searched around forums but found nothing. I see there is function ChartPriceTimetoXY but it return a boolean result and I don’t understand how to use it to my purpose. Perhaps if you have some time to illustrate how to do I would be very grateful to you.
Thanks for your reply by the way ✌️
-
“Doesn't work” is meaningless — just like saying the car doesn't work. Doesn't start, won't go in gear, no electrical, missing the key, flat tires — meaningless.
How To Ask Questions The Smart Way. (2004)
When asking about code
Be precise and informative about your problemThere are no mind readers here and our crystal balls are cracked. Always post all relevant code (using Code button) or attach the source file.
How To Ask Questions The Smart Way. (2004)
Be precise and informative about your problem -
#define CURRENT_WINDOW 0
#define MAIN_WINDOW    0
datetime t=…; double p=…; // Price of the HLine
int      x,y; ChartTimePriceToXY(CURRENT_WINDOW, MAIN_WINDOW, t, p, x, y);
MoveLabel(name, x, y);
Hey man, thanks now I understand how that function works. Here's what I did:
   ObjectCreate(0,"H1_label",OBJ_LABEL,0,0,0);
   int x,y; ChartTimePriceToXY(0,0,TimeCurrent(),iHigh(NULL,60,1),x,y);
   ObjectSet("H1_label",OBJPROP_XDISTANCE,10);
   ObjectSet("H1_label",OBJPROP_YDISTANCE,y);
   ObjectSetString(0,"H1_label",OBJPROP_TEXT,"Thank's man  :)");
   ObjectSet("H1_label", OBJPROP_CORNER, 1);
Here’s the desired result:
Sorry if my questions are dumb. Anyway, I have one more of them (sorry I’m still learning), if instead of “TimeCurrent()” I put 0 inside the function, like this:
ChartTimePriceToXY(0,0,0,iHigh(NULL,60,1),x,y);
Then the label does not place correctly, it goes not to the desired price level, see here:
As you can see it’s messed up. Why this happen? On the object itself I didn’t put the value of x, I just typed “10” on the ObjectSet because it’s the value that better fit my screen… why the value x influence the position of the label even dough it’s not inserted into the object?
Hope my question is clear enough. Thanks.
Wrong. The label has been correctly placed. Zero means 1970. Your label is off-screen as you requested.
Yes I get that 0 means 1970, but:
   ObjectCreate(0,"H1_label",OBJ_LABEL,0,0,0);
   int x,y; ChartTimePriceToXY(0,0,0 ,
© ,x,y);
	//Now x=1970 and y= prev H1 high. At this moment the label have no coordinates, they are stiill 0,0
   ObjectSet("H1_label",OBJPROP_XDISTANCE,10); //With this I apply a value of 10 to x-axis
   ObjectSet("H1_label",OBJPROP_YDISTANCE,y); //With this I insert the y value
	//As you can see only y has been used, x is not used and still it mess up the location of label
   ObjectSetString(0,"H1_label",OBJPROP_TEXT,"Thank's man  :)");
   ObjectSet("H1_label", OBJPROP_CORNER, 1);
Edit: ok now I think I get it.... The ChartTimePricetoXY function apply "iHigh(NULL,60,1)" on the point of time I requested, hence it goes to search the previous High on H1 of the first bar in 1970... Now I get it, thank's for your time.
ObjectSet("H1_label",OBJPROP_XDISTANCE,10); //With this I apply a value of 10 to x-axis
Now you move the label to 1970+10 seconds.
- Free trading apps
- Over 8,000 signals for copying
- Economic news for exploring financial markets
You agree to website policy and terms of use


Hi everyone, I would like to plot a label on the same price value of an horizontal line and on the extreme right of the chart(that's the point where I need help), ideally the result would look like this:
As you can see, the yellow line represent prev. High and Low of H1 while white ones H4. If the previous H1 bar was bullish, then a label "UP" will appear next to the H1 prev. High hline, vice versa for low... and of course the same apply to H4.
Can you help me? Thank's.