From theory to practice - page 40
You are missing trading opportunities:
- Free trading apps
- Over 8,000 signals for copying
- Economic news for exploring financial markets
Registration
Log in
You agree to website policy and terms of use
If you do not have an account, please register
It would be nice to warn you once again that you've posted an incomplete version, so that people don't suffer and look for something that isn't there).
Yes, yes, that's right. This is the DEMO version.
I've said many times that this thread is for the thinking and persistent. There's a lot of them here. It just takes time to assimilate the material. But I'm not a genius too - I may be wrong in theory somewhere, but not too much :)))))).
All I need for work is a sofa. Everything else is superfluous. So are anyone else's wants and advice, much less tips. If you need it, I'll ask for it.)
And you - I want people to THINK and work independently. I will only occasionally prompt the most persistent ones.
Wow.))
As they say - Counselor, remember - counselors beat.)
Ha! I respect that - I'm like that myself. Sorry, Yuri.
IMMEDIATELY!!! I do not and will not give anyone the final version of the program. I want people to THINK and work independently. I will only occasionally prompt the most persistent ones.
The ticks will come as the dtz/broker wishes and the dtz/broker will not say why. The "picture" will be both completely different and similar for different dts/brokers.
No need to give, show your integral/differential visually.
Right click on the Ask and Bid .csv export blocks and set the time to Fixed Interval. This time should match the time in the Time Step field in the Simulation Properties menu. By doing so, you are selecting the speed of the tick reading.
You got me wrong. The simulation can read ticks at 1 gigahertz, it makes no difference. What matters is how much time there really was between ticks coming in. To do this, time stamps are assigned to the ticks. Your data just doesn't contain them.
What learning?) What material?))) You've just posted an unworkable "material", and now you're offering to guess the thoughts in your head, because there is no market sense in this material.
In short, waiting for a test of the "real" system, but I think it will not be better than the demo version)
p.s. I have no goal to twist the grail, I have nowhere to put mine) I'm just telling you that your model is a total delusion) it has not yet managed to prove the opposite.
You misunderstand me. The simulation can read tics at 1 gigahertz, it makes no difference. What matters is how much time there really was between ticks. To do this, time stamps are assigned to the ticks. Your data just doesn't have them.
Anyway, I gather that the model proposed to us is a meaningless hollow, so wait for the test of the "real" model, until then it's all empty talk)
Yeah. I'm working on it. Made 3 pairs for simultaneous trading so far. Need 36!!!! Tough, my friends... Tough.
It looks like this: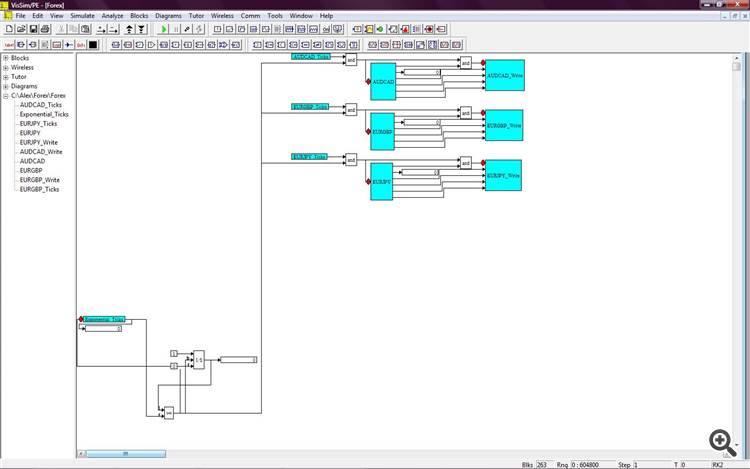
See the pulse generator on the bottom left to read ticks at exponentially distributed time intervals?
Yes, that's how I'll be collecting ticks and keeping my own historical archive.
No one has suggested better yet...
Regards,
Alexander.
Yes. Working. Made 3 pairs for simultaneous trading so far. I need 36!!!!. Tough, my friends... Hard.
It looks like this:
See the pulse generator at the bottom left to read ticks at exponentially distributed intervals?
Yes, that's how I'm going to collect ticks and keep my own historical archive.
No one has suggested better yet...
Regards,
Sincerely Alexander.
All you need is already there: https://www.mql5.com/ru/forum/154818
The only thing left is to apply your formula to available data and show the result.
Everything you need: https://www.mql5.com/ru/forum/154818
All you need: https://www.mql5.com/ru/forum/154818
You'd better do and post an adequate test in MT on one pair, but over several years. You'll learn a lot. And it will at least be a sensible post and not a cheeky trolling.
I would answer you, but here MQL is like a dead man - it's either good or nothing.
Just what the search found. There is no happiness in naked tics. So there is no way.