From theory to practice - page 160
You are missing trading opportunities:
- Free trading apps
- Over 8,000 signals for copying
- Economic news for exploring financial markets
Registration
Log in
You agree to website policy and terms of use
If you do not have an account, please register
No way - 2 and full stop.
See attached file. Now just make sure that at increments >=25 pips the trend starts. It has to be there, because the "memory" with previous distribution is lost almost completely.
Even old Larry remembered to write that trends start with "explosions". Personally I am not looking for "trends" or "flats" for a long time, and I am not even trying to separate one from the other. (In general, I gave up these notions, when looking at market charts and building systems).
P.S.
Apologies for the wildest offtops, but I am in urgent need of advice. There are pseudorandom numbers from 1 to 42, generated in series of 7 numbers. Need at least 3-4 of them to "guess" with acceptable probability. I started today with linear congruent PRNG, I guessed that it's impossible to be so lucky, but I have to start somewhere.
The attempt to calculate the coefficients using thehttps://nauchforum.ru/studconf/tech/xli/17030 algorithm failed, of course. But when I tried to pick coefficients "by hand", i.e. with a simple search of all variants, I managed to get something. That is, for some sets a, c, m the LKGPSF algorithm(ki=(a*ki-1+ c)mod m) perfectly calculates some numbers in a row. I've never tried to use PRNG before, I was surprised by such an accuracy. (I'm used to random numbers, but here I've got lotto results and the program works like clockwork.)
But still stability is not enough. Then everything crashes, coefficients change. Apparently somehow cunningly depend on the previous number or something randomized. Iron resources are not enough to go through and investigate everything.
I guess the algorithm is somewhere near to linear congruent PRNG? Any advice on where to go next?
There are pseudo-random numbers from 1 to 42, generated in a series of 7 numbers. Need at least 3-4 of them to "guess" with acceptable probability. I started today with a linear congruent PRNG, I guessed that I couldn't be that lucky in principle, but I have to start somewhere.
If you know the formula or program code of this gpsh, you may get an array of integers given out by it, and then using this technique try to restore the current state of internal variables of gpsh and calculate the following numbers
https://yurichev.com/writings/SAT_SMT_draft-RU.pdf chapter 7.7
Thanks. Trying to guess the formula, the numbers in the file are clearlyki=(a*ki-1+s)mod m)
Ha! You're right. I got +10% yesterday and now I'm in the red on USDJPY. SanSanych and bas were right - the trend is not processing well. However, the algorithm is still awesome and fully justified. I specifically did some additional research - this algorithm actually describes the movement of the centre of distribution of pair increments relative to 0. But, that's not enough - I agree.
And the euro is probably not all that smooth either.
It's just that you are beating around the bush. There is no Nobel, as practically everyone here is doing so well. It's just that some are closer and some are farther away.
I don't recommend a real with this kind of thing.
Good luck!
And the euro is probably not all that smooth either.
It's just that you are beating around the bush. There is no Nobel, because practically everyone here is doing so well. It's just that some are closer and some are farther away.
I do not recommend a real with this kind of thing.
Good luck!
I think a thorough analysis of this USDJPY (-1000 pips) trade will clarify a lot. If I do not understand why it happened and cannot explain this shame in a reasonable way - I will quit Forex unambiguously (what did Einstein say? That's right - "he who works persistently but in vain over a problem is a madman". Terrible diagnosis, if you think about it). Without understanding the causes and mechanism of what happened there is nothing to do on it - just wait for a complete drain. Totally agree.
What's there to understand, sitting in a range, all those who are trend-following have left (shaken out) the market. Only the flutists were left.
After this relief the market moved to a new range, and all the flutists in the drawdown.
I say we need something that signals when the trend changes from trendy to flat and vice versa.
If we have it, we can trade: at flat, on the breakout of the borders, on trend, on the breakout of the borders. In other words, mutually exclusive strategies, hence it is important to know in what state the market is now.
This approach excludes problems with false-breaks or false rebounds.
I mean before a breakout candle has occurred.
What's there to understand, sitting in a range, all those who work on the trend have left the market (shaken out). Only the flutists were left.
After this relief the market moved to a new range, and all the flutists in the drawdown.
I say we need something that signals when the trend changes from trendy to flat and vice versa.
If we have it, we can trade: at flat, on the breakout of the borders, on trend, on the border breakdown. In other words, mutually exclusive strategies, hence it is important to know in what state the market is now.
This approach excludes problems with false-breaks or false rebounds.
I mean before the breakout has occurred.
Let's do some analysis.
I have 18,000 bars on H1.
We mark them with perfect trends with ZZ. My ZZ has a parameter - the minimum number of pips after which it is considered a reversal. I set it = 100 pips, i.e. I do not have trends with less than 100 pips change.
Then I calculate the number of bars between the reversals horizontally, i.e. duration of trends in bars.
Out of 18 000 bars of the initial file 276 changes of the trend were obtained
Final data
The table shows that there are jumps of more than 100 pips with the distance between the reversals of 1 bar. Besides, 25 per cent of the intervals between the reversals are more than 79 bars, i.e. the trend lasted more than 4 days
Let's calculate in details
We see that 90% of the trends over 100 last almost 6 days.
What is a sideways trend in this classification? The remaining 10%?
Let's look at the frequency characteristics of trend durations. This is probably the most interesting
Looking at this picture, the question is: can anything be predicted? It seems to me that the distance between trend changes obeys the uniform law of distribution.
My conclusion:
It's a futile exercise to predict a trend change.
Now look what happened to me on USDJPY: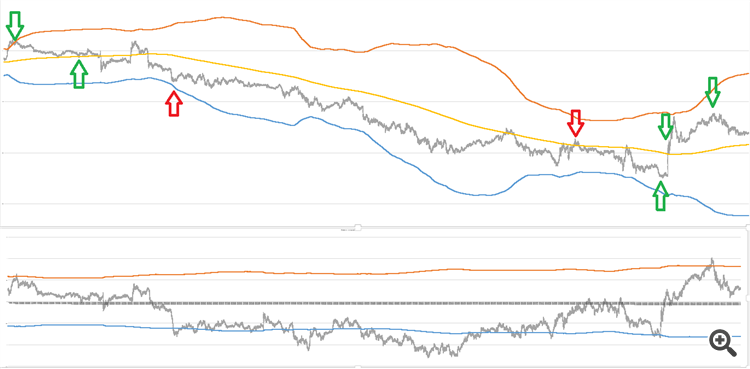
Above - chart of USDJPY proper and Bollinger Bands with 4*sigma. The sample volume is 25.600 ticks, which corresponds to the 99.5% confidence interval of the wave packet of tick increments. I.e. we see the wave packet of the price and its movement VERY completely.
The trades were made on the lower chart (see the algorithm outlined in this thread).
A cool 3 trades at a gorgeous profit. And one of the most shameful deal in the deepest minus of 1000 pips (highlighted by red arrows).
So I look and look at these charts this way and that, and I understand that - everything is gone, Alexander_K and Schrodinger's cat (sitting next to me with bulging eyes and can't say anything)...
What am I supposed to do - keep 3 green deals and remove 1 red one?
That's it - time to call it a day and get away from Forex.
And one most disgraceful trade in deepest negative 1000 pips (highlighted by red arrows).
...
I can't understand - what was the reason for keeping 3 green trades and removing 1 red one?
No one is immune to losing trades. Losses are part of the trading business. Unfortunately, black swans (see Nassim Taleb's book) are much more common than one would like.
Perhaps the only way to limit losses is to place a stop loss. But it is far from certain that with it the TS will be profitable.