From theory to practice - page 140
You are missing trading opportunities:
- Free trading apps
- Over 8,000 signals for copying
- Economic news for exploring financial markets
Registration
Log in
You agree to website policy and terms of use
If you do not have an account, please register
Again you are fooling yourself.
Your upper chart is not a price chart. Price cannot go negative. It is an incremental chart!
It is a cumulative of zero-point increments at the start of the window. In fact, it can be considered as a price chart in pips.
The only difference from the real price is that there is no reference to specific levels, which many (myself included) consider an important part of TA.
Sergey, you're scaring me...
Time to get out of here, though!
Alexander, sign the charts properly in Excel. And to avoid unnecessary questions maybe you should bring the price chart in the pair to the top? :-)
Well done, you keep your tail up...
Colleagues don't forget about the tails. Fat tails are our everything :-))
This is the cumulative zero-point increments at the start of the window. In fact, you can think of it as a price chart in pips.
It differs from the real price only in that there is no reference to specific levels, which many people (myself included) consider an important part of TA.
Aha, the incremental chart after all!
Why is the graph below the zero point also positive?
Alexander, sign the diagrams properly in Excel.
Because the average always follows the price. Either the price to the average or the average to the price.) On a chart relative to the average, we will either way get a pullback.
Man, I'm tired of repeating that there are NO MACHINES!!! We open a trade when the average value of increments (lower chart) crosses the 99.5% confidence level, and close when this average value of increments becomes = 0.
Compare the lower average increment chart with the upper chart of the price itself.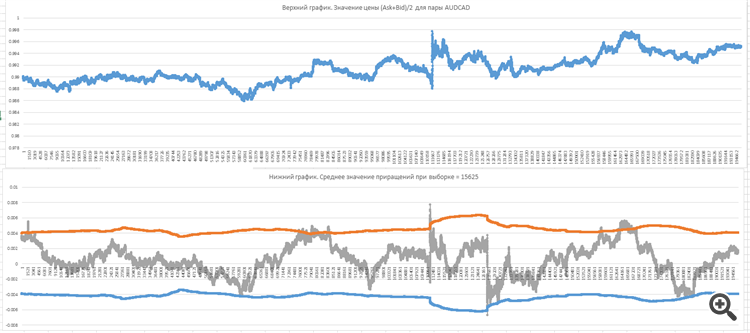
It is a VERY robust robust system. There is no need in endless searches for the right average. I do not see loss-making trades in 4 days this week for AUDCAD pair from the word "at all".
You take last week's AUDCAD. Or for December. Or for January 2017. That would be a more reasonable check.
And in a flat market any system will work, on any indicator, even the most primitive. It's called fitting.
And trades should be looked at price, not increments, deviations, etc, you're not trading increments.
Man, I'm tired of repeating that there are NO MACHINES!!! Open a trade when the average value of increments (bottom graph) crosses the 99.5% confidence level, and close when this average value of increments becomes = 0.
Compare the lower graph of the average value of increments to the upper graph of the price itself.
A VERY robust robust system. No need to endlessly search for the right average. I do not see loss-making trades of AUDCAD during 4 days this week from the word "at all".
There are no MAs, but reasoning remains at the same level.
Let's draw some MAs, look for entries and exits and I assure you - not a single losing trade)).
You take last week's AUDCAD. Or for December. Or for January 2017. That would be a more reasonable check.
And in a flat market any system will work, on any indicator, even the most primitive. It's called fitting.
And trades should be watched on price, not increments, deviations, etc., you're not trading increments.